


Crop Megadisaster in China: Are You Prepared?
Sep 24, 2014
Event: Catastrophic agricultural losses due to flood, drought, wind, and frost/freeze
Model: AIR Multiple Peril Crop Insurance Model for China
Stochastic Year ID: 510007095
Affected area: Most of eastern China and isolated areas to the west
Estimated ground-up loss: CNY 35.8 billion (USD 5.8 billion)1
Annual loss exceedance probability ~1% (100-year return period)
Event Overview
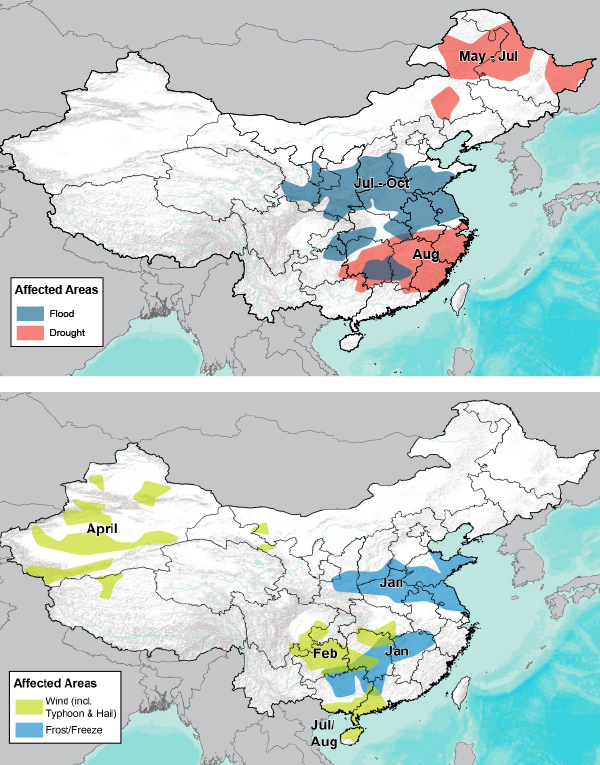
This edition of Megadisaster features a high loss crop year for China, consisting—like every crop year—of a number of weather events that affect multiple regions of the country at different times of the year. Several winter storms sweep through China in January, bringing frost and freeze to southern and central provinces. In February, the southern province of Guizhou is hit by a severe hailstorm. April brings severe thunderstorms with damaging straight-line winds and hail to Xinjiang in the west.
By May, drought is established in northeast China. Dry conditions persist in Heilongjiang and Inner Mongolia through July. In the south, low precipitation leads to drought damage in Hunan and Jiangxi in August.
In other regions, this year is an exceptionally bad one for flooding, with several major river basins affected from late June through October. In total, flooding inundates almost 10 million hectares of farmland, damaging corn, cotton, rice, and soybeans. It is an average year for typhoons with eight landfalling tropical cyclones. Notably, typhoons hit Guangdong and Guangxi in July and again in August.
Figure 1 shows the areas impacted by different perils over the course of the year.
Although this year is not dominated by a single disastrous event, the accumulation of losses from different events and different perils combine to make this a megadisaster year. AIR estimates that if such a year were to actually happen today, insurable losses would total CNY 35.8 billion (USD 5.8 billion), corresponding to an exceedance probability of approximately 1% (or a return period of 100 years). Insured losses (accounting for actual coverages and take-up rates, but not the government protection that caps losses in some provinces) would amount to CNY 13.5 billion (USD 2.2 billion), which has an exceedance probability of 0.8% (return period of 125 years).

Crop Damage in China
China is a vast country with multiple climate zones, ranging from subtropical to subarctic, and it is subject to a wide range of weather events throughout the year—including drought, excessive precipitation, freeze/frost, hail, floods, and severe wind. Both significant individual weather events and the combination of successive or simultaneous events can result in crop damage.
In mainland China, weather is to blame for 90% of all crop losses (disease, insects, weeds and other pests account for the other losses). According to the World Bank, drought (a significant risk in all regions) and flood (risk concentrated in the southeastern provinces) account for 80% of crop damage.
The AIR Multiple Peril Crop Insurance (MPCI) Model for China model covers six major crops in China: corn, cotton, rapeseed, rice, soybeans, and wheat. These are grown in many regions of mainland China. Depending on the stage in the growing season at which an adverse weather event occurs, crop damage can be more or less severe. Corn yields are particularly susceptible to drought during the late vegetative and early reproductive stages. Cotton is highly susceptible to lack of oxygen (such as that caused by flooding) or too much or too little moisture during germination.
Finally, the effects of weather on crops are not always immediate. Although a crop may suffer a setback during a dry spell, it may subsequently recover. It is the sum of all weather-related effects that determines the final damage to a crop at harvest time. The AIR MPCI Model for China employs AIR's sophisticated Agricultural Weather IndexTM (AWITM) to accurately capture the severity, frequency, and location of future adverse weather events, while also correctly preserving the timing of events during the season and their cumulative impact at harvest time.
Affected Exposure
This Megadisaster scenario year features many adverse weather events throughout the year. Top loss-causing events include:
Frost/freeze
- Frost damage to rice and corn in the provinces of Guangxi, Hunan, and Jiangxi and to winter wheat in Hebei, Shandong, Shanxi, and Henan in January
Wind/hail
- Severe hailstorm damage to winter rapeseed in Guizhou in mid-February
- Severe thunderstorms damaging cotton in Xinjiang in April
Drought/fire
- Drought damage to summer crops (including corn, rice, soybeans, and wheat) in Heilongjiang and Inner Mongolia from May to July
- Drought damage in Hunan and Jiangxi in August, particularly to rain-fed rice at the stage when it's most vulnerable to drought stress
- Persistently dry conditions lead to damaging forest fires in the northeast (not included in crop loss estimates, see text box for more information)
Flood
- Continuous torrential rains from late June through the first three weeks of July cause flood damage to crops along the Huai River and displace over 1 million people in Anhui, Henan, and Jiangsu
- Damage from flooding of the Wei River in July, in usually drought-prone Shaanxi
- From the end of July through October, flood damage in the Yellow River basin, affecting Shaanxi, Shanxi, Hubei, Henan, and Shandong
- Several dikes in Lankao County in Henan burst in October, and low-lying areas of neighboring Shandong are also inundated
- Crops affected by flooding include corn, cotton, rice, and soybeans
Figure 2 shows the impact of each peril to the modeled crops. (Note that in the AIR model, the wind peril implicitly includes hail damage.)
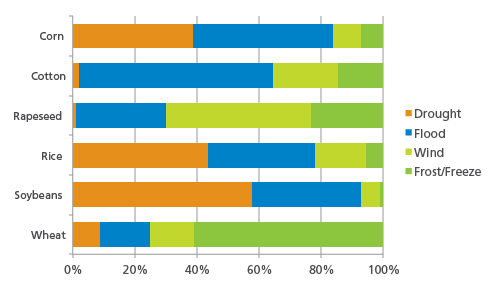
Throughout the affected regions, damage varies in nature and in severity; it is the widespread nature of the events that results in high aggregate losses for the year.
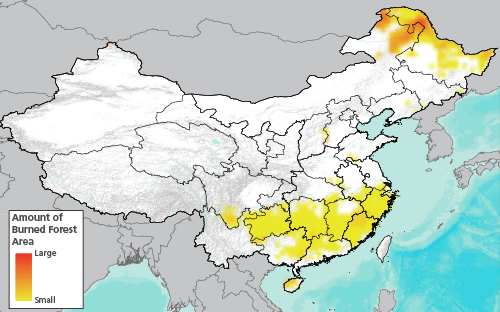
Forest Fire in the Megadisaster Scenario
The summer drought in northeast China results in an active wildfire season. Fire hits repeatedly, damaging 150,000 hectares in Heilongjiang and 220,000 hectares in Inner Mongolia. Figure 3 shows the forested areas burned in the scenario year.
The AIR China MPCI model includes a forestry line of business covering losses from fire—one of the major perils affecting forests. AIR estimates that the simulated year would cause an insurable loss of CNY 16.6 billion (USD 2.7 billion) to forestry, representing a 13-year return period for fire losses. The estimated insured loss is CNY 70 million (USD 11.4 million). In Heilongjiang and Inner Mongolia, the loss ratios are 65% and 230%, respectively. Despite the large insurable losses, the Megadisaster scenario for forest fire is not an extreme tail scenario; far greater losses are possible. (Note that forestry losses are not included in the crop loss estimates in this article.)
Estimating the Impact
AIR estimates that the simulated crop year featured here would cause insurable crop losses of CNY 35.8 billion (USD 5.8 billion), of which CNY 13.5 billion (USD 2.2 billion) would be insured. Figure 4 shows the highest modeled loss ratios (the loss compared to the premium) by province and the fractions attributable to the four modeled perils for crop.
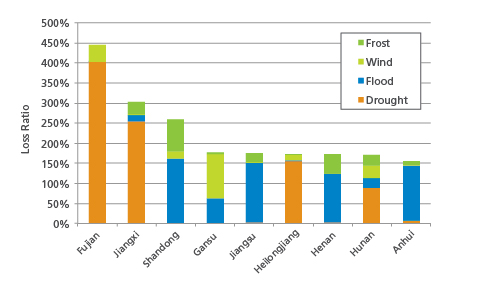
Figure 5 shows the modeled insurable and insured losses in the provinces with the highest loss ratios, including losses in the most heavily affected provinces.
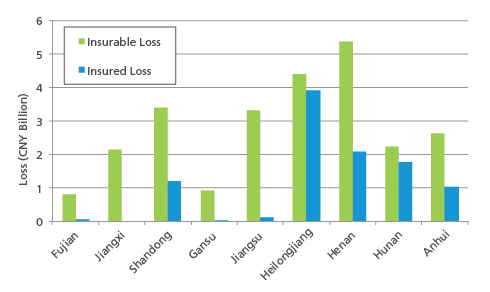
The provinces of Henan, Jiangsu, and Anhui see large flood losses despite the flood mitigation afforded by the Three Gorges Dam. Based on the 2012 exposures but absent flood control, AIR estimates that the losses in those three provinces would be 25% higher.
While the return period of insurable losses for all of China is 100 years and the corresponding loss ratio is 119%, it is clear that losses are not distributed uniformly among the provinces. Eleven provinces have loss ratios greater than 119%. Among all provinces, only Fujian and Jiangxi exhibit insurable loss return periods that exceed 100 years—2,500 and 323 years, respectively—and they account for 8% of the total gross insurable loss. Henan alone accounts for 15% of the total loss with CNY 5.4 billion (USD 0.9 billion), which is a 15-year return period loss for this province.
Are You Prepared?
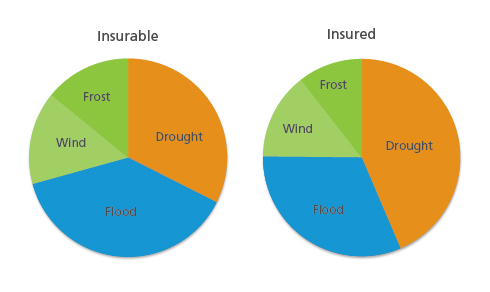
In this Megadisaster scenario, drought and flood account for 71% of the insurable and 75% of the insured losses to crop. Figure 6 shows the relative impact of the four principal perils for crops. A complete view of the risk requires considering all weather perils, as well as the impact of smaller, less catastrophic events in all provinces of China.
Based on 2012 exposures (from AIR's database), this Megadisaster scenario is worse than any crop year in recent history, including the high loss years of 2000 and 2003. In 2000, China experienced an aberrantly long and damaging drought. Considered one of the most severe since 1949, almost every region of the country was affected by drought conditions at some point during the year, and the wheat crop was especially hard hit. In 2003, spring drought in the northeast and widespread summer flooding caused major losses to corn and cotton. Modeled insurable losses for a recurrence of these historical years are shown in Table 1.
| Year | Insurable Loss (CNY Billions/USD Billions) | Contribution to Losses from Drought | Contribution to Losses from Flood |
2000 | 30.4/5.0 | 48% | 25% |
| 2003 | 28.4/4.6 | 30% | 40% |
| Megadisaster | 35.8/5.8 | 32% | 38% |
If CNY 35.8 billion (USD 5.8 billion) seems like a high level of loss, it is important to remember that the scenario described here is just one example of the extensive and widespread damage that a combination of severe weather events could produce in China. The insurable loss associated with this event has an annual exceedance probability of 1% (roughly a 100-year return period loss). It should not be considered an extreme tail scenario because greater losses are entirely possible and should be anticipated.
The AIR MPCI Model for China provides a probabilistic view of a full range of potential losses to a crop portfolio. Following a few modeling best practices will enhance confidence that the model is producing the most realistic loss estimates:
- Whenever possible, collect and enter detailed and high resolution (e.g., county-level) input data by crop
- Be aware that insurance policies differ from province to province and some perils are not covered in all provinces; appropriate peril filtering will significantly decrease the risk to your portfolio
- Be aware of non-modeled sources of potential loss. Not discussed in this scenario, for example, is damage from pests and disease and damage to greenhouse vegetables
Closing Comments
What will the next megadisaster surprise be?
AIR's models capture the behavior of physical phenomena and how those phenomena impact the exposures at risk. They have been thoroughly validated using data from a wide variety of sources. But no model can predict what the next mega-catastrophe actually will be or when it will occur. This fundamental uncertainty makes it all the more important for companies to use catastrophe models to prepare for such losses.
In the context of catastrophic events, it is now well understood that historical loss data alone is insufficient for estimating future losses. Therefore, to capture the full range of possible future crop losses in China, AIR takes a probabilistic approach by simulating tens of thousands of possible scenario years, each with a plausible, but slightly different combination of perils and parameters. The reason catastrophe models' so-called "stochastic catalogs" of simulated events are as large as they are is to ensure that stakeholders are provided with scenarios representing the entire spectrum of potential crop loss experience, including the most extreme and rare events that make up the tail of the statistical distribution—events that may not yet have occurred in the historical record.
The careful analysis of model results can help risk managers prepare for many contingencies, thus ensuring that scenarios like the one presented here will not be entirely unexpected.
1 All USD amounts are based on an exchange rate of CNY 1 = USD 0.16, current as of mid-September, 2014
