


Wind and Water: Modeling Tropical Cyclone Risk in India
May 24, 2012
Editor's Note: In this article, Dr. Peter Sousounis, AIR Senior Principal Scientist, and Aditya Kistemasetty, AIR Engineer, discuss tropical cyclone risk in India, the growing insurance market, and how the forthcoming AIR Tropical Cyclone Model for India can be used to gain valuable insights into this risk.
India, home to 1.2 billion people, is one of the fastest growing economies in the world. It is also vulnerable to several types of natural disasters, including cyclones, earthquakes, droughts, and floods. According to the Ministry of Home Affairs in India, annual economic losses from natural hazards have more than tripled during the last three decades, with losses during this period estimated at over USD 48 billion1.
Roughly 60% of India's landmass and more than 5,700 kilometers of the coastline is exposed to tropical cyclones. And while cyclones in India are well known for their powerful and destructive winds, they can also produce copious amounts of rainfall, which can lead to inland flooding—a significant driver of loss in the region.
As India's economy grows and global markets become increasingly interdependent, the insurance industry is turning its attention to the potential for large losses in the region. In a positive development, sophisticated modeling tools are being developed to help insurers understand the scale of risk they face. In this article, we examine India's tropical cyclone climatology and how the soon-to-be-released AIR Tropical Cyclone Model for India can help companies assess and manage the potential losses caused by these high impact events.
Monsoons and India Tropical Cyclone Climatology
The North Indian Ocean basin generates an average of five to six storms at tropical storm strength or higher per year. While fewer storms form here than in other basins around the world, the North Indian Ocean is a breeding ground for some of the most intense cyclones in the world. Since 1990 there have been six storms that have impacted India or nearby countries with wind speeds greater than 190 km/h (118 mph and a Category 3 on the Saffir-Simpson Scale), making up 7.5% of all named storms in the basin. This is the highest percentage of super cyclonic storms in all basins worldwide.
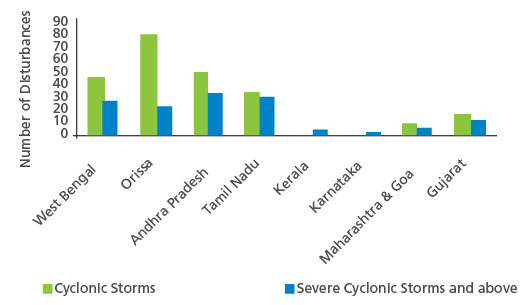
While India cyclones can follow a number of tracks, their origins can usually be traced to the same body of water—the Bay of Bengal to India's east. Indeed, cyclones are four times more likely to form here than over the Arabian Sea (Figure 1). One such storm was the 1999 Super Cyclone Orissa, which brought high winds and record-breaking flooding in low-lying areas, damaged more than 10,000 houses, destroyed some 2.1 million hectares of farmland, and caused more than USD 100 million1 in insured losses.

By: Dr. Peter Sousounis and Aditya Kistemasetty
Edited by Virginia Foley
The article: Discusses AIR's approach to modeling tropical cyclone risk in India, with a particular focus on precipitation-induced flooding.
Highlights: Using the AIR model, two simulated scenarios are presented that illustrate the importance of understanding and capturing the significant variability of losses caused by these storms.
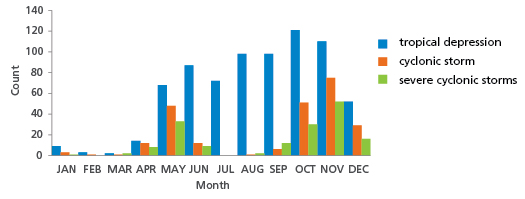
The seasonality of cyclones in the region is related to a large-scale factor of the climatology—the monsoon. The North Indian Ocean tropical cyclone season extends from April to December, with peaks in activity during May to June and October to November (Figure 2). Few strong storms form in July, August, or September, which are considered prime months for tropical cyclogenesis in other northern hemisphere oceanic basins. The suppression of activity during these months is directly related to the strength and position of the North Indian Ocean Monsoon, which tends to shear storms apart and prevents them from intensifying.
However, once a system forms, even cyclones with weak winds can cause catastrophic damage. In 2008, Cyclone Nisha came ashore with wind speeds of just 65 km/h (40 mph and tropical storm strength on the Saffir-Simpson Scale), but it generated more than 1,000 mm (39 inches) of precipitation in some mountainous locations and damaged more than 4,000 properties.
Modeling Precipitation-Induced Flooding
As Cyclone Nisha so aptly illustrates, any model that purports to assess India's cyclone risk must capture the risk from precipitation-induced flooding. Indeed, storms needn't make landfall to produce flooding. Precipitation shields can extend hundreds of kilometers—far beyond a storm's damaging windfield. Thus even bypassing storms can produce substantial amounts of rain onshore—and if the storm is also slow moving, the potential for significant flooding is exacerbated. In this section, we take a closer look at AIR's approach to modeling the flood risk associated with cyclone activity in this region.
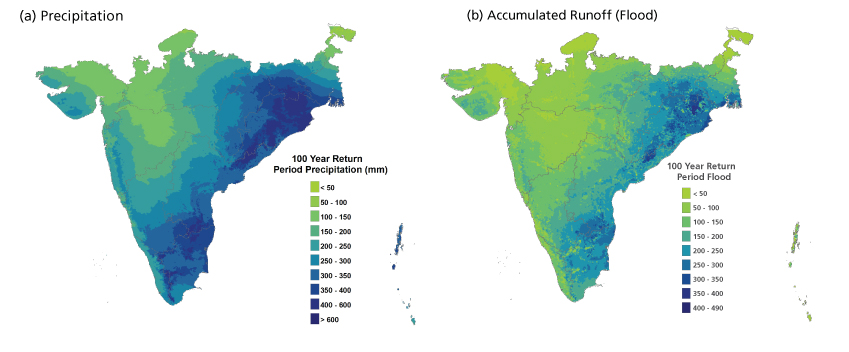
To determine the probability and severity of a flooding event, the AIR flood module begins by generating total event precipitation, which is determined by accumulating the hourly precipitation at each location over the entire duration of the storm. Since rainfall is accumulated over time, the forward speed of the storm is an important factor; slow-moving storms will subject any given location to higher rainfall totals. Unlike tropical cyclone winds, which generally decrease as a storm moves inland, precipitation can actually increase as the system moves inland.
After the total precipitation is calculated, it is then redistributed based on the porosity of the soil, land use/land cover and slope—all of which determine what fraction of the precipitation is absorbed. If the soil is sandy, for example, a higher fraction will be absorbed than if the soil is clay. The water that cannot be absorbed by underlying soils becomes surface runoff, or flood.
To estimate damage to buildings and contents caused by flood, the AIR model incorporates damage functions that vary by occupancy, construction, and—significantly—by height. Because damage is usually limited to the lower stories of a building, high-rise buildings will experience a lower damage ratio—the ratio of the repair cost and the total replacement value of the building—than low-rise buildings because a smaller proportion of the building is affected.
The Motivation: India's Evolving Insurance Market
The Indian insurance market has undergone a radical transformation in recent years. From 1972 to 1999, India's non-life insurance sector operated as a state monopoly under the General Insurance Corporation (GIC) and its four subsidiaries. The government introduced the Insurance Regulatory and Development Authority (IRDA) Act of 1999 to open the market to private insurers.
As of May 15, 2012, 24 non-life insurance companies are writing business in India and the non-life insurance market continues to grow. Insurance coverage varies by line of business; commercial and industrial insurance lead the market with take-up rates of around 20% and 26%, respectively. While private homeownership is increasing, insurance penetration for residential insurance remains low at around 4%, as most homeowners decline to purchase insurance.
Insurance policy conditions for flood are somewhat more complex than those for wind damage. Loss or damage to property is covered under a standard fire and special perils policy for residential and commercial risks. After the 2005 Mumbai floods (see sidebar), the four state-owned insurers, who continue to dominate the market, considered excluding flood from their household policies, but so far this change has not occurred.
What's at Risk: Two Scenarios from the AIR Tropical Cyclone Model for India
East Coast Scenario: A High-Wind Cyclone in Orissa
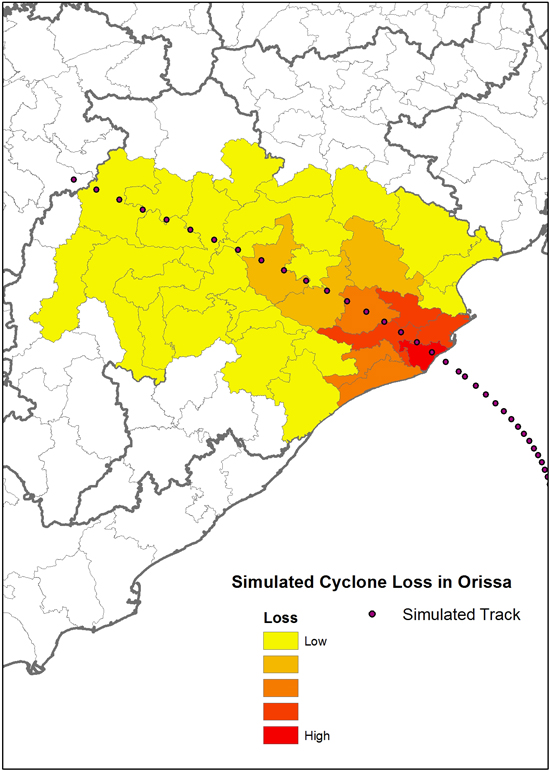
As was previously noted, tropical cyclone risk in India is most often associated with intense storms that affect the east coast. In 1999, for example, Cyclone Orissa made landfall in the state for which it was named at supercylonic (sustained wind speed measuring more than 221 km/h and a Category 5 on the Saffir-Simpson Scale) strength. However, due to lower exposure in 1999, insured losses were not very high. To assess the impact of a recurrence of the Orissa cyclone today—but a somewhat more intense version—we can examine one of the thousands of simulated events in the AIR model's 10,000-year catalog.
For this analysis, AIR chose a simulated tropical cyclone with a central pressure of 910 mb that made landfall in a similar location to 1999's Cyclone Orissa. The simulated storm brings sustained winds of 270 km/h or 168 mph (Cylone Orissa's winds were closer to 260 km/h or 162 mph) at landfall—making it a super cyclonic storm on the India Meteorological Department Scale and a Category 5 on the Saffir-Simpson Scale—and close to 400 mm (16 inches) of precipitation (Figure 4). This event results in insured losses to residential, commercial, and industrial buildings and contents of about USD 415 million, which corresponded to a 1.5% exceedance probability (65-year return period). In stark contrast, the insurable losses (losses to properties that are eligible for insurance, whether or not they are actually insured) from this event would reach USD 4.3 billion—almost ten times the insured losses.
West Coast Scenario: A Weak, but Wet Cyclone in Mumbai
While the 2005 Mumbai floods were not the result of a cyclone, AIR's Tropical Cyclone Model for India includes simulated events that generate analogous flood footprints. One such event is shown in Figure 5; this cyclone makes landfall with a central pressure of 985 mb and sustained winds of 122 km/h (cyclonic storm on the Indian Meteorological Scale and a Category 2 on the Saffir-Simpson scale). However, with a slow forward speed of 11 km/h (7 mph), the event dumps more than 400 mm (16 inches) of rain—comparable to the average totals from the two precipitation-monitoring stations during the Mumbai Floods (see inset). This simulated cyclone produces modeled insured losses of USD 620 million and insurable losses of USD 1.77 billion.
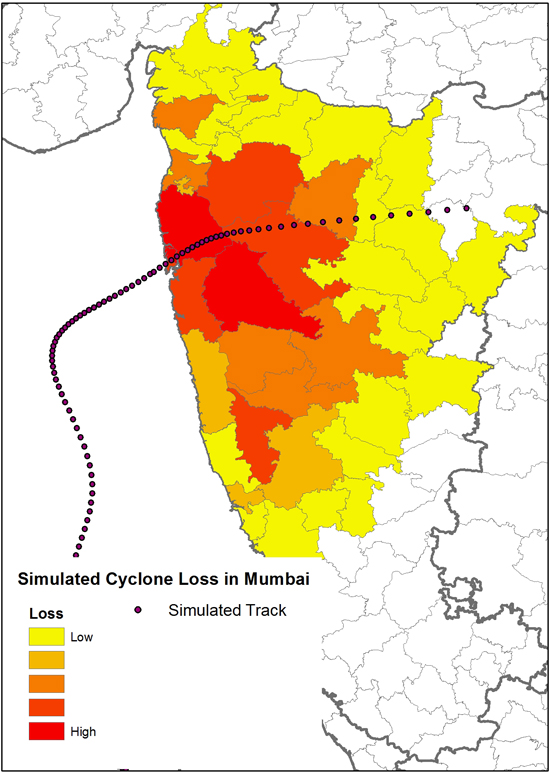
As this exercise shows, India's low insurance penetration has a tremendous impact on overall insured loss. The gap between insured and insurable losses clearly highlights the need for increased insurance coverage in India. Undoubtedly, this will change as awareness increases and new products are brought to the market.
Closing Thoughts
The government of India is playing a key role in developing and implementing risk-mitigating measures in the region. Over the past decade, the government has collaborated with the World Bank in a project aimed at reducing the vulnerability of coastal communities to tropical cyclones in India. These risk-mitigation initiatives will inform effective policies that can help reduce the risks and losses caused by tropical cyclones in India.
Such efforts will be particularly important as India's insurance market continues to mature. The liberalization of the market has paved the way for India to fully realize the growth potential of its non-life insurance sector. In the meantime, AIR's Tropical Cyclone Model for India provides insurers, reinsurers and intermediaries with the ability to perform the detailed catastrophe risk assessments that are an essential component of an effective growth strategy for the India market.
2 SwissRe
