


Preparing for Europe's Winter Storm Season with a Look Back at Niklas and Kyrill
Nov 23, 2015
Editor's Note: The 2014/2015 European extratropical cyclone (winter storm) season was rather lackluster until Niklas came on the scene at the tail end of March 2015. At the time, it drew many comparisons with 2007's Kyrill, which had a similar track and an extensive footprint. This article takes a look back at Niklas and puts it in the context of historical storms, including Kyrill, and a yet-to-be-experienced “perfect storm.” Finally, this article takes a look ahead at the 2015/2016 season and discusses some risk management best practices.
At the end of March 2015, extratropical cyclone (ETC) Niklas (also called Lentestorm in the Netherlands) provided a strong reminder that significant storms can occur very late in the winter storm season, which typically lasts from October to March, peaking in January. Until the very end of March, the 2014/2015 European extratropical cyclone (winter storm) season had been relatively quiet. The only other notable events were Elon, Felix, and Hermann, a cluster of relatively weak storms that together caused estimated industry losses of EUR 328 million in January.1
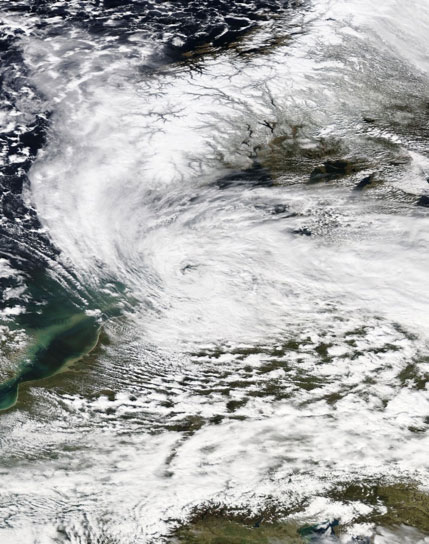
On March 29, 2015, Niklas formed as a low pressure system and then strengthened the next day as it moved southeast over Europe. On March 31, Niklas developed into a strong storm centered over Denmark and the southern Baltic Sea, bringing high winds and heavy precipitation to Germany and parts of the UK. By the evening of March 31, Niklas' cold front arrived in the alpine region of Germany, causing widespread intense precipitation and strong squalls. Recorded wind gusts for Niklas across Germany ranged from 119 km/h in various coastal areas and at the mountain station on Wasserkuppe; 151 km/h on Feldberg in the Black Forest; and up to the maximum reported wind speed of 192 km/h on Zugspitze, Germany's highest mountain.
 Dr. Bernhard Reinhardt
Client Services Associate
Edited by Sara Gambrill
The article:
- ETC Niklas caused about EUR 1 billion in insured losses this year, a two- to three-year return period loss, according to AIR's EP curve for industry losses from ETC occurrence.
- The AIR Extratropical Cyclone Model for Europe demonstrates that if all three ingredients for a “perfect storm”—intensity, size, and location—are met simultaneously, losses from a single ETC can easily exceed EUR 20 billion.
- The number of ETCs every season and the losses they incur vary widely. Probabilistic modeling enables companies to not only evaluate and prepare for historical events if they were to recur today but also take into account plausible events that have not yet been observed.
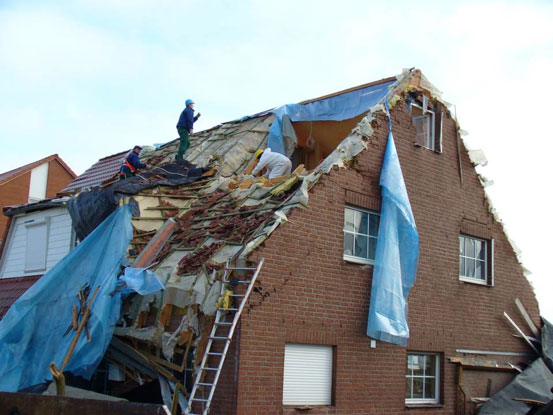
Niklas continued to move eastward, causing intermittent squalls, heavy precipitation, and thunderstorms, as well as snowstorms in locations less than 500 meters above sea level. The storms felled trees, which damaged vehicles and buildings (including roofs and façades), and disrupted heavy rail and air travel for Passover and Easter. Nine fatalities can be attributed to Niklas, and insured losses totaled roughly EUR 1 billion.
Niklas Was Big, But It Was No Kyrill
At the time Niklas was moving over Europe, many industry observers compared its punch to that of Kyrill in January 2007. Although the average wind speeds for Niklas were lower than for Kyrill, the extent of the damaging winds was comparable, making Niklas one of the larger storms to have impacted Europe.
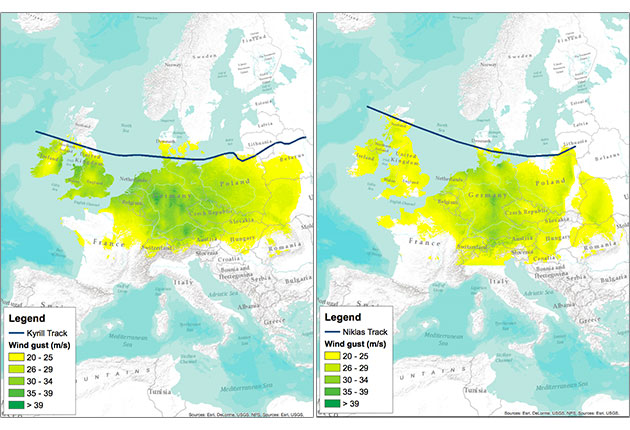
In addition, Niklas and Kyrill took a remarkably similar track over Europe, and their footprints were also quite similar. The wind fields of both storms showed a high degree of small-scale variability and a high ratio of maximum gust speed to average wind speed. The strongest gusts were associated with cold fronts in which thunderstorms were embedded. In the case of Kyrill, the strong convection connected to the thunderstorms caused localized downward transport of momentum as well as strong precipitation.2 For parts of northeastern Germany, the rainfall from Kyrill exceeded the average accumulated precipitation for the entire month of January.3
Insurance Impact—Historical Experience and Beyond
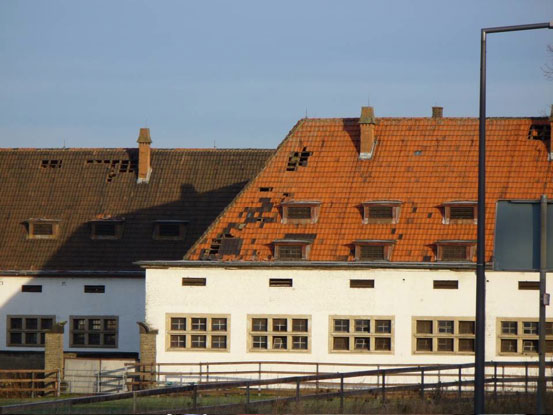
The average claim for ETC events is relatively small compared to other perils—on the order of EUR 1,000. However, depending on the size of the footprint and the corresponding number of claims, total event losses can reach several billion euros. Kyrill, for example, affected more than 10% of the building stock in Germany.4 Because deductibles for wind throughout Europe range from nonexistent to low, even a few blown-off shingles can warrant a claim. Good insurance penetration in Europe also contributes to the relatively high insured losses. Except for a few countries, such as Poland, Czech Republic, and Lithuania, wind insurance take-up in Europe is virtually 100%.
As it turned out, Niklas caused only one fifth the insured losses of Kyrill. With its nearly EUR 5 billion in insured losses, if it were to recur today, Kyrill stands as the sixth costliest European storm in the history of well documented European ETC losses and has a return period of about seven years on AIR's exceedance probability (EP) curve for industry losses from ETC occurrence. Niklas, on the other hand, does not make it into the top 10 and has a return period of about two to three years. (See Table 1.)
| Storm | Year | Insured Loss (EUR Bn) | |
|---|---|---|---|
| 1 | Daria | 1990 | 12.4 |
| 2 | Lothar | 1999 | 10.0 |
| 3 | 1987J | 1987 | 7.5 |
| 4 | Capella | 1976 | 5.1 |
| 5 | Vivian | 1990 | 4.8 |
| 6 | Kyrill | 2007 | 4.8 |
| 7 | Anatol | 1999 | 3.6 |
| 8 | Martin | 1999 | 2.8 |
| 9 | Wiebke | 1990 | 2.7 |
| 10 | Herta | 1990 | 2.4 |
While both Kyrill and Niklas met two of the three criteria—size and location—for an extreme European loss event, what they lacked was extreme intensity. In fact, the 144 km/h maximum gusts of Kyrill in the lowlands are rather tame in comparison to many past historical storms, including a gust of 180 km/h recorded in Paris from Lothar in 1999.
According to the AIR Extratropical Cyclone Model for Europe, there is a 1% probability every year that a much more devastating ETC will hit Europe—one causing EUR 18 billion or more in insured losses. And AIR's European ETC model demonstrates that if all three ingredients for a “perfect storm”—intensity, size, and location—are met simultaneously, losses from a single storm can even exceed EUR 24 billion at approximately the 0.4% probability level. Comparing these losses to those in Table 1, it becomes apparent that it is essential for prudent risk managers to not only evaluate historical events but also take into account plausible events that have not yet been observed.
Preparing for the Upcoming Season
On average, five ETCs impact Europe each year that cause significant damage. For the 2015/2016 season, the strengthening El Niño may yield colder than normal conditions during the mid-to-late winter months over northern Europe. But how that may influence the average number and characteristics of damaging windstorms across the continent just isn't known—especially for very strong El Niño events like this winter's is turning out to be. For example, this event is expected to be comparable in strength to those that occurred in 1982-83 and 1997-98. But neither of those winters saw even one significant damaging European ETC.5 There is, in fact, a greater likelihood (as observed in the recent past at least) for damaging European ETCs to occur during moderate El Niño events as in 2004-2005 when Erwin caused USD 1.9 billion and in 2009-2010 when Xynthia caused USD 2.8 billion in insured losses. 6
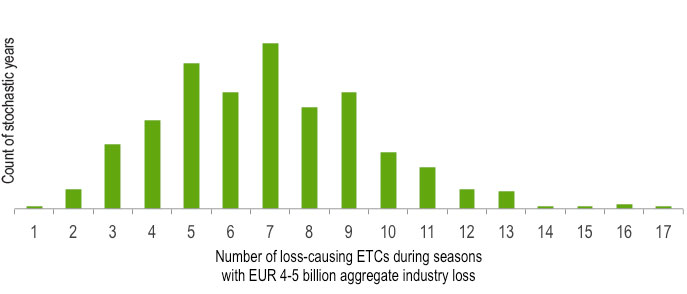
Due to the high frequency of damaging ETC events, it is important to examine potential losses not only for individual storms, or occurrences, but also aggregate loss from ETCs for each modeled year. For example, there are many stochastic years in AIR's European ETC model for which total insured losses equal the losses incurred by Kyrill, even when individual storms do not cause notable losses. In fact, the probability of reaching Kyrill's EUR 4.8 billion loss through the aggregation of several ETC events is approximately twice that of a similar single storm, or a 3.5-year aggregate return period. When evaluating years with aggregate industry losses between EUR 4 and 5 billion in AIR's European ETC model's stochastic catalog, it becomes apparent that such aggregate loss levels often occur in active seasons with more than the average 5.3 loss-causing events per season.
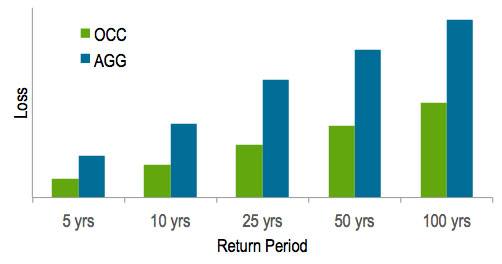
The comparison of the AIR occurrence and aggregate loss exceedance probability curves for Europe in Figure 6 reveals that it is five times more likely to reach the loss level of a single 50-year occurrence event through yearly loss aggregates than for such a single big storm to occur. It is also important to note that ETCs are known to cluster both temporally and spatially, arriving in quick succession and often impacting the same region. Clustering, which is explicitly captured in the AIR model, can contribute significantly to aggregate losses.
The Next Generation of AIR's ETC Model
As the need for ever more granular risk assessment and risk management grows, catastrophe models must advance to keep up with today's tasks. AIR Worldwide is currently developing its updated and expanded European ETC model, taking into account the latest research and data. The updated model will feature an extended catalog of 100,000 simulated years to improve location-level risk assessment, and the model domain will be expanded to include Hungary, Slovakia, and Slovenia. Furthermore, AIR will make more historical events, as well as Extreme Disaster Scenarios (EDS) available in the software. EDS are physically plausible but highly unlikely events that can be used to stress test an insurer's book. AIR is also currently developing a severe thunderstorm model for Europe to complement AIR's existing suite of models for Europe.
1 PERILS AG
2 A.H. Fink, et al., The European storm Kyrill in January 2007: synoptic evolution, meteorological impacts and some considerations with respect to climate change, Nat. Hazards Earth Syst. Sci., 9, 405–423, 2009
3 Ibid
4 GDV Naturgefahrenreport 2012
5http://www.europeanwindstorms.org/expl Extreme Windstorms Catalogue
6 Swiss Re
