


Atmospheric Perils Megadisaster Year in Canada—Are You Prepared?
Oct 27, 2015
Events: A year of catastrophic events in Canada from three atmospheric perils—severe thunderstorms, winter storms, and tropical cyclones
Models: AIR Severe Thunderstorm Model for Canada, AIR Winter Storm Model for Canada, and AIR Tropical Cyclone Model for Canada
Stochastic Year ID: 1551
Affected area: Portions of the 10 provinces of Canada
Estimated insured loss: CAD 6.4 billion
Annual insured loss exceedance probability: Approximately 1% (100-year return period)
Event Overview
Severe thunderstorms, winter storms, and tropical cyclones pose serious risk to exposures in Canada, and all three of these atmospheric perils have resulted in significant insured losses in recent decades. With steady population growth, the emergence of a number of high-density regions (such as the Edmonton area in Alberta), ongoing development, and increasing concentrations of exposure value in at-risk regions, the potential risk of loss from these perils is growing—notably the potential losses from multiple smaller events across the perils.
In this Megadisaster feature, we look at a year with a total insured loss from severe thunderstorms, winter storms, and tropical cyclones impacting Canada—84 events in all—of CAD 6.4 billion, a sum that falls at an exceedance probability (EP) near 1% (100-year return period).1 Insured losses from severe thunderstorms dominate the modeled year—reflecting historical storm experience in Canada—although both winter storms and tropical cyclones contribute losses that could have noteworthy impact to regional portfolios.
This modeled year encompasses:
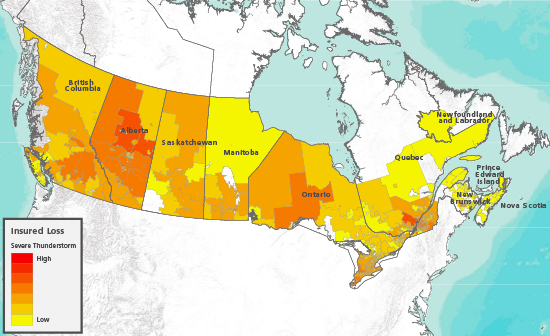
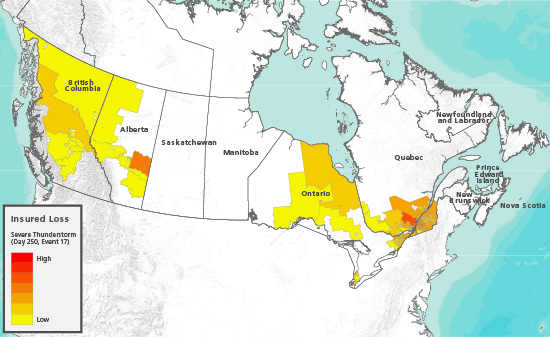
- Seventy-four severe thunderstorm events (hail, straight-line wind, and/or tornadoes), impacting all provinces except Prince Edward Island, with insured losses in Canada totaling CAD 5.9 billion. (See Figure 1.2) The costliest event affected British Columbia, Alberta, Ontario, and Quebec (as well as property in the United States as far south as Kentucky), resulting in CAD 4.3 billion in losses to properties in Canada.

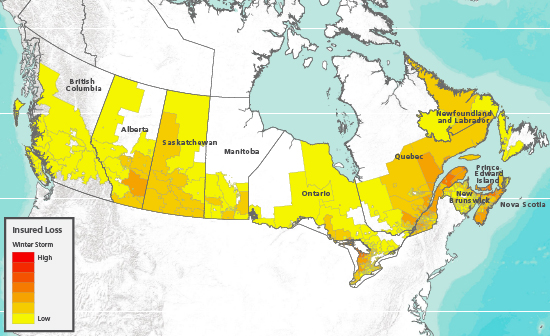
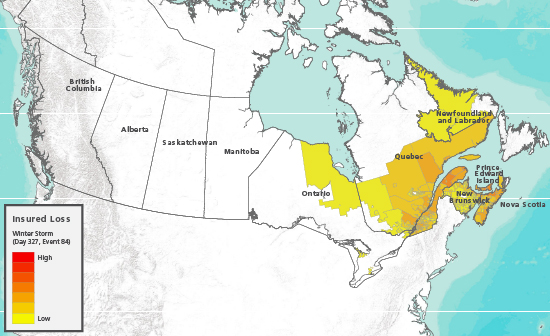
- Seven winter storms (wind, frozen precipitation, and/or freezing temperature), affecting all 10 provinces, with insured losses of CAD 217 million. (See Figure 2.) The largest winter storm impacted the more densely populated eastern portion of the country, from Ontario to Atlantic Canada (New Brunswick, Prince Edward Island, Nova Scotia, and Newfoundland and Labrador) and caused CAD 164 million in insured losses.
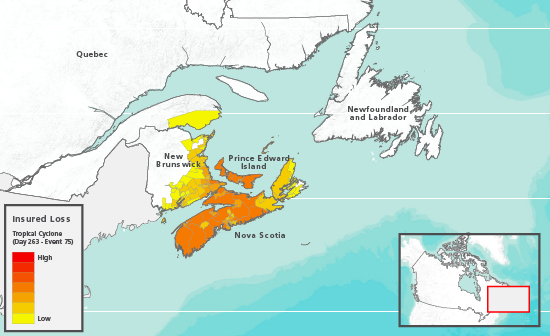
- Three tropical cyclones (high wind), with insured losses totaling CAD 213 million in Quebec and Atlantic Canada. (See Figure 3.) The storm causing the highest level of insured losses, CAD 179 million, moved across Nova Scotia, New Brunswick, and Prince Edward Island and then entered Quebec.
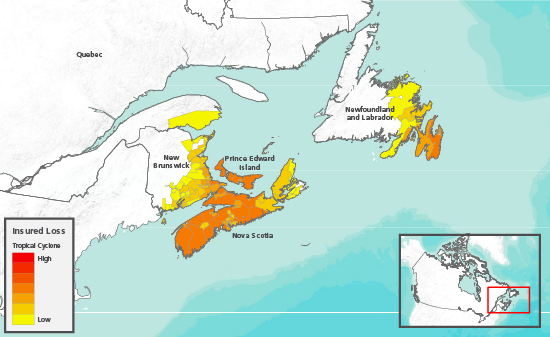
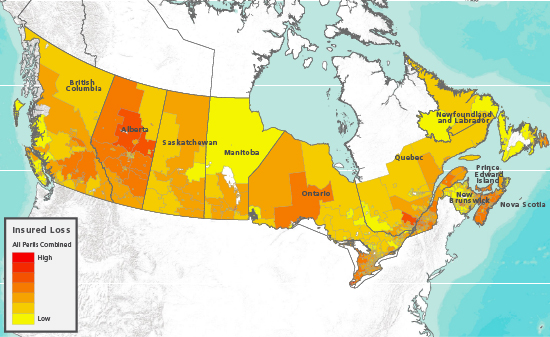
Figure 4 shows the loss severity of the three perils combined. Note that significant losses occurred in the west-central and central regions of the country, areas historically at high risk of severe thunderstorms.
Canada Atmospheric Perils Setting and History
In any given year, Canada can be impacted by numerous natural disasters caused by atmospheric perils and their sub-perils. Although sizable catastrophic events do occur—such as the Great North American Ice Storm of 1998, which caused insured losses in Canada of approximately CAD 3 billion—many smaller events, of various sizes, intensities, and duration, can have a substantial impact on insured losses when aggregated.3, 4 Due to the vast size of the country and its varied topography and geology, risk of severe thunderstorms, winter storms, and tropical cyclones varies by region, as well as by season.
Severe thunderstorms occur ubiquitously across Canada—unlike winter storms and tropical cyclones—taking place in more months of the year than the other atmospheric perils (despite the extended Canadian winter) and impacting nearly all of the southern provinces most years. Accordingly, insured losses from severe thunderstorms in Canada can be a much greater percentage of total losses in a given year. Nevertheless, the impact of winter storms and tropical cyclones on portfolios can be noteworthy, depending on the regional distribution of exposures.
Of the top 20 insured loss atmospheric peril events to impact Canada, 15 were severe thunderstorms, three were winter storms, and two were tropical cyclones. The 1998 ice storm was by far the costliest event.
Severe Thunderstorm
Severe thunderstorm can impact a broad geographical area, with a single event affecting regions in both Canada and the United States (complicating loss projections for policies and portfolios spanning both countries). All sub-perils from this meteorologically complex peril can result in significant damage:
- Hail, over time, has caused the most insured loss, although hail events occur with significant variability from region to region and year to year. “Hailstorm Alley,” which runs through south-central Alberta, roughly from Calgary through Red Deer to Edmonton, is one of the most volatile hail zones in North America.
- Straight-line wind has the highest annual occurrence rate among the three modeled sub-perils and can result in more damage than hail and tornadoes for certain events.
- Canada is second to the United States in tornadic activity worldwide, with 80 to 100 tornadoes annually, most of which are 0 to 2 on the Enhanced Fujita scale.5 Alberta, Manitoba, and Ontario experience the most tornadoes, approximately 15 each in a year; Quebec on average experiences fewer than 10 annually.
Significant recent severe thunderstorms in Canada include an August 2005 windstorm/rainstorm in Ontario with insured losses totaling CAD 856 million and a July 2010 hailstorm/thunderstorm, with baseball-size hailstones, high wind, and heavy rain, that caused CAD 614 million in insured losses in Calgary and southern Alberta (Canada's costliest hailstorm).6
Winter Storm
The main source of extreme weather in the winter months in Canada, winter storms—also known as extratropical cyclones (ETCs)—can have a damaging impact throughout the country. A given event can include various combinations of sub-perils: wind, frozen precipitation (snow, ice pellets, freezing rain), and freezing temperature. The weight of ice that has accumulated on trees and power lines from freezing rain can result in property damage as well as power outages, which can trigger business interruption and additional living expenses, additional content losses due to freezer-food spoilage losses, and burst pipes from heating system interruption.
During winter storms, wind generally causes damage to the roof, envelope, and cladding; snow accumulation causes nonstructural damage, roof collapse, and water damage (ice dams); and freezing temperatures cause pipes to burst. All sub-perils are related to content and time element losses.
Winter storms lack the high winds of tropical cyclones, but they can impact a much greater area—tens of thousands of square miles.
The most noteworthy winter storm in Canada, the CAD 3 billion Great North American Ice Storm of 1998, was remarkable both for duration and ice accumulation. A six-day series of five ice storms, the cluster swept through Ontario and Quebec—with Ottawa and Montreal severely impacted—then moved east to New Brunswick and Nova Scotia (as well as New York State and northern New England).
Tropical Cyclone
Although not a loss producer in Canada every year, tropical cyclones do present an annual risk. The most common tropical cyclones affecting Canada are storms that track over water and directly strike Canada from the Atlantic Ocean and storms that track into Canada—as far west as eastern Manitoba—after making U.S. landfall and transitioning into extratropical storms.
Tropical cyclones reaching Canada from the ocean generally weaken as they move north (due to cooler water and greater wind shear). For storms arriving over land, the extratropical transition can lead to an expanded radius of maximum winds as well as faster forward speeds, which result in shorter event durations.
The impact of tropical cyclones on Canada can be extensive. Hurricane Juan, for example, a Category 2 storm at landfall, delivered a CAD 216 million blow to Nova Scotia and Prince Edward Island in September 2003, with hundreds of thousands of homes damaged, storm surge up to 2 meters in Halifax Harbor (with notable erosion along the harbor shore), and eight deaths.7
Affected Exposure
Vulnerability to severe thunderstorm, winter storm, and tropical cyclone in Canada varies region to region due to varying climates, weather conditions, and building codes and standards, as well as by differences in building construction by occupancy, as shown in Figure 5.
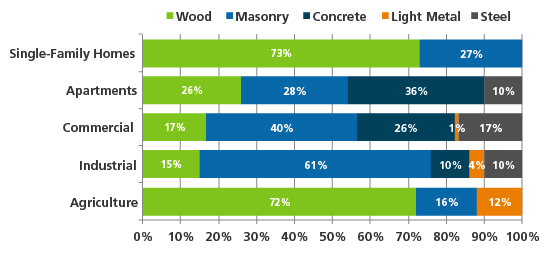
Construction type—a primary feature—affects a building's vulnerability to wind. Masonry buildings perform well when exposed to wind-borne debris, especially in comparison with wood-frame buildings. However, reinforced concrete structures generally perform better than masonry structures when exposed to heavy wind loads. Reinforced concrete also performs better than steel when used for commercial structures, while light metal is the least wind-resistant of any of these materials. For residential buildings, manufactured homes are the most vulnerable, with total damage occurring sooner than for other classes.
Apartments and condominiums frequently receive engineering attention similar to that given to commercial construction. From a structural viewpoint, therefore, the construction of commercial property and apartments/condominiums is similar. Nevertheless, apartments and condominiums can have some building components that make them more susceptible to windstorms than commercial construction, such as balconies, awnings, and double sliding-glass doors.
Roofs that are flat or have a low-grade slope are particularly vulnerable to winter precipitation loads since the load cannot easily slide off. Structural damage and even collapse can occur with light metal or long-span structures. Other building elements, such as porches, carports, awnings, and gutters, are also vulnerable to winter precipitation loads, as these building elements do not receive any specific design attention. Masonry buildings perform well when exposed to heavy snow loads, especially in comparison with wood-frame buildings. Light metal structures are the most vulnerable, with total damage occurring sooner than for other classes.
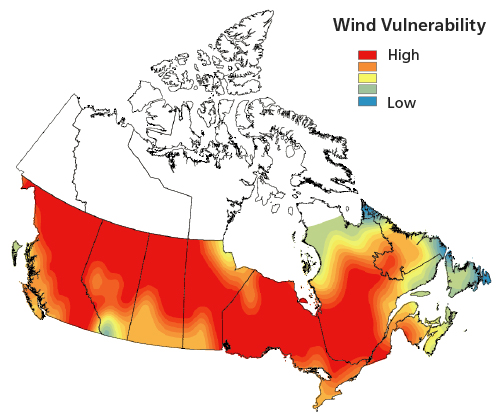
The various sub-perils of severe thunderstorm (hail, straight-line wind, and tornadoes), winter storm (wind, frozen precipitation, and freezing temperature), and tropical cyclone (high wind) inflict damage by different mechanisms, adding a layer of complexity to the impact on exposures. Wind is a risk common to all three atmospheric perils, although for the tropical cyclone peril, wind duration—which is much longer for a slower-moving tropical storm than for a severe thunderstorm or winter storm—becomes salient. Depending on the peril and sub-peril, wind damage might include cladding failure, damage from falling trees, and structural and nonstructural damage. Regional building vulnerability to wind based on building codes, as modeled by AIR, appears in Figure 6.
In addition to physical damage, each sub-peril can also lead to time element losses. The 1998 ice storm, for example, destroyed millions of acres of trees, downed tens of thousands of utility poles, and collapsed nearly one thousand transmission towers. The resulting crippled electrical infrastructure caused power outages that lasted from days to months. Upwards of 20% of the workforce affected were delayed returning to work, and major sectors of the economy—from farming to timber—suffered.
Estimating the Impact
Megadisaster year 1551, with CAD 6.4 billion in estimated insured losses from atmospheric perils, resulted from 84 events, with a wide range of insured losses (see figures 1-4). As shown in Figure 7, losses occurred in every month of the year except March and December. May experienced the greatest losses by far, CAD 4.5 billion—71% of the total for the year—due to a windstorm with CAD 4.3 billion in losses. Losses for May, June, and July totaled CAD 5.5 billion, 86% of the year's losses.
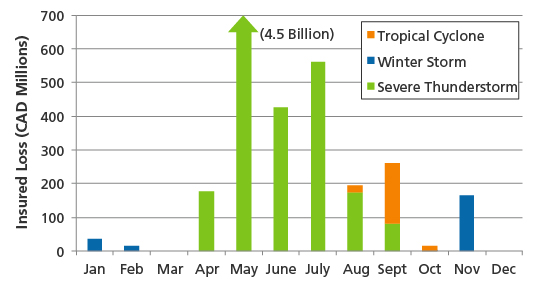
Figure 7 also reveals the season-specific characteristics of the various perils, with winter storms in the fall and winter months (a winter storm with less than CAD 1 million in insured losses occurred in October, also), severe thunderstorms (and related sub-perils) in warmer—perhaps humid—spring and summer months, and tropical cyclones in the late summer and fall months.
The 10 most costly events, shown in Table 1, account for CAD 5.9 billion, or more than 90% of total loses in this simulated 1% EP year.
| Event | Month | Provinces with Insured Losses | Insured Loss (CAD Millions) | |
|---|---|---|---|---|
| 1 | Severe thunderstorm | May | British Columbia, Alberta, Ontario, Quebec | 4,341 |
| 2 | Severe thunderstorm | July | Alberta, Saskatchewan | 433 |
| 3 | Severe thunderstorm | June | Alberta, Manitoba, Ontario | 371 |
| 4 | Tropical storm | September | Nova Scotia, New Brunswick, Prince Edward Island, Quebec | 179 |
| 5 | Winter storm | November | Ontario, Quebec, New Brunswick, Nova Scotia, Prince Edward Island, Newfoundland and Labrador | 164 |
| 6 | Severe thunderstorm | August | Alberta | 113 |
| 7 | Severe thunderstorm | April | Ontario | 90 |
| 8 | Severe thunderstorm | April | British Columbia, Ontario | 84 |
| 9 | Severe thunderstorm | May | Alberta | 82 |
| 10 | Severe thunderstorm | July | British Columba, Ontario | 74 |
The most devastating severe thunderstorm, a late-May CAD 4.3 billion event, resulted in losses in British Columbia, Alberta, Ontario, and Quebec, as shown in Figure 8. This event occurred just 12 days after a CAD 82 million storm struck Alberta, and 18 days before CAD 371 million in damage resulted from a storm in Alberta, Manitoba, and Ontario, underscoring the real risk of atmospheric peril event clustering in Canada.
The costliest winter storm, a CAD 163.7 million storm in late November, brought wind gusts in excess of 100 km/h in coastal regions and snowfall of almost a meter in major metropolitan areas, spreading losses across six provinces, from Ontario to Prince Edward Island. (See Figure 9.)
The costliest tropical cyclone in simulated year 1551 hit Atlantic Canada in the third week of September and then moved inland, leaving CAD 178.8 million in losses in Nova Scotia, New Brunswick, Prince Edward Island, and Newfoundland and Labrador, as well as Quebec. (See Figure 10.)
Are You Prepared?
The various events in this megadisaster loss scenario exemplify the extensive and widespread damage that can result from atmospheric perils—and sub-perils—in Canada. Other scenarios could produce equally comprehensive damage with similar levels of loss. Importantly, the scenario year detailed in this article is not an extreme tail event. The industry insured loss for the three atmospheric perils—severe thunderstorm, winter storm, and tropical storm—has a modeled annual exceedance probability (EP) of about 1.0% (which equates to a 100-year return period); far greater losses are possible.
Responsible risk management includes acquiring a comprehensive and realistic view of risk, as well as preparing for a wide range of loss scenarios. Using model scenarios—such as this multi-peril 1% EP year—to probe your portfolio's strengths and weaknesses will help you respond effectively when disaster does strike. Being attentive to best practices can help ensure that you achieve the most realistic loss estimates:
- Strive to obtain highly accurate exposure data. Atmospheric perils cause widely variable events that can have different impacts in different regions. Collecting detailed information for the properties in your portfolio—including location, primary building characteristics (such as construction type, occupancy, building age, and height), and a true replacement value—will help refine the loss results and help you get closer to the true vulnerability of the individual buildings.
- Use visual intelligence to understand your data. Geospatial analytics can provide rich and intuitive information on risk accumulations and how they relate to potential hazards, for more informed risk management.
- Anticipate business interruption losses. Use catastrophe models to calculate business interruption after natural disasters—a potential source of significant loss—as a function of downtime, damage, building size, and architectural complexity.
- Be aware of nonmodeled sources of potential loss. Not explicitly modeled in this scenario, for example, are damage attributable to inland flooding and coastal storm surge, extra cleanup costs, and loss-adjustment expenses.
AIR's unique catalog structure allows users to simultaneously analyze multiple models across different perils, as we have done here, as well as across different regions. Looking ahead, AIR is developing models that can capture global correlations across atmospheric perils for an even more comprehensive view of the risk.
Closing Comments
Development is steadily increasing in many risk-prone areas of Canada, while the number of high-intensity events is also growing. Knowing the risk of severe thunderstorm, winter storm, and tropical cyclone—and the risk of their many sub-perils—can help insurers, brokers, and reinsurers gain a comprehensive view of risk based on specific portfolios, coast to coast. With AIR's updated and new atmospheric models for Canada, risk managers can take a multi-model approach to evaluate—and prepare for—a range of contingencies. (See the box, “AIR Introduces Updated and New Atmospheric Perils Models for Canada.”)
Catastrophe models are not intended to predict the next megadisaster, or when a megadisaster might occur. Catastrophe models do, however, simulate the behavior of physical phenomena and how those phenomena impact the built environment to determine the impact of different perils at various intensities. By carefully analyzing model results, risk managers can prepare for even megadisasters, such as the multi-peril scenario presented here, and gain a global perspective on their overall risk.
Endnotes
1 The events considered in this modeled year do not include those dominated by flood damage.
2 Loss gradients shown for figures 1-4 and 8-10 are based on “forward sortation areas,” geographical regions determined by Canadian postal codes. All these figures use an exponential gradient scale.
3 The Great North American Ice Storm of 1998 was Canada's largest weather-related catastrophe in modern history.
4 Loss figure adjusted to 2013, considering real GDP per capita growth, inflation, and population growth. Note that the loss figure resulted from a pure trending of the 1998 number based on GDP and independent of changes in infrastructure (e.g., strengthening the local power distribution system).
5 The United States records 1,000 to 1,200 tornadoes each year.
6 Loss figures adjusted to 2013 considering real GDP per capita growth, inflation, and population growth.
7 Loss figures adjusted to 2013 considering real GDP per capita growth, inflation, and population growth.
