


New AIR Solutions to Help You Own Your Crop Portfolio Risk
Oct 24, 2013
Editor's Note: AIR recently updated the AIR Multiple Peril Crop Insurance (MPCI) Model for the United States and will update the China MPCI model in Summer 2014, at which time a new Crop Hail model for the U.S will also be released. In this article, we discuss what these new and updated crop solutions offer to risk managers.
The U.S. MPCI Model: A Superior Tool for Managing Crop Portfolio Risk
Despite the uncertainty about this year's corn and soybean yields—especially during the federal government shutdown—and the dramatic price fluctuations in the commodity futures markets, crop insurers, reinsurers, and brokers must prepare now for reinsurance negotiations that will take place during crop renewal season, which begins on January 1.
To support more informed decision-making, the latest release of the U.S. MPCI model includes three catalogs, or event sets, that correspond to different levels of price volatility (or the varying uncertainty in harvest price compared to planting price).
The three catalogs enable clients to test the sensitivity of their crop portfolio risk to different price volatility scenarios for the upcoming renewal season. In addition, by allowing users to input government-mandated premium rate changes on the fly, AIR no longer needs to develop a complete update to the model, which can disrupt the contract renewal cycle.
A Look Inside the Three Stochastic Catalogs
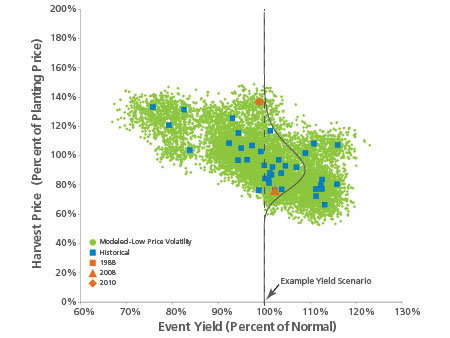
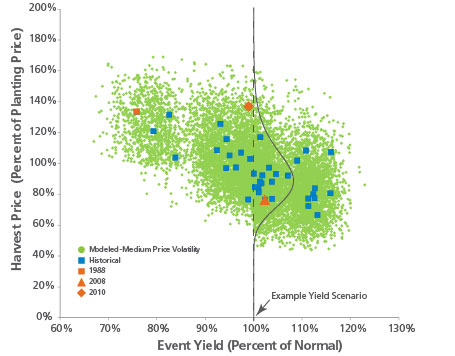
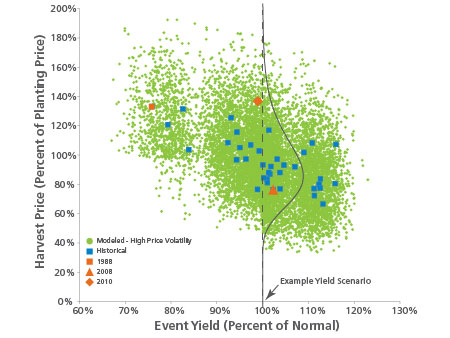
The foundation of AIR's price model is the historical relationship between planting and harvest prices from 1974 to 2012 on the national level and the corresponding national yield. The three catalogs—representing low, medium, and high price volatility—share the same yield scenarios so that users can isolate the impact of price volatility. The price volatilities used in the stochastic catalogs are set such that they never drop below actual historical volatilities. Note that the low price volatility catalog exhibits price volatilities closest to the historically observed values for all crops.
The price ratio for corn (that is, the harvest price as a percentage of planting price) and corresponding event yields in each of the three catalogs are depicted by the green dots in Figure 1, Figure 2, and Figure 3. The blue squares show the available historical data for corn, and the red triangles and diamonds indicate actual harvest price versus event yield for the years 2008 and 2010, respectively. These two years were selected because they exhibited high market volatility (0.28 for corn in both 2008 and 2010) but near-normal nationwide yields.
 By: Dr. Gerhard Zuba
Senior Principal Scientist
 By: Dr. Oscar Vergara
Manager, Business Development
 By: Heidi Wang, FCAS
Senior Manager, Business Development
Edited by Sara Gambrill
The article: Discusses how crop insurers and reinsurers can own their crop portfolio risk using AIR's new and updated crop models.
Highlights: Describes the advantages of the updated U.S. MPCI model's three catalogs that support different levels of price volatility, how the new U.S. Crop Hail model will allow users to simultaneously estimate damage from hailstorms to their property and crop portfolios, and how AIR explicitly models the fire peril for forestland in the upcoming update to the AIR China MPCI model.
The Advantage of Having Three Catalogs for Crop Portfolio Analysis
Market volatility and the corresponding price risk have a significant impact on the crop insurance programi because insurance premium collected is directly proportional to the market volatility at the time. For example, a drop in volatility for corn from 0.22 in 2012 to 0.20 in 2013 caused a decrease of approximately 5% in premium collected for policies with higher coverage level. A much larger volatility decrease and, in turn, much larger premium decrease relative to liabilities was observed between 2009—when volatility for corn was 0.34—and 2012, when volatility for corn was 0.22. In general, the lower the price risk—or market volatility—the lower the premium paid by the farmer.
When considering a specific scenario with a given yield and price change between planting and harvest, the loss as it relates to the liability—loss cost—does not depend on the volatility catalog used. The loss cost represents loss determined by the yield deficit and price increase or decrease. The loss ratio—or loss compared to premium—depends heavily on the premium rate, which is lower during a low volatility crop year than it is during a high volatility crop year, as previously mentioned.
Crop insurers, reinsurers, and brokers can better own the risk for their crop portfolios with the recently updated U.S. MPCI model because the three stochastic catalogs account for the variation in premiums—closely tied to liability—as the price volatility environment changes.
Looking Ahead: A New U.S. Crop Hail Model in 2014
Unlike U.S. MPCI coverage, insurance coverage for crop loss caused by hail is offered by private insurance companies without any government subsidies. These crop hail policies are offered either as standalone policies or in conjunction with MPCI policies (production hail). Crop hail premiums have grown steadily and now represent roughly a tenth of the U.S. MPCI program.
Crop hail insurers experienced their largest losses in the history of the program in 2011, with a countrywide loss ratio of 1.14 for all crop hail policies and a loss ratio of over 2 for the production hail program alone. The increasing premium in this line of business as well as the potential for large losses generated market demand for a modeling approach to assess the risk.
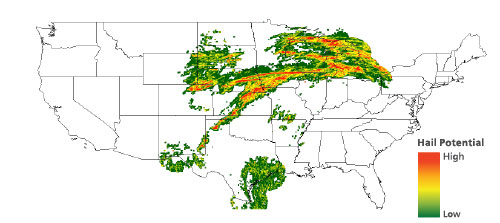
The AIR Crop Hail Model for the United States uses a subset of event parameters related to the hailstorm peril from the 10,000-year stochastic catalog developed for AIR's U.S. severe thunderstorm model. Capturing parameters such as location, length and width of hail swath, and hail intensity, the catalog contains simulated hailstorm events that were created using historical data from NOAA's Storm Prediction Center (SPC).
The U.S. severe thunderstorm model employs statistical data smoothing and augmentation techniques to correct for urban bias in the historical SPC data. (SPC data—the publicly available official data—is biased toward reporting hailstorms in urban areas, meaning that hailstorms in rural areas—where crops are planted—are underreported.) Adding actual event-specific claims data provided by private crop insurers to the historical data provides additional verification. Because the catalog for the U.S. crop hail model correlates with the U.S. severe thunderstorm model, users of AIR's CATRADER® software can easily combine their crop and property portfolios to simultaneously estimate damage caused by hailstorms to both.
Hailstorms can be highly localized and last for just minutes. The impact of hailstorms on crops also varies by both the growth stage at the time of the storm and crop type. The model uses the intersection of each hailstorm footprint from the catalog with the 5 km exposure database grid to determine the damage to specific crops in specific locations. Currently, AIR models wheat, corn, cotton, rice, soy, and barley, using crop data from the National Agriculture Statistics Service (NASS). Total losses from nonmodeled crops are added stochastically. Model results are validated against loss estimates issued by the National Crop Insurance Services and data provided by crop insurers.
With the introduction of the crop hail model in 2014, AIR offers a suite of risk analysis tools for the U.S. crop business that provide a holistic view on the potential risks.
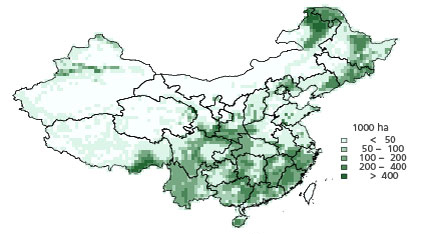
New Forestry Module for the China MPCI Model
The ability to manage and assess the risk to China's forestland has become increasingly important for insurers and reinsurers. Forestland has been increasing in China at the rate of 2% per year since 1984. At the same time, the insurance premium for forestland has been growing steadily. Coverage for commercial and noncommercial forestland is offered in nearly 20 provinces, with fire as the major peril covered.
Although the risk of forestland loss to fire is fairly high, the premium rate has been kept relatively low due to the lack of major events in recent years. But historical data are insufficient to fully represent the risk. Therefore, the AIR Multiple Peril Crop Insurance Model for China—which currently models six major crops and three perils—will, from 2014, include a forestry module, which explicitly models the fire peril for forestland.
AIR generated a stochastic catalog for the new forestry module based on analysis of the historical data on frequency and extent of forest fires, combined with impacted locations from satellite (MODIS) information. These were then correlated with known weather parameters—such as dryness, wetness, and wind—from the existing stochastic catalog for the China crop model. The AIR model complements data from the China Forestry Yearbook with satellite data to create an exposure database at 50 km resolution. The model is validated using damage reports from the Yearbook.
With the new forestry module, the AIR Multiple Peril Crop Insurance Model for China will account for the majority of agriculture exposures throughout China, helping companies operating in these markets to truly own their risk.
i The rerating of policies by RMA for the 2012 and 2013 crop years produced an additional decrease in industry premiums but its effect is separated from the price volatility impact. The US MPCI model has already incorporated the new RMA rerating for the 2014 crop year.
