


Time-Dependent Rupture Probability Forecasting of Large Earthquakes on the Nankai Trough and Faults in Japan
Jan 26, 2021
Editor's Note: AIR plans to release a substantially updated earthquake model for Japan this summer. This article is the first of three in our series on managing Japan earthquake risk. This first article discusses the national hazard model for Japan, recently released by the Headquarters for Earthquake Promotion (HERP) in 2019; provides a detailed discussion on the time-dependent rupture probability forecasting of large earthquakes on the Nankai Trough and faults in Japan; and explains why the updated AIR Earthquake Model for Japan incorporates HERP’s view of seismic risk in some cases and diverges in others. (All magnitudes in this article are expressed in moment magnitude.) The second article will describe how the M9.0 Tohoku earthquake informed our view of hazard from megathrust earthquakes in Japan and how we are updating the vulnerability component of our model, and the third article will describe our updates to modeling tsunami risk.
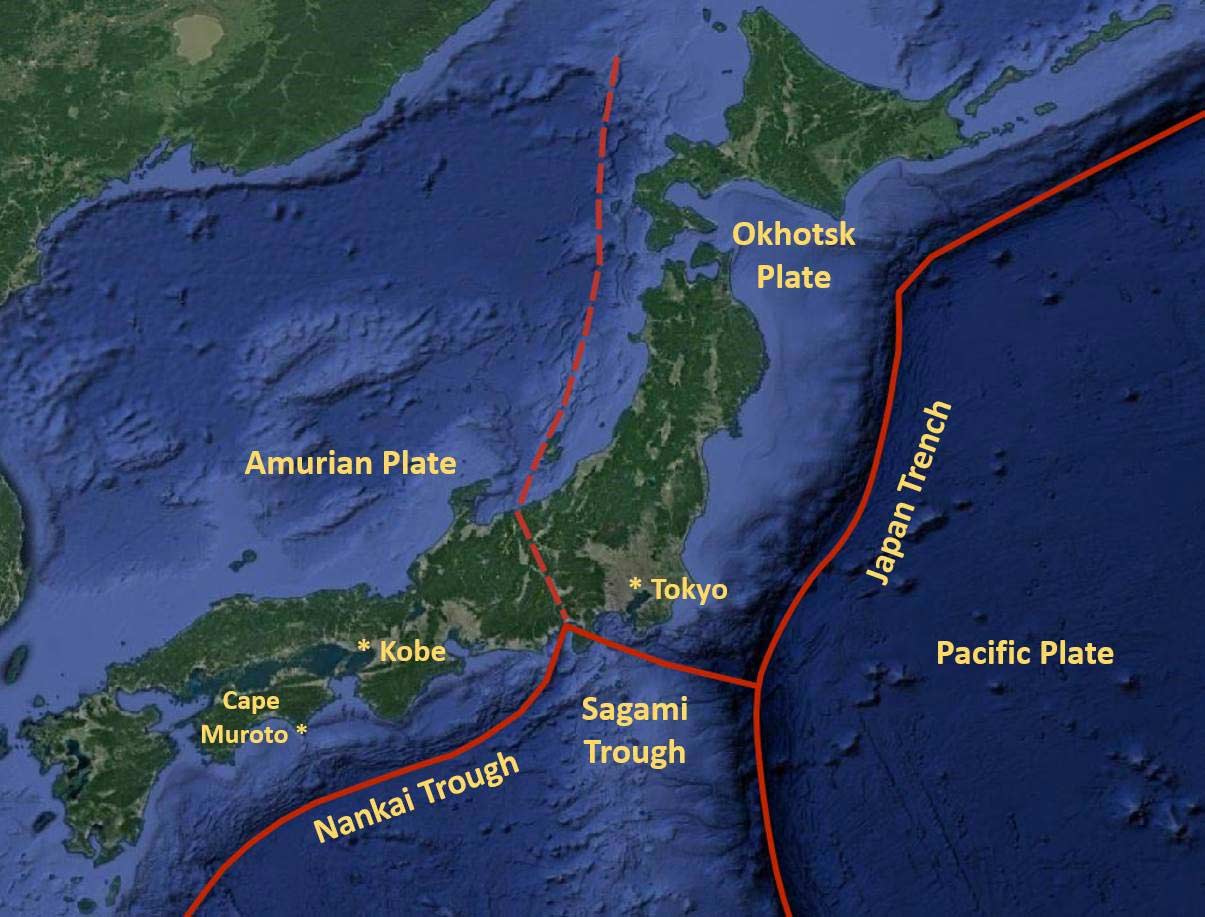
Japan is an active seismotectonic region with two dominant subduction zones, formed by the convergence of the Pacific and Okhotsk plates in the north, and the Philippines and Amurian plates in the south. The Philippines and Okhotsk plates also converge at the Sagami Trough, causing devastating events such as the 1923 M7.9 Kanto earthquake. The story of Japan’s many large damaging earthquakes is written by the slow but faithful convergence of these plates, the gradual straining of the region, then the release of energy by subduction interface and intra-slab, shallow, and deep crustal—and even occasional slow—earthquakes. The M9.0 Tohoku earthquake in 2011 was one of the most recent manifestations of this process; it unlocked part of the Pacific-Okhotsk plates and relieved stress on the Japan Trench. In the south, however, the Nankai Trough has been locked with the Amurian Plate since the M8.0 Tonankai quake in 1944 and the M8.2 Nankai quake in 1946 and currently poses serious earthquake risk to south central Japan.
 Mehrdad Mahdyiar, Ph.D.
Vice President in Earthquake Modeling
Edited by Sara Gambrill, CEEM
The recent national hazard model for Japan, released by the Headquarters for Earthquake Promotion (HERP) in 2019, provides detailed information on the distribution of various subduction zones from the Kuril Trench, north of Hokkaido, the second largest island of Japan, to the Ryukyu Islands, south of Kyushu, the third largest island of Japan; the distribution of about 690 crustal faults; and the randomly distributed background seismicity of this area. The updated AIR Earthquake Model for Japan, anticipated for release this summer, is based on HERP’s most recent seismicity model with some modification to the time-dependent rupture probability (TDRP) estimates for earthquakes on the Nankai Trough and some crustal faults. What follows is a brief overview of how AIR updated our model, in light of the most recent HERP model, then a much more detailed explanation of our updates.
The Updated AIR Earthquake Model for Japan and the HERP 2019 Model: A Brief Overview
Our update of the AIR Earthquake Model for Japan closely follows HERP’s view of regional seismicity regarding crustal faults, background seismicity, and the interface and intra-slab earthquakes on the Kuril Trench, the Japan Trench, and the Nankai Trough, but with modified TDRP values to better reflect uncertainties in the TDRP model and parameters. For several faults and subduction segments where HERP used complex TDRP analysis, AIR directly used HERP’s values to avoid the misrepresentation of concepts. For others, we used Brownian passage-time (BPT), lognormal, and Weibull stochastic distribution with three different time windows to capture TDRP model variability.
Considering the importance of large interface earthquakes on the Nankai Trough to earthquake risk in central and southern Japan, AIR conducted a TDRP analysis especially for the Nankai Trough. Using the available historical data, we formulated a logic tree to represent different possible ways of interpreting historical data for TDRP forecasting. We formulated a likelihood function to account for the impacts of variation in recurrence interval (RI) and aperiodicity values on TDRP results. For the Tokai segment, in contrast to the HERP 2019 model for which no possibility for a single Tokai rupture is contemplated, we allow for this possibility by conducting seismic moment balance for the Philippine Plate in that area.
For crustal faults, AIR reanalyzed HERP’s time-dependent fault model to accommodate a broader view of recurrence interval uncertainties, considering that the majority of these faults have long recurrence intervals (RI) and lack enough data to reliably constrain their RI statistics. For faults with no historical data, we considered an open-ended time-dependent model, following the United States Geological Survey (USGS) formulation of the model. We estimated the time-dependent rupture probability (TDRP) for these faults by taking the dates of the last ruptures as random variables. We also expanded HERP’s crustal model to consider the possibilities of large magnitude multi-fault/segment rupture scenarios of complex large magnitude earthquakes.
The following sections discusses these notable highlights of the AIR model update and TDRP formation in more detail.
The HERP 2019 Model Considers Higher Rupture Probabilities for Large Magnitude Earthquakes in the Nankai Trough, After Tohoku
The HERP 2019 model considers time-dependent rupture probabilities (TDRP) models for all subduction zones and nearly one third of the crustal faults in Japan in terms of 30-year rupture probability estimates (P30) (See Figure 2). After the occurrence of the Tohoku megathrust earthquake, HERP modified their overall view of the possible mode of rupture for the Nankai Trough, considering higher rupture probabilities for large magnitude earthquakes. Perhaps the most important change in HERP’s 2019 Nankai rupture formulation—compared to its 2010 model, which was the basis for AIR’s 2013 Japan earthquake model update—is the removal of the Tokai single-segment rupture scenario—the segment at the northern tip of the Nankai Trough. The Tokai segment did not rupture during the M8.0 Tonankai earthquake in 1944; its last rupture was 90 years prior to that in the M8.6 Ansei earthquake in 1854. Consequently, the HERP 2010 model considered this segment to have a rather high rupture probability. The HERP 2019 model, however, eliminates the single rupture possibility. AIR’s 2021 Japan earthquake model update provides a low probability for a single-segment Tokai rupture scenario, as will be discussed in the “Tokai Segment” section.
Since 684 B.C., there have been about 14 reported rupture episodes on different segments of the Nankai Trough (see Figure 3), with strong evidence of temporal correlation between earthquakes on the Nankai and Tonankai segments. The data suggests a longer recurrence interval for earthquakes before the 14th century than after—about every 200 to 265 years versus every 90 to 140 years. It is hard to infer any physical meaning from this, however, because of the possibility of missing records before the 14th century. Historically, the Nankai Trough has been characterized by four segments, shown in Figure 3, from north to south identified as the Tokai, Tonankai, Nankai, and Hyuganada segments with subsegments that reflect basins and ridges within the Philippine Plate.
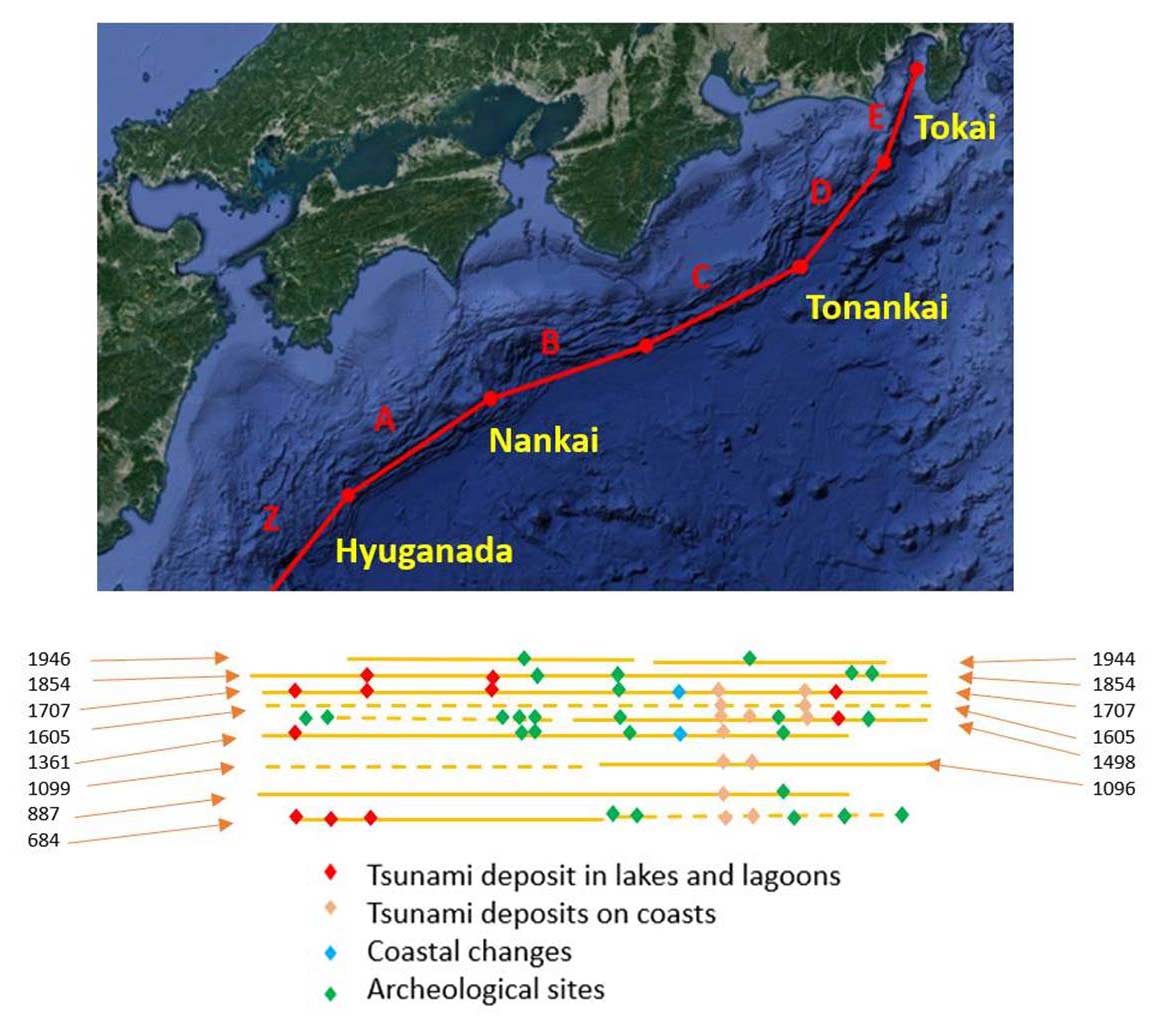
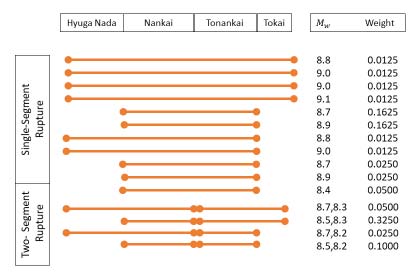
Table 1 shows HERP’s 2019 logic tree formulation of the different rupture scenarios for the Nankai Trough. This model considers several large multi-segment earthquake scenarios with some temporal correlation between the segments. HERP’s TDRP model is based on a time-predictable (TP) model, following a Shimazaki and Nakata 1980 study; it estimates more than 70% TDRP for the next large earthquake on Nankai in the next 30 years.
Uncertainties in the Applicability of the TP Model for Forecasting Recurrence Intervals for the next Nankai-Type Earthquake: Paucity of Data for Cape Muroto
The Shimazaki and Nakata 1980 study calculated the time to the next rupture based on the estimated size of uplifts at Cape Muroto from the M8.7 Hoei in 1707, M8.6 Ansei in 1854, the M8.0 Tonankai quake in 1944 and the M8.2 Nankai quake in 1946. Using this information, they estimated the rate of uplift at Cape Muroto, which was used to forecast the time to the next earthquake using the size of uplift from the 1944 and 1946 earthquakes. However, there are some issues with this model.
The vertical uplift at Cape Muroto reflects the crustal rebound during large Nankai earthquakes, due to the crustal subsidence during the quiescent period, and secular uplift from other geologic processes. Figure 4 shows the observed subsidence rates from leveling data at sites near Cape Muroto. The average subsidence rate for the site used in the Shimazaki and Nakata study is about 5-7 mm/year, which is about half the uplift rate implied from their TP model. The lower subsidence rate compared to the implied uplift rate from the TP model at Cape Muroto creates inconsistency in the forecasting capability of the TP model. Since 1946, Cape Muroto has only subsided about half of the coseismic uplift it experienced during the 1944/46 earthquakes. The 73 years elapsed time since 1946 is more than 80% of the recurrence interval of 88.2 years estimated by the TP model and which is used in the HERP model. This implies that either the process of subsidence/uplift is extremely nonlinear or that other geologic processes are making a major contribution to Cape Muroto’s uplift, which is being attributed to earthquakes along the Nankai Trough.
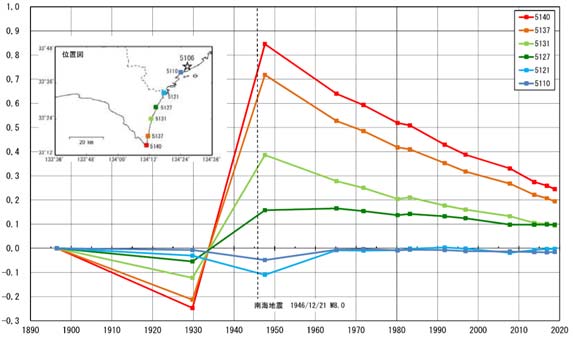
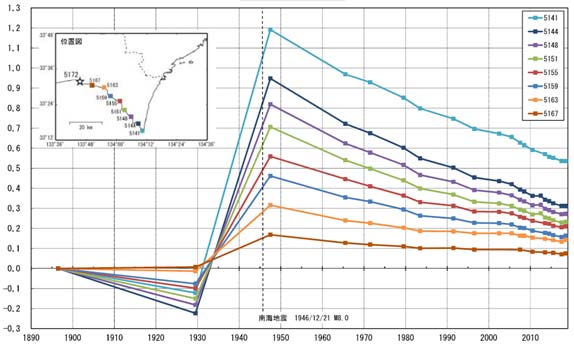
A number of studies on the long-term rate of subsidence/uplift at Cape Muroto suggest that in addition to the impact from earthquakes along the Nankai Trough, the process includes secular vertical elevation changes as well as changes due to the impact from crustal faults. Cape Muroto is characterized by a north-south trending anticline that has been interpreted as being on the hanging wall of a west-dipping reverse fault, the Muroto-Misaki Fault, and is considered to be responsible for some of the observed uplift. The corresponding rate of uplift, however, is estimated to be less than about 1.5 mm/year. It has also been reported that the oblique convergence of the Philippine Plate with the Amurian Plate contributes to the secular uplift at Cape Muroto.
Another issue is that the earthquake-related coseismic uplifts strongly depend upon the slip distributions on the rupture areas of the causative earthquakes. Seno (2012) conducted a study on the causative asperities for the 1707, 1854, 1944, and 1946 earthquakes by comparing seismic intensities, tsunami heights, and crustal movements of these events. His findings indicate that the asperities of the 1707, 1944, and 1946 earthquakes were in the middle part of the Nankai Trough around the Kii Mountains, whereas the asperities of the 1854 earthquake were near the eastern and western parts of the trough. The locations of the largest asperities shape the level and spatial distribution of subsidence and uplift during the inter-earthquake quiescence and occurrences of earthquakes, respectively. All these complexities suggest rather large uncertainties in the applicability of the TP model for forecasting recurrence intervals for the next Nankai-type earthquake using leveling data from Cape Muroto, especially when the model is based on only a few data points. There is also another twist in formulating the occurrences of large earthquakes on Nankai trough.
Time-Dependent Rupture Probability (TDRP) for the Nankai Trough
Japanese seismologists have been studying ancient past earthquakes through reports written at the time of ground shakings at major cities with long histories, such as Kyoto, Osaka, and Nara, and historical reports of tsunamis at different lakes and lagoons as well as coastal uplift/subsidence to determine the possible sizes and rupture extents of past earthquakes. Satake 2015 reported a lack of evidence on ground shaking damage from the 1605 Keicho earthquake, which implies that the 1605 event might have been a tsunamogenic earthquake that only ruptured the shallow trench rather than the entire width of the Nankai Trough. This is an important observation for estimating the time-dependent rupture probability for Nankai. A tsunamogenic rather than a seismogenic 1605 earthquake implies both a longer and more uncertain rupture interval for large earthquakes on the Nankai Trough.
The occurrence of large earthquakes on subduction zones and crustal faults is inherently time-dependent, considering the complex dynamics of regional/local strain accumulation and release. Most TDRP analyses use stochastic models, such as lognormal, Brownian passage-time (BPT), or Weibull distribution, to formulate the variation of the recurrence intervals (RIs) of earthquakes. The results of TDRP analyses strongly depend on the mean and aperiodicity values, equivalent to the coefficient of variation, of the assumed recurrence model. In general, there are uncertainties in these parameters due to the scarcity of historical data on large earthquakes to formulate reliable statistics on RIs. Because TDRP analysis is a nonlinear process, the 30-year rupture probability (P30) estimates with and without accounting for model and parametric uncertainties are not the same.
AIR 2008 Study Leads to Stochastically Observed Rupture Intervals
In 2008, AIR conducted a study to evaluate these issues for earthquakes along the Nankai Trough, Mahdyiar et al. 2008. The study posed the following question: Given the Nankai Trough’s rupture history since 1361, what combinations of recurrence intervals (RIs) and aperiodicity values could have stochastically created the observed rupture intervals? The HERP 2010 model assumed a single recurrence interval of 88.2 years with a rather small aperiodicity value of 0.22 to represent the statistics of RIs of earthquakes along the Nankai Trough. The results of our study clearly demonstrated that the observed historical rupture intervals could be simulated by stochastic processes with different sets of mean recurrence and aperiodicity values—very different values from what were assumed by the HERP 2010 time-dependent (TD) model. While most TDRP studies use a single mean recurrence and aperiodicity values—often estimated using maximum likelihood analysis—the results of our study led us to a TDRP formulation based on a likelihood function for the mean recurrence and aperiodicity values rather than a single set of values that are typically estimated based on a limited historical data set.
Consider a fault with n rupture intervals (T1,T2,… .,Tn) from historical and/or paleoseismic data. Let’s assume that the causative process can be modeled by a lognormal probability distribution, with the mean recurrence interval of and aperiodicity α. The likelihood function for this data set can be written as
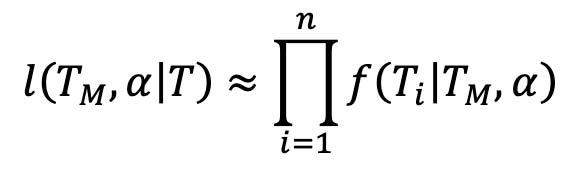
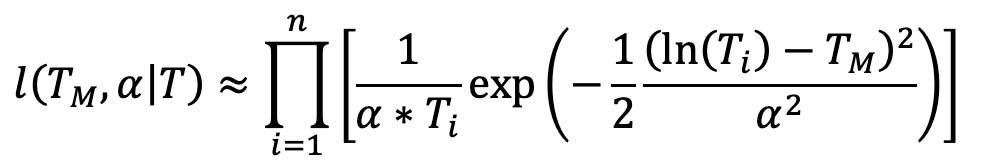
where f (Ti│TM, α) is the likelihood of observing the recurrence interval Ti, given TM and α. For a lognormal distribution, the likelihood function (LF) can be written as
It is common practice to use the maximum likelihood method to estimate the most likely values for TM and α. Considering the scarcity of data on the rupture history of faults and the strong nonlinear nature of time-dependent analysis, however, using the most likely estimates of TM and α, rather than their distributions, can result in biased TDRP estimates. So, rather than using a single TM, we used the likelihood function to formulate distributions for plausible TM for assumed values of α. For any sample of α from an assumed distribution, the likelihood function gives a density distribution for the mean recurrence interval compatible with the observed data and the assumed α-value. Using this distribution, we calculate the mean and variance for TM. Samples are drawn from this distribution to create different realizations of TM. Each TM sample and the assumed α-value is a realization of a recurrence interval distribution that can be used for TDRP analysis. The likelihood of each TDRP estimate is calculated from the probability assigned to the sampled aperiodicity value p(α) and the estimated probability for the sampled TM from the likelihood function, l (TM│α). The final TDRP value is formulated as the following:
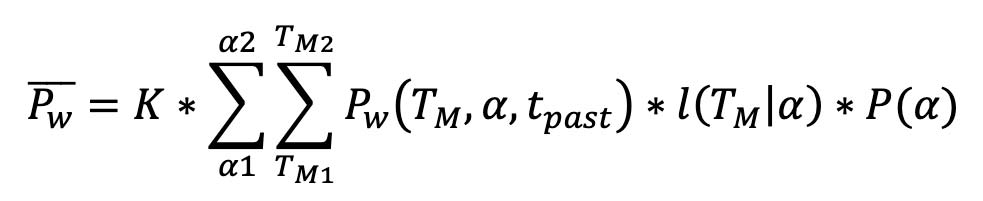
Where Pw (TM,α,tpast) is the TDRP for time window w and Κ is a normalizing factor. This formulation provides a practical way of capturing and incorporating the impacts of uncertainties in the mean recurrence and aperiodicity values on TDRP results consistent with the available data.
Estimating Rupture Probability with a Logic Tree
To estimate the rupture probability for the next large magnitude earthquake on the Nankai Trough, AIR constructed a logic tree based on different combinations and interpretation of historical data as possible stochastic states for large earthquakes on the Nankai Trough. Historical data used for the analysis was limited to earthquakes since 1361. Using this data, we considered the following five logic tree branches for TDRP analysis:
- A model that uses all six rupture dates since 1361: 25% weight
- A model that uses all six rupture dates since 1361 except the 1605 event, assuming it was a tsunamigenic event: 25% weight
- A model that uses events since 1707 to eliminate the impact of 1605 being a tsunamigenic earthquake: 25% weight
- A model that uses HERP’s recurrence interval estimate for Nankai, but with a broader range of uncertainties than what is considered in HERP’s TDRP model: 15% weight
- A model that is directly based on HERP’s TD rupture probability formulation: 10% weight
For each branch, we considered a range of aperiodicity values from 0.22, as was recommended by HERP for its TDRP analysis, to 0.4 ± 0.2 to capture broader uncertainty on recurrence intervals as have been reported in many TDRP studies around the world. All TDRP analyses were conducted using BPT, lognormal, and Weibull distributions with equal weights and for 5-, 10-, and 30-year time windows with 0.2, 0.3, and 0.5 weighting factors, respectively. Higher weighting factors are given to larger time windows to promote model stability. The overall TDRP results for the BPT and lognormal distributions are very similar and slightly larger than those based on the Weibull distribution. The Weibull distribution estimates higher rupture probability for time windows shortly after the last rupture with gradual reversal as the elapsed time increases, compared to those estimated by BPT and lognormal distributions. This implies that the Weibull distribution, compared to others, represent subduction zones with faster healing time of their rupture area after causative earthquakes.
How Do HERP and AIR TDRP Probabilities for the Nankai Trough Compare?
Regarding the integration of TDRP results for different time windows, the TDRP probabilities are first translated into their equivalent Poisson rates and then integrated. The AIR 30-year TDRP (P30) estimate for the next large earthquake on the Nankai Trough is about 30%—much lower than the corresponding HERP P30 estimate of 72%. The main reason for this difference is that the AIR model interprets historical data on the Nankai Trough using different stochastic models accounting for a broad range of uncertainties, whereas the HERP TDRP model uses a single recurrence interval with a small aperiodicity value. The HERP’s use of a single recurrence interval for the Nankai Trough with a small aperiodicity value implies strong confidence in the predictive capability of that formulation for TDRP analysis for large earthquakes on the Nankai Trough. However, this level of confidence is not supported by the limited number of historic recordings, the observed variability in the rupture intervals, and the complexity that one might expect from the subduction of the Philippine Plate with a number of seamounts (submarine mountains) under the Amurian Plate that add complexities to the subduction zone locking/unlocking processes.
The TDRP analysis gives the overall probability of occurrence of a large magnitude earthquake on the Nankai Trough, which could rupture one or multiple segments. We use HERP segmentation and inter-segment correlation probabilities, as shown in Table 1, to simulate earthquakes in AIR catalogs compatible with the overall estimate of the rupture probability. The inter-segment correlation is implemented by assigning the same occurrence years to the correlated event sets. In the next few sections, we discuss the rupture probabilities of the Tokai segment and crustal faults, and we explore multi-fault rupture scenarios.
Tokai Segment
The 2019 HERP model does not consider any rupture scenario for the single-segment Tokai. This is a sharp departure from the 2010 model, which assigned a rather high rupture probability to this segment. Statistically, the possibility of a single-segment Tokai rupture cannot be rejected with confidence, considering how limited the Nankai Trough rupture history is for thorough statistical analysis. AIR’s updated modeling of the Nankai Trough allows for such a possibility. We use the convergence rate for the Philippine Plate within the Tokai region and make an assumption on the fraction of the accumulating seismic moment that could be released by a single-segment Tokai rupture to calculate the corresponding recurrence interval for the assumed characteristic magnitude. The expected convergence rate for the Philippine Plate near the Tokai segment is about 3 cm/year. Using this value, and assuming 10% moment release by a single-segment Tokai-type earthquake, i.e., 90% by multi-segment ruptures as formulated by the HERP 2019 model, AIR estimates about an 878-year recurrence interval for an M7.8 characteristic earthquake for single-segment Tokai.
Crustal Faults
The HERP 2019 seismicity model includes more than 690 crustal faults. Most have rather long recurrence intervals (RIs); in fact, about half of them have RIs greater than 10,000 years. HERP treats these faults as time-independent. The rest are about evenly divided in their treatment as either time-dependent (TD) or time-independent. For TDRP analysis of TD faults, HERP considers a single recurrence with a small aperiodicity value of 0.24, which implies strong confidence that the stated RIs, with small variation, capture the rupture probabilities. The majority of these faults have long RIs and there are limited historical and paleoseismic data to reliably constrain the aperiodicity values for the RI distributions. AIR reanalyzed HERP’s TDRP using larger aperiodicity values between 0.24 to 0.40 to capture the impact of RI uncertainties on TDRP results.
For faults without any historical record, we adapted the open-interval concept, following the USGS TDRP model for California. So, rather than treating faults with no rupture history as time-independent, we assumed that the last major earthquake on each fault happened within a time window defined by its mean recurrence interval (RI) plus one standard deviation with an unknown date of occurrence. To estimate an unbiased TDRP for these faults, we assumed a uniform distribution for the date of occurrence of the last earthquake within the defined time window. We considered the year 1800 as the completeness year (Tc) for the historical data on faults. The assumed completeness time defines the minimum elapsed time for the last occurrence for each fault. Although, it is true that some faults might have a Tc earlier than 1800, we do not have this information for all faults. In addition, if we were to use an earlier Tc, it would result in higher TDRP values. Thus we adapted a more conservative TDRP view for these faults.
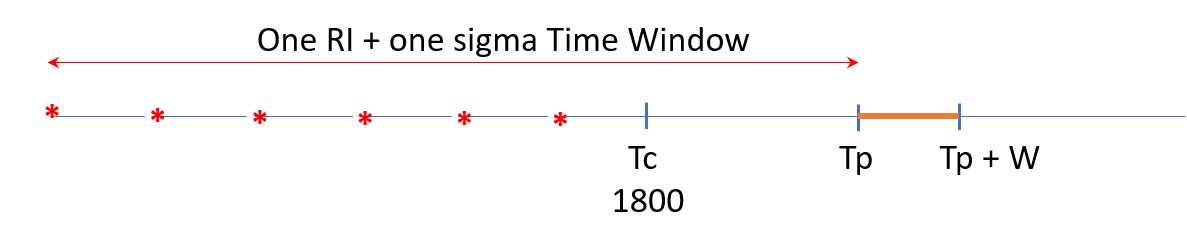
It should be noted that the choice of Tc has the greatest impact on TDRP estimates for faults with shorter RIs, especially those close to the elapsed time since 1800, i.e., 2020 – 1800 = 220 years. Put another way, we can view the minimum elapsed times as percentages of the corresponding RIs. For example, two faults with 300- and 1,000-year RIs, would have minimum elapsed times equal to 67% and 20% of their corresponding RIs, respectively. TDRP analysis predicts a higher rupture probability for a fault with a shorter recurrence interval. Figure 5 shows the TDRP results for faults with no historical records using the open-interval procedure.
Multi-Fault Rupture Scenarios
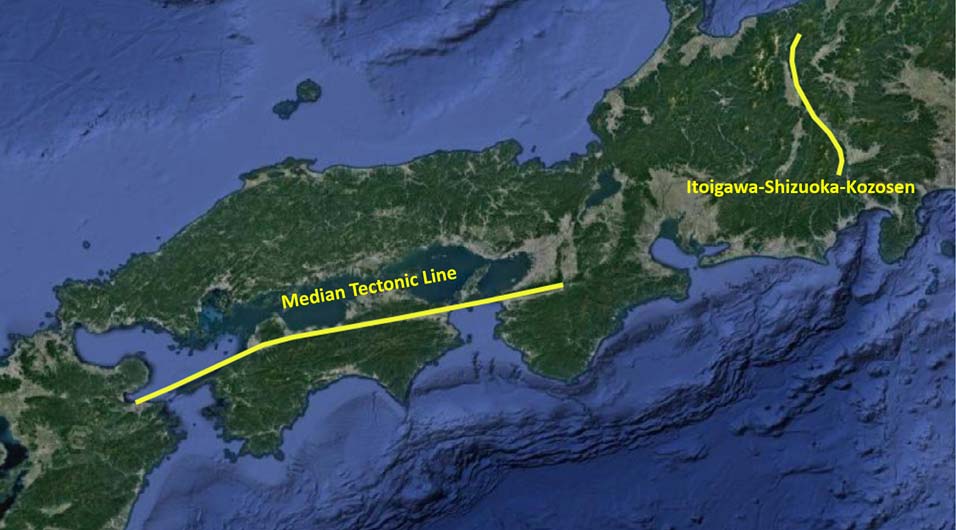
Many earthquakes around the world, such as the M7.8 Kaikoura, New Zealand, quake in 2016 have demonstrated that some large earthquakes rupture multiple faults or fault segments with rather complex rupture geometries that are not typically considered possible. While the HERP 2019 crustal fault model is a comprehensive depiction of all known faults in Japan, it lacks the possible occurrences of very large multi-fault scenarios. To compensate for this shortcoming, AIR’s updated model considers the possibility of multi-fault/segment rupture scenarios for the Median Tectonic Line and Itoigawa-Shizuoka-Kozosen fault segments. We used reported regional strain rates and HERP’s crustal fault and background seismicity databases to constrain the possible ranges for the rate of occurrence of such large scenarios. For the 10,000-year catalog, we consider the possibility of two multi-segment ruptures of all segments of the Median-Tectonic-Line fault with magnitudes of 8.0 and 8.16, and two multi-segment ruptures of all segments of the Itoigawa-Shizuoka-Kozosen fault with magnitudes of 7.53 and 7.72 (see Figure 6).
Managing Japan Earthquake Risk
Ten years ago this year, the Tohoku earthquake unlocked part of the Pacific-Okhotsk plates and relieved stress on the Japan Trench. In the south, however, the Nankai Trough has been locked with the Amurian Plate since the M8.0 Tonankai quake in 1944 and the M8.2 Nankai quake in 1946 and currently poses serious earthquake risk to south central Japan. Our updated Japan earthquake model is based on HERP’s most recent seismicity model but with some modification to the TDRP estimates for earthquakes on the Nankai Trough and some crustal faults to better reflect uncertainties in the HERP 2019 TDRP model and parameters. Considering the importance of large interface earthquakes on the Nankai Trough to earthquake risk in central and southern Japan, AIR conducted our own TDRP analysis especially for the Nankai Trough; the updated AIR Earthquake Model for Japan, anticipated for release this summer, incorporates the results of our analysis to provide the most detailed and accurate view of seismic risk associated with the Nankai Trough.
