
The first quarter of 2022 signaled the start of the third consecutive year of global construction cost volatility. Prices for all building materials have had significant highs and lows at different times over the past two years, making it difficult to plan for new construction. But more importantly it has generated much uncertainty in the face of rebuilding after a natural catastrophe.
We will start with a look at the construction indexes for the countries most affected by the recent cluster of storms in Europe. Then we will take a closer look at a component-level index for Germany to understand how volatility can increase for a specific component. We will finish up with a discussion of sources of economic disruption that will continue to affect the construction market in the near future.
A High-Level Look at Construction Indexes
There are two main types of construction price indexes: input and output indexes. Input indexes include prices for individual components of construction such as steel, concrete, and labor. These components are combined to create an input-weighted overall construction index. These indexes give an indication of what is driving fluctuations in the cost of constructing a building. Sometimes the index can include an additional component such as the cost of project management. The components of these indexes can vary from country to country, so these indexes are not all comparable.
Construction output indexes reflect the cost to the consumer; they include the markup of the input costs and/or profit loading, both of which reflect the current economic environment. Some countries may produce both input and output indexes, so you can see the difference, but some industrialized countries only create output indexes. Choosing which type of index to use depends on your purpose for using them.
After a natural catastrophe occurs, the input construction indexes will tell us where prices are going relative to the current economic environment. When you are trying to keep building construction values up-to-date, construction output indexes will tell us what it will cost today, reflecting any economic changes since the last valuation.
Figure 1 shows the new residential construction output indexes for Germany, the Netherlands, and the UK. The source data is primarily Eurostat, with some backfill from national statistics offices where the data through Q4 2021 had not been incorporated. The indexes have been standardized to Q1 2017 and show the cumulative change through Q4 2021, except for the Netherlands where the latest data was for Q3 2021. The cumulative change pre COVID-19 is shown in blue through Q2 2020, and the remainder of the index is shown in orange to highlight the volatility over the past two years. The trend for each index is represented by the dashed green line.
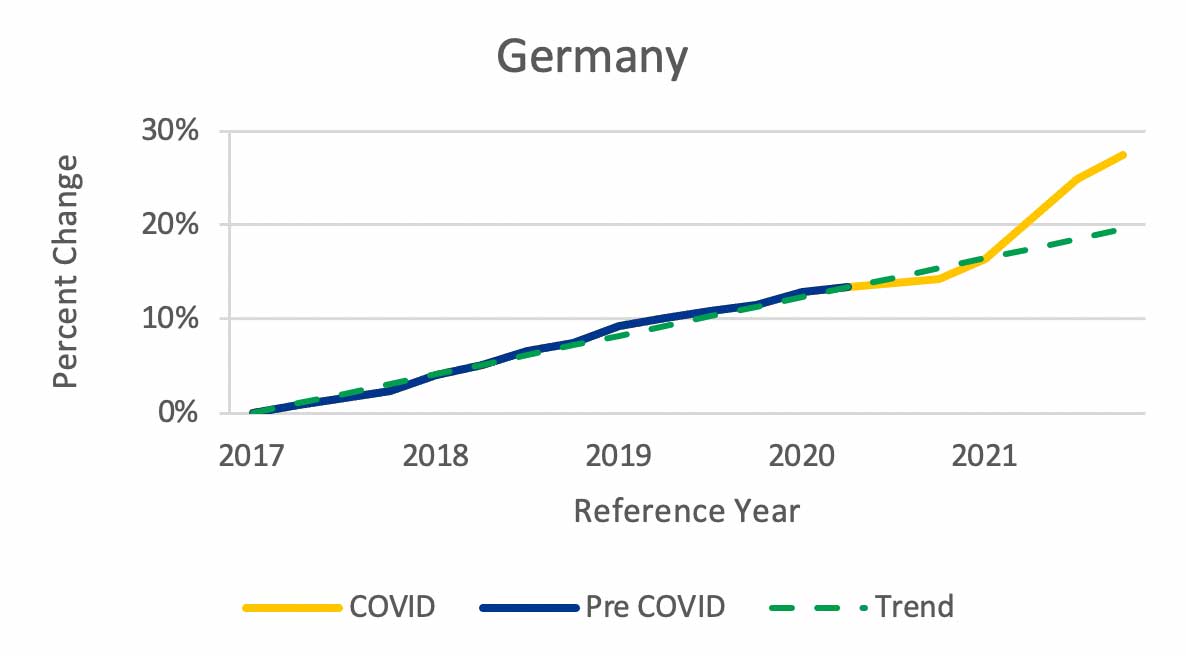
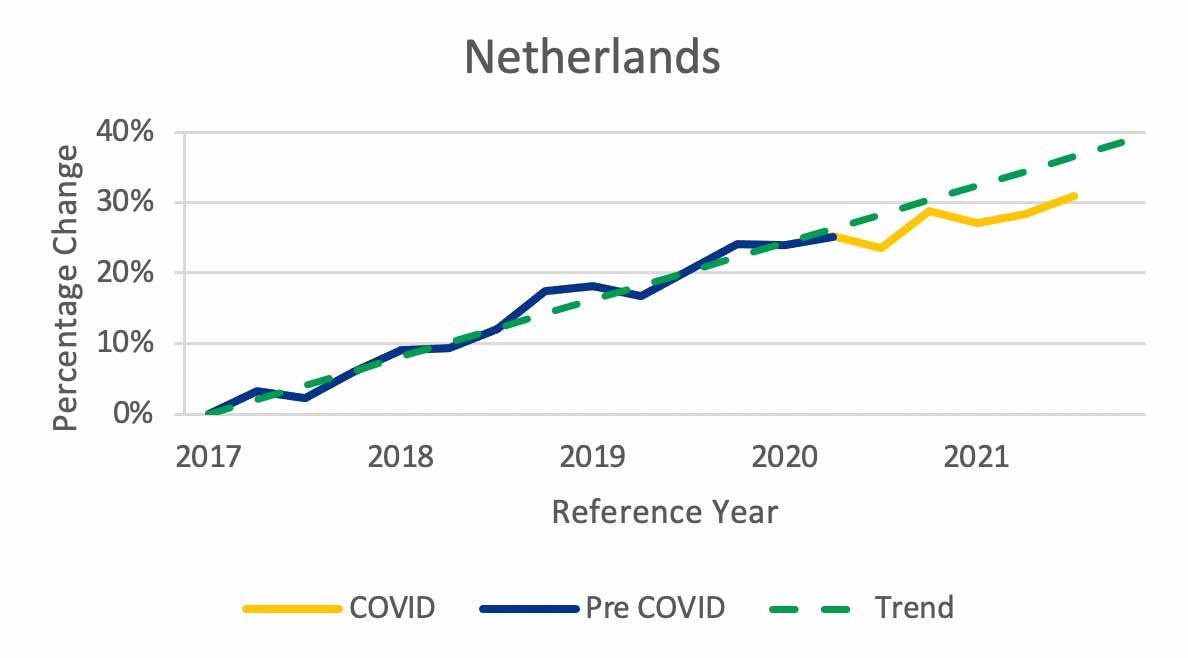
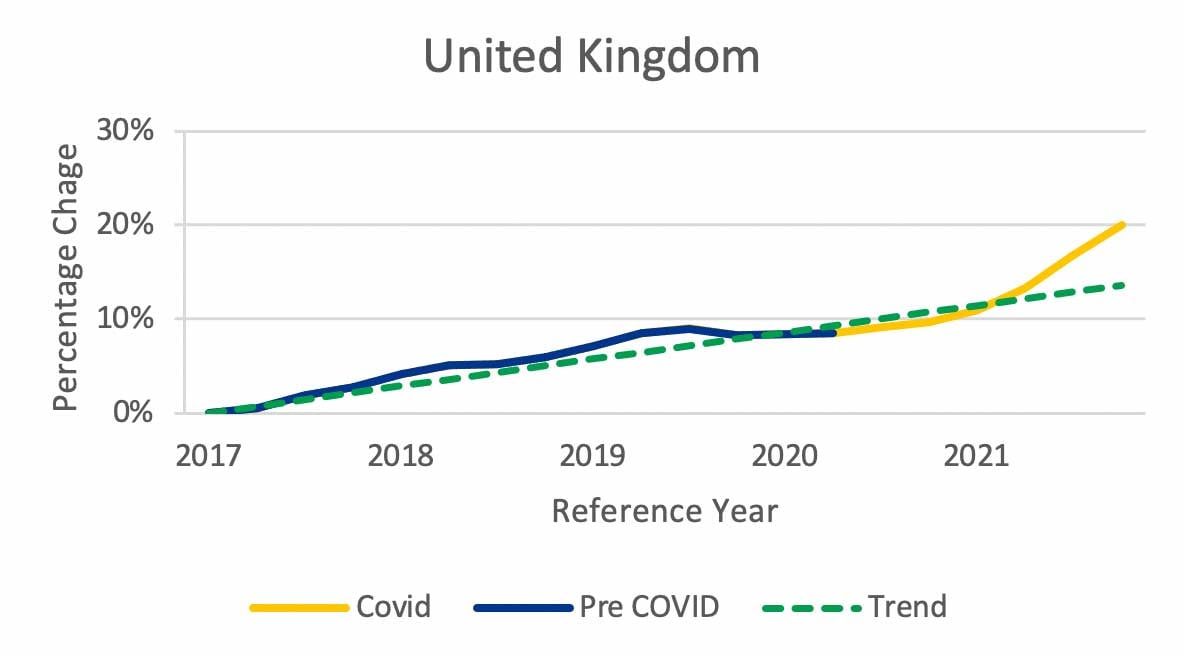
The residential construction output indexes are consistently trending upward at steady rates through Q1 2020 when they start to diverge, and the underlying construction materials input indexes start to cause volatility. The input index has been left out of these charts for simplicity, but keep in mind that it has been driving construction costs during COVID-19. The interesting exception is in the Netherlands where the output index increased at a stable rate over time, indicating an adjustment for economic conditions as materials costs became more volatile.
While the output indexes for all three countries are consistently trending upward, each one moves at a different rate and responds differently from Q2 2020 to the present. Table 1 provides a summary of the construction output index growth rates and how construction costs during 2021 deviated from the trend.
| Germany | Netherlands | UK | |
|---|---|---|---|
| Annual Trend Pre COVID-19 | 3.9% | 7.3% | 2.8% |
| 2021 Year-on-Year Deviation | +6.6% | -3.7% | +4.9% |
Pre COVID-19, annual cost growth rate for new residential construction ranged from a low of 2.8% in the UK to a high of 7.3% in the Netherlands. The second line in Table 1 shows the deviation of the actual growth in 2021 from the trend. The takeaway is that if you assumed that construction costs in 2021 would follow the most recent trend, the deviation from true replacement costs would have been minimized compared to not trending at all.
A Closer Look at Inflation in Germany at the Component Level
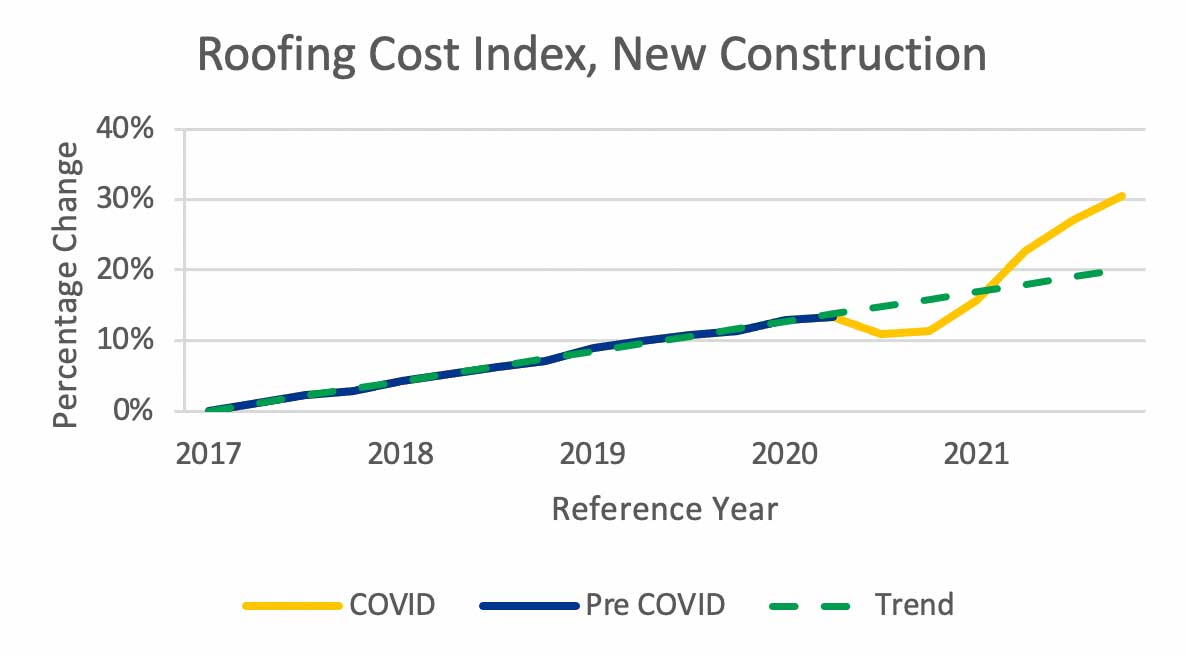
The German statistics office provides more detailed construction information than is typically available. Because of this we can take a closer look at the cost trend of construction work typically associated with European extratropical cyclone, or windstorm, events, namely roof repair. Figure 2 provides a look at the cost trend for roof repair and waterproofing from the German statistics office. The top chart is data from the same data set used for the new residential construction index shown in Figure 1.
As the data in the previous charts was, the roof cost data has been standardized to show the cumulative percentage changes from Q1 2017. The trend for the construction index and roof cost component data are similar, increasing by about 20% in Q4 2021. Focusing on the actual roof cost change during the pandemic (indicated in orange), however, we can see that there was a deviation from trend in the second half of 2020. Roof cost dropped about 5% before returning to an upward trend in 2021 ending up slightly higher than the trend by the end of the year.
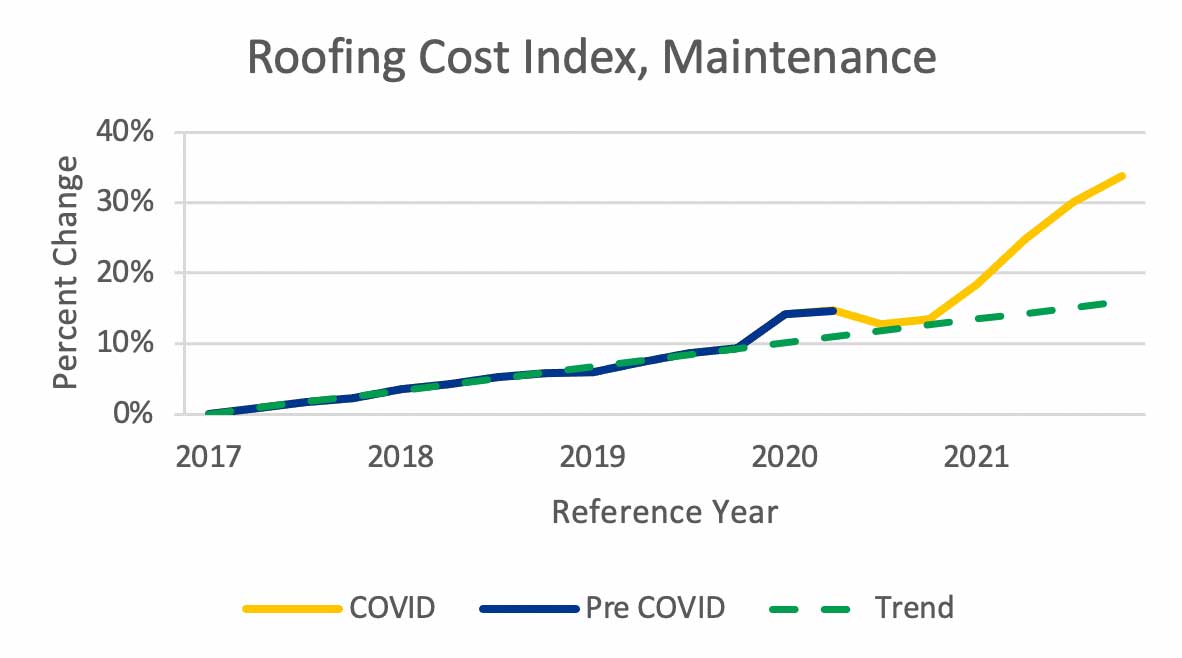
The lower chart in Figure 2 shows how prices were changing for the roof repair/maintenance. The repair cost trend from 2017 to 2021 has been lower than the new roof cost trend; however, the actual repair costs ended up a few points higher than new roof costs by the end of 2021.
How Do You Choose an Index?
There is always a data lag for all construction indexes; the delay can vary by country, ranging from a few months to a year, depending on the data reporting structure. In most early reporting countries, the data is provisional and subject to revision as data is finalized. In most cases it is safe to follow trends to minimize uncertainty while waiting for the data to be finalized. Table 2 shows the average annual trend for the Germany data we have been looking at.
| New Roof Construction | Roof Construction | New Residential Construction | |
|---|---|---|---|
| Annual Trend Pre COVID | 4.0% | 3.2% | 3.9% |
The trends for new construction costs, both new roof and new residential, are similar at about 4%. The trend for roof maintenance costs is significantly lower at 3.2%. Choosing the right one to keep the value of an insurable building current depends on what perils are covered for the building. I mentioned earlier that roof repair is a typical cost after a windstorm, but it isn’t the costliest component of construction costs after a windstorm or a typical post-event cost for perils other than windstorm. For general use, it makes more sense to go with the overall construction index, then do sensitivity testing for peril-specific construction components.
Consider the example of roof repair in Germany. If a policy was renewed on July 1, 2021, the only available data for valuation that is reasonable, given the historical experience, is the residential construction index. By the end of the year, the trend for roof repair would have started to stand out. Table 3 shows the deviation of roof construction and repair costs between the construction index trend for Germany that we looked at in Figure 1 and the actual index values for Germany roof construction we looked at in Figure 2.
| New Roof Construction Cost | Roof Maintenance Cost |
|---|---|
| +8.8% | +12.4% |
These deviations for peril-specific repair work, ranging from 9 to 12%, are significant. While this component cost makes up only a small part of total building construction costs, including it as part of sensitivity testing before the winter storm season makes sense.
Future Uncertainty and What to Expect
In this post we had a high-level look at three countries impacted by the recent European extratropical cyclone cluster. Two in the European Union (EU), the Netherlands and Germany, and one in the UK. One interesting finding is that while the construction output indexes are higher in the EU countries, there are still significant differences between the growth rates of these indexes in the Netherlands and Germany (Table 1). The higher growth rate in the Netherlands was able to be adjusted to the fluctuating construction materials costs during 2021 without a major change in the trend. Outside the EU, we saw that the growth rate in the UK was much lower. Early speculation as to what would happen after Brexit indicated a belief that construction costs would be more expensive in the UK as compared to the EU, so the lower growth rate as shown in Table 1 was a surprise. It is important to remember that all the residential construction cost indexes we have looked at are averages based on the typical inputs to a benchmark structure. Within each country, costs can vary by region, construction practices, and typical dwelling. While trending building valuations with construction indexes can minimize the impact of cost fluctuations, it does not eliminate it. Because of the delay in reporting and data access, it is frequently necessary to project index trends to approximate current valuations.
Another important takeaway is that the construction index used must be suited to the purpose. Output indexes include the impact of the current economic environment on the cost to build and repair. These indexes provide a complete view of what your cost of building replacement will be on average.
When we are looking to rebuild after a natural catastrophe, construction input indexes give a more realistic view of what it will cost, assuming the economic environment remains constant in the short term. We must still pay attention to what is going on in the broader economy. During the second year of the pandemic, we saw continued supply chain disruptions drive up the cost of construction materials.
While we did expect the market equilibrium for construction materials to stabilize over 2022, a new round of unrelated supply chain disruptions early in the year added volatility. What happens with construction indexes this year is dependent on the construction industry. A decrease in demand for construction can drive prices down and should not be unexpected, given current global consumer price inflation. Higher prices for everyday living will drive choices about discretionary spending for everyone. On the materials producer side, much of the uncertainty depends on the resilience of supply chains and the ability to adapt. As access to some producers are shut down, the capacity of other producers of construction inputs becomes much more important. It comes down to the answer to this question: Are we able to substitute a materials supply with another one at a reasonable cost?
These are just some of the factors adding to the inflationary state of the global economy. Verisk will be monitoring the situation as it unfolds this year and keeping you up to date as the situation changes.
How the Pandemic Has Impacted Reconstruction Costs After Germany’s Extreme Flood Event