Significant flooding occurred when low pressure system “Bernd” parked itself over central Europe in mid-July 2021. In Germany, the Rhineland-Palatinate and North Rhine-Westphalia regions experienced heavy and, in some cases, historic rainfall with the border region between the states of Bavaria, Thuringia, and Saxony affected by localized flooding as well. Of all the natural hazards that cause property damage in Europe, flood is the costliest.
Understanding the impact of an extreme event on the cost of reconstruction during the economic uncertainty caused by the COVID-19 pandemic can seem daunting. To put the July flood event in perspective, we will compare what we know so far about it to two historic events that also impacted Germany: the Elbe Flood in 2002 and Winter Storm Kyrill in 2007.
Using Historical Events to Gain Perspective
I have written before about economic demand surge and how it impacts all reconstruction, not just the claims of the insured. To compare major losses of the past, not only do we have to trend historical events to the current day, but the impact of insurance take-up rates must be removed. Take-up rates can change over time and vary by natural peril. For this analysis we are going to assume that all damaged properties had to be repaired.
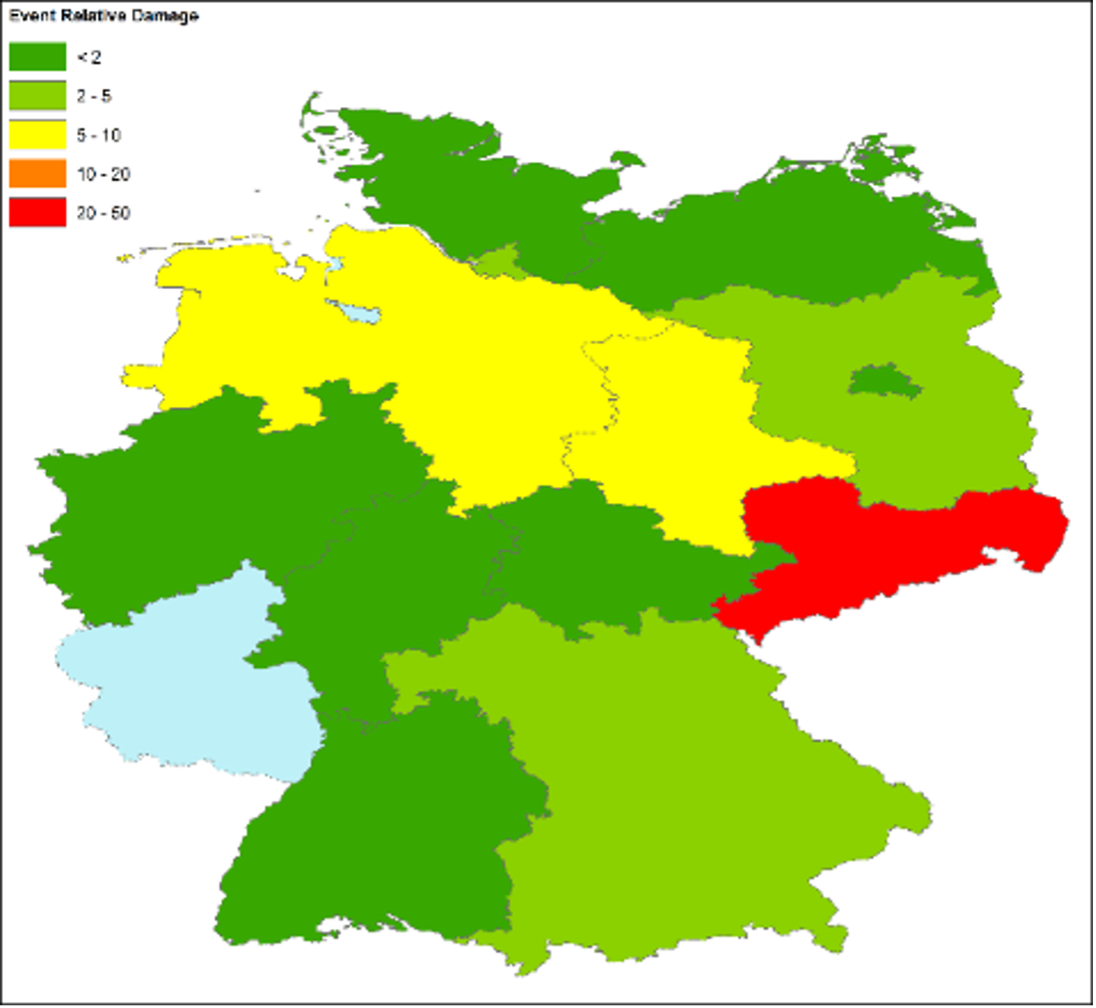
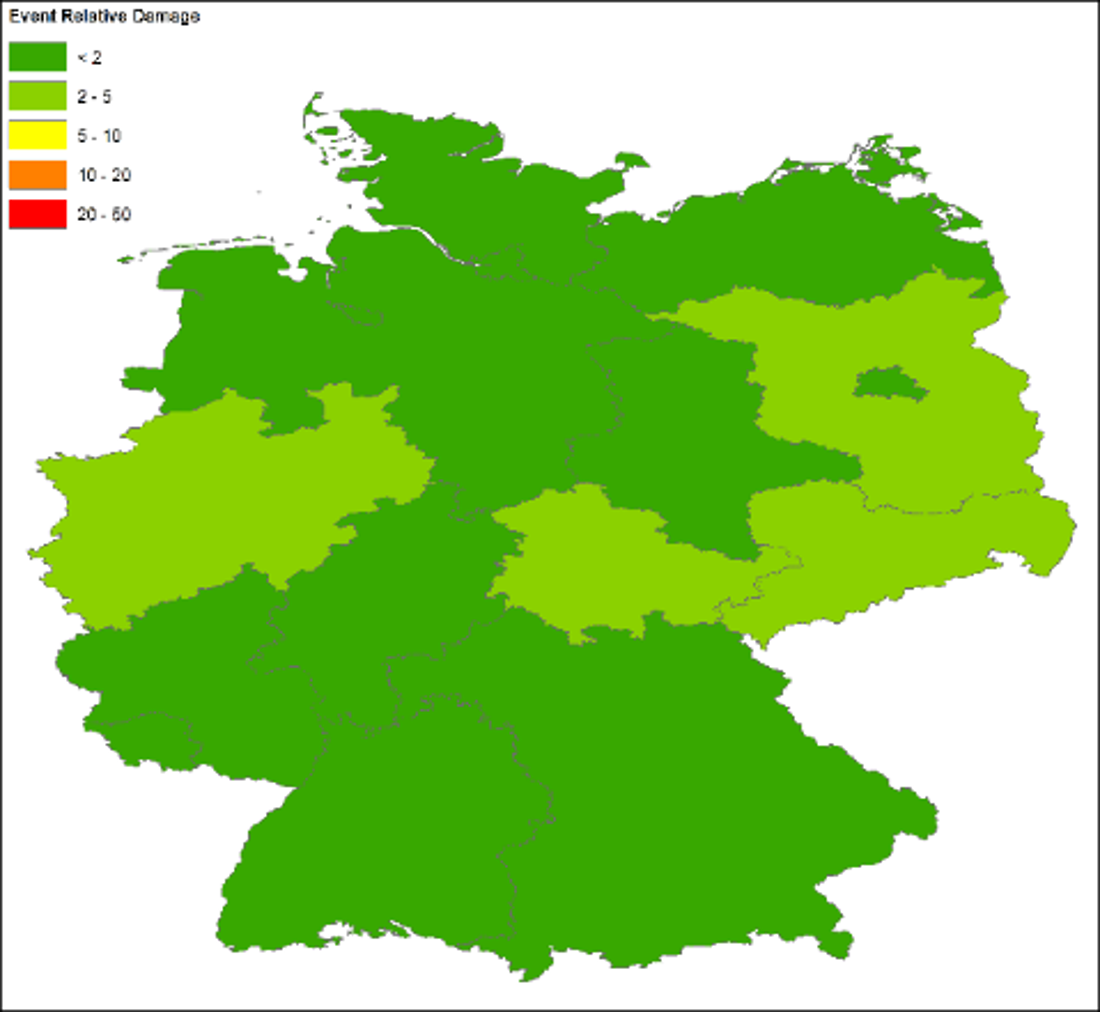
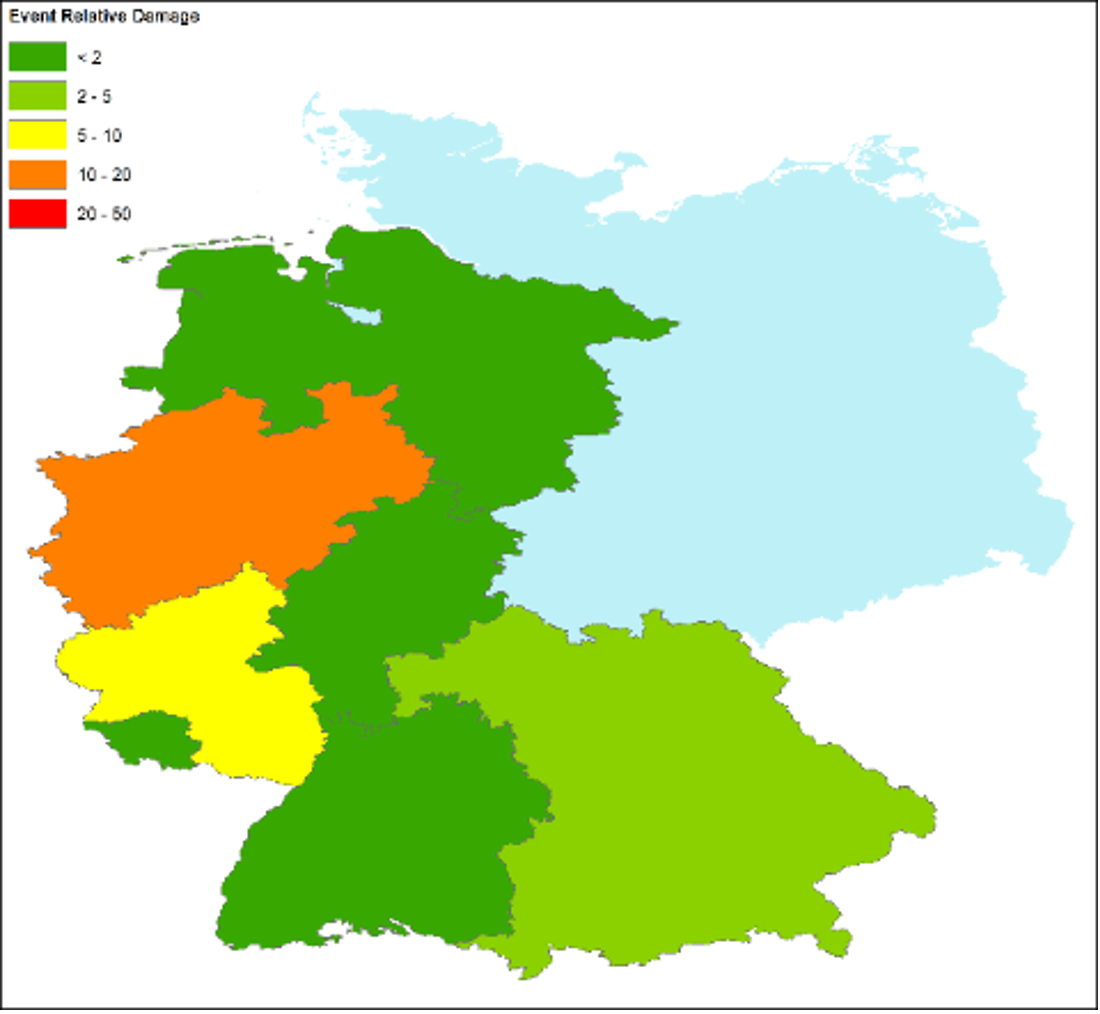
Figure 1 shows the relative damage from the selected historical events. At the top, the 2002 Elbe flood, in the middle the 2007 Winter Storm Kyrill, and at the bottom the July 2021 flood. The intensity scale is the same for all three events showing the damage at the state level. The areas in light blue have negligible or no losses. In 2002, the most impacted state was Sachsen, which is indicated by red in the top map. In 2021, the most impacted state was Nordrhein-Westfalen, shown in orange in the bottom map. Because the sizes of the states differ, we must have an additional metric to compare the relative damage. The significant takeaway from the maps is that the 2002 and 2021 flood losses are localized compared with the map of Kyrill in the middle, which shows constant levels of damage across the country.
A common way to assess the impact of an extreme event on the labor market is to look at repair value per worker. We can use this to compare with the repair and building costs response at the time of the event. The number of construction workers in Germany by state can be found at Eurostat, but the time series only starts in 2007. This is the last year before Poland and the Czech Republic became part of the Schengen Area, so it won’t have the impact of construction workers coming in to do repair work until after Kyrill. This effectively limited the supply of available labor and helps us make an important point.
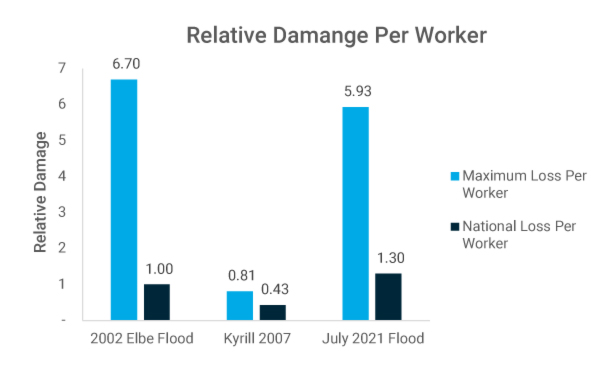
Figure 2 shows the relative work level or damage per worker for each of our events. The bars in blue show the maximum workload per worker for the state most affected. As described above, this is Sachsen for the 2002 event; for the other two events it is Nordrhein-Westfalen. The orange bars show the relative workload per worker nationally. The national workload per worker for the 2002 event is set to 1; the other metrics are relative to that. Nationally, Kyrill caused about half the workload that the 2002 flood did; the 2021 flood figure is about 25% higher than the 2002 event. More interesting is what the blue bars are telling us for the flood events. In 2002, the workload level for Sachsen was almost seven times higher than the national average. Even after adjusting to current day values, the July 2021 flood damage per worker is only six times higher.
For the 2002 and 2007 events, I used the construction worker counts from 2007. The events are relatively close in time and we assume that employment is stable prior to the Great Recession in 2009. By 2019 the national construction labor force increased by about 3%, but we have no easy way of assessing the impact of cross-border workers. In 2020, the count of construction workers in Germany dropped almost 20%. This can be attributed to local workers being laid off, but it most likely includes cross-border workers unable to make it to their place of employment. I have used this lower worker count to create the metric, but any laid off local workers could easily be added to take up the workload.
Historical Repair Costs
Germany saw no significant increases in national construction costs after the 2002 flood event, and only minor increases driven mainly by material cost inflation after Kyrill. Figure 3 shows the cumulative change in the residential construction cost index for Germany from a baseline in Q1 2002 until what was considered the end of the Great Recession in 2009. The time of the 2002 flood is indicated by the vertical orange line, and Kyrill is indicated by the vertical green line.
There were no discernable disruptions to the labor or materials market after the 2002 flood. From 2002 to 2003 the index is flat in Germany, so the flood event in 2002 did not provide a significant impact on the construction market. There are also no discernable disruptions to the labor or materials market for the same period after the 2002 flood. There was an initial jump in the index after Kyrill but only minor increases for the remainder of 2007. The increase associated with Kyrill is primarily from an increase in the construction materials market. After peaking in Q2 2008, the construction cost index remained stagnant for six quarters during the Great Recession. The whole series from 2002 to 2009 can be characterized by periods of cost stagnation separated by jumps in cost. This is only remarkable because of the way cost evolved after the Great Recession.
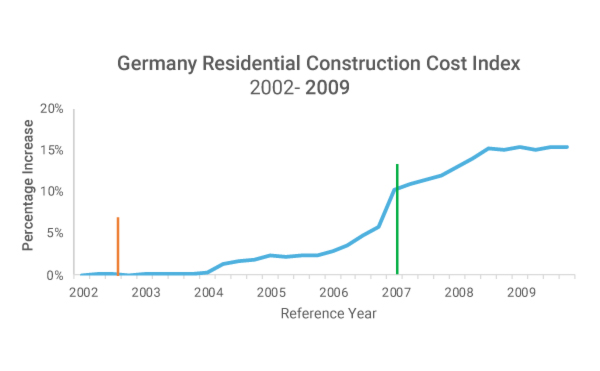
Figure 4 continues the cumulative change in the residential construction cost index for Germany from a baseline in Q1 2002 but for the period after the Great Recession, starting Q1 2010 until Q3 2021. The period before the COVID-19 pandemic is indicated by the blue line; the period after is indicated by the orange line. The July 2021 flood is indicated by the vertical green line. In contrast to the prior period, this one is characterized by a steady increase in the cost of residential construction of about 3% annually until Q1 2020.
Having a predictable increase in construction costs makes one aspect of planning for catastrophe losses straightforward. Adjusting property valuations upward by the expected increase simplifies accounting for the change in the cost of construction before an event takes place. This has become more complicated during the pandemic. In the second half of 2020, costs dropped in Germany as they did in other parts of the world. Starting in Q1 of 2021, the increased cost of materials drove the index even higher than expected by Q3 of 2021.
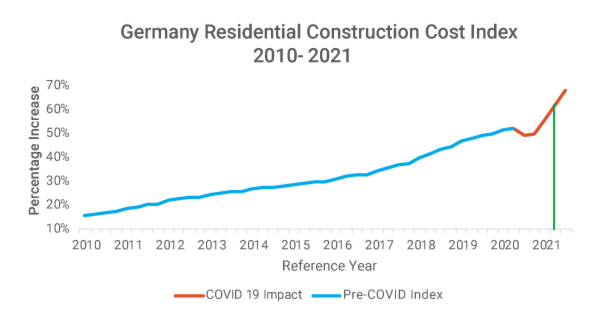
It has recently been reported that the year-on-year increased cost of residential construction was 12% and a full 3% over the prior quarter. It is challenging to keep up with costs that seem to be changing daily; however, not accounting for current costs can make is harder to evaluate expected losses after an extreme event, especially the July 2021 flood.
Economic Demand Surge and Claim Inflation Today
How can the historical data help us understand what could happen today? In a non-pandemic economy, I would expect no or minimal impacts on the construction labor market. Compared to historical events, the amount of repair value per worker is not high and given the slack in the market from pandemic layoffs there should be ample supply of construction workers. But this economy is not normal, and we must consider what else could drive the cost of labor up. The increase in consumer inflation is probably the most disruptive source. Automatic cost-of-living adjustments in labor contracts could have a big impact soon, as well as new contracts being negotiated. This source is speculative, but we should be aware of it.
Another contributor could be the safety precautions put in place at construction sites limiting the number of workers. When I looked at labor cost inflation after 2020’s record breaking hurricane season and its impact on Louisiana, there was some evidence of an increased cost. From Q2 to Q4 of 2020, the cost of construction labor nationally went up about 4% which is significant for six months. The upward trend did moderate for the two quarters after that. One way of interpreting this is the cost of COVID-19 on workplace behavior. While workplace rules in Germany are not the same as in Louisiana, it does provide some insight on how labor cost can respond in an industrialized economy.
The most significant impact is going to come from the increased materials costs that are affecting all markets. A recent article by ING Research looked at the increased cost of construction materials in Europe since the beginning of the pandemic. Most notably, the article highlights that while some of the relative changes in various construction materials since Q1 2020 were on a steady upward trend, they all increase sharply starting in Q1 of 2021. ING’s analysts predict materials costs will remain high in Europe through 2022, but that cost increases will vary dramatically by material category. The impact on claims is going to be dependent on the mix of materials required for repairs.
Other areas of uncertainty and volatility are contents and additional living expense losses. Since the beginning of the pandemic there have been two major sources of supply chain disruption. In some countries, factories have been shuttered to stop the transmission of COVID-19; others have just reduced the workforce. The impact is the same—a smaller supply of goods unable to fill the increasing demand of consumers stuck at home. This increased demand is further exacerbated by an inadequate supply of shipping containers and ships causing a slowdown in delivery times. What does this mean for claims? For contents losses, appliances damaged by floods that are affected by supply chain disruptions are going to cost more because of supply scarcity. For additional living expenses, delays in getting equipment to complete repairs and make a dwelling habitable mean more time spent in alternative housing.
The Bottom Line
Reconstruction costs are more expensive today than they were a year ago. The increase in the residential construction cost index for Germany means that costs are higher on average nationally; this affects the high- as well as the low-severity claims from the July 2021 flood event. The difference in magnitude of the impact will come from the mix of construction materials used. The German statistics office also puts out indexes for the individual components of the total index allowing us to gain insight into the cost of lumber construction versus concrete work, for example. Minor losses are less likely to require repairs that use more expensive inputs such as structural lumber; however, dwellings that are a total loss would require a broader mix of inputs that reflect the increases indicated by the total reconstruction index.
The ongoing economic disruptions from the pandemic are the most likely source of cost increases from a post-extreme event perspective. These increases are outside the scope of what we typically refer to as economic demand surge, which tries to answer the cost increase question from a post–extreme event perspective. But what we call it doesn’t matter, as reconstruction after this year’s flooding in Germany is going to be more expensive than if it had occurred in a non-pandemic economy and claims are therefore going to be higher.
Get a free 30-minute consultation with an expert from the AIR Supply Chain Consulting Services Team

