Imagine you’re in a house that has the misfortune of being subjected to every type of natural catastrophe. The house can be in one of two locations—where you live, or the center of your city. Which types of disaster do you think would cause the biggest difference in the loss at those two locations?
Think about it and you’ll probably conclude that a water peril would cause the biggest difference—flood, for example, or surge/tsunami if you live near the coast. A peril such as European windstorm, on the other hand, would have a much lower variation in loss because the hazard doesn’t vary much over distance. Are earthquakes and severe thunderstorms as sensitive to location as flood, or less sensitive? This blog uses AIR’s catastrophe models to try to come up with an answer.
In a catastrophe model, risks are represented by one point in space—the latitude and longitude coordinates of the exposure (residential home, in this case). In real life we know that buildings are generally large; they have footprints extending over thousands of square feet. For many perils this metric may not cause much variation in modeled losses. But in the case of flood, for example, using a geocode located at the front or back door of a property can make the difference between placing it in or out of a flood extent.
Placing a ring around each location or using the building’s footprint can increase the number of risks impacted by an event and even lead to better matches for modeled versus observed losses. This distributed exposure benefit is even greater for large facilities, such as industrial plants.
Geocoding is just one of the many uncertainties in any catastrophe analysis—uncertainties in the underlying physical properties (e.g., the elevations assumed in a flood model), assumed characteristics of the exposure (e.g., construction, occupancy), uncertainty in the values of damage modeled, and so on, all contribute to uncertainty in the overall exceedance probability (EP curve). Here we investigate just one of these sources of uncertainty.
A Test
To quantify this peril sensitivity as a function of geocode and see how sensitive EP curves are to geocodes, we ran four models (U.S. hurricane, U.S. earthquake, U.S. severe thunderstorm, and U.S. flood) over exposure in two states. Both selected states, Florida and Illinois, are affected by multiple perils.
Our exposure consisted of the same value in each ZIP Code and we ran 100 EP curves, each time using a random latitude/longitude coordinate in each ZIP Code. The 100 sets of exposure therefore have the same replacement value in each ZIP Code, but slightly different geocodes in each run. We then took the 5th and 95th largest of the 100 EP curves and plotted the results for each of the four models. Figure 1 shows a range using representative values from the Florida and Illinois runs and the y axis is the percentage difference of each model relative to the average EP curve for that model.
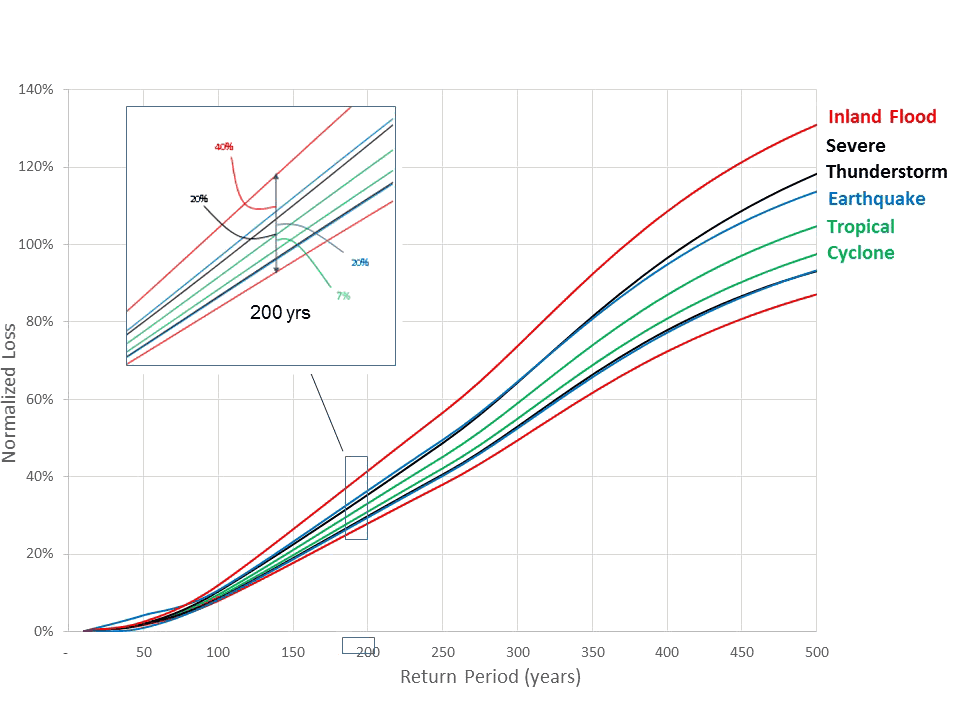
Tropical cyclone shows the least variation, and flood the most due to the larger variation in intensity over distance for flood versus wind. For the exposures we analyzed, earthquake and severe thunderstorm appeared to have similar uncertainty ranges. Earthquake intensities can vary in a large way due to differing geology and soil conditions. For severe thunderstorm, small changes in latitude/longitude can put exposures in or out of some footprints, such as a narrow tornado swath.
Of course, the results we obtained could have been different if different exposure had been run and different models used (e.g., Japan typhoon, earthquake, and flood) each with their own sub-perils. The reader is invited to perform similar experiments to see the variation in observed behavior across different exposure sets and models.
One final point is that the EP curves for all locations combined would tend to have more convergence and less variation in general than EP curves at location level, which would tend to have much wider intervals. Variations can average out more at the macro level. Hence the results here are more valid at a portfolio level than at a location level.
Geocoding is important, though for some perils much more important than for others.