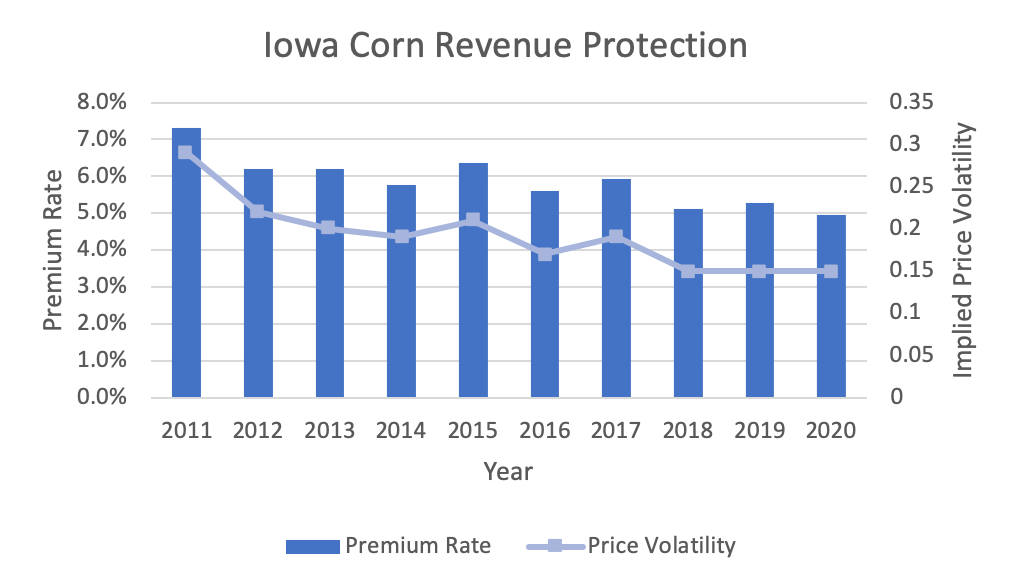
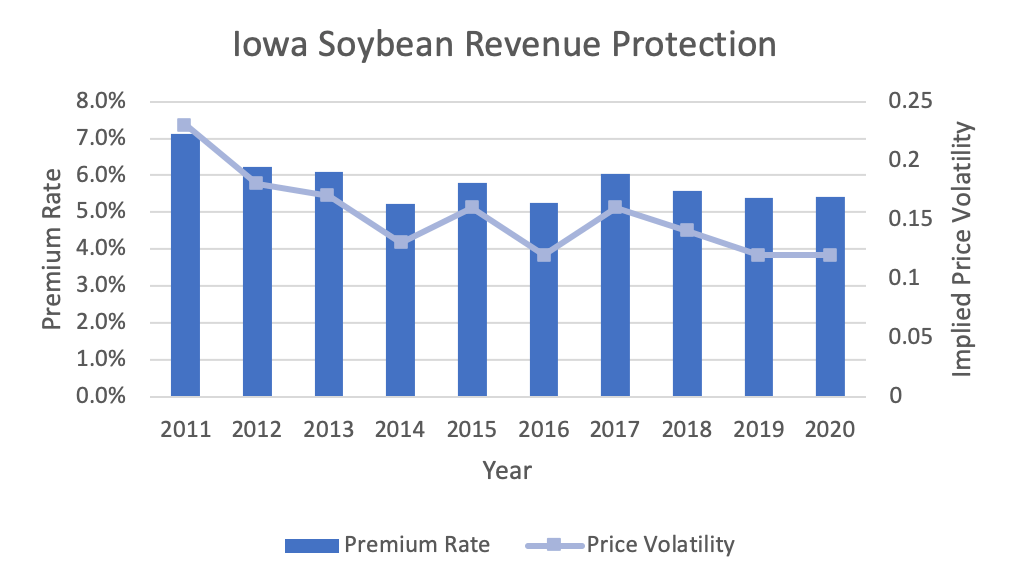
Crop prices for the U.S. Multiple Peril Crop Insurance (MPCI) Program are generally established using the commodities futures market, with two discovery periods to establish a projected price at the start of the season and a harvest price at the end of the season. The biggest driver of crop premium rates set by the Risk Management Agency (RMA) for revenue products, however, is price volatility—the market expectation of price uncertainty.
How Price Volatility Works
Price volatility measures the market's expectations of uncertainty surrounding how the harvest price may differ from the projected price and dictates premium increases to compensate for liability fluctuations. In a single year, the higher the price uncertainty, the greater the market uncertainty surrounding price outcomes. High implied volatilities indicate the potential for large price swings, while low implied volatilities indicate smaller swings (Figure 1). The final price volatility used for crop insurance rating is an average of the implied price volatility obtained from futures market data during the last five days of February for corn and soybeans and adjusted for the growing season.


Expected Premium Increases
Premium rates are influenced significantly by price volatility. If implied price volatility measures are high at planting, premium rates will be higher than if low implied price volatility is established for the crop year. As average coverage levels chosen by growers rise/fall, the impact of the implied volatility on premium volume also rises/falls. If price volatilities fall, the net impact is a reduction in premiums, all else equal. (Learn more about why premium rates matter for fund designation in this blog.)
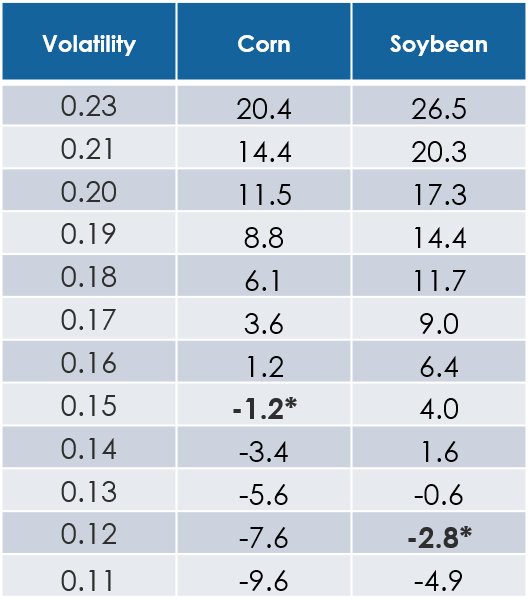
Table 1 shows the percentage changes in premium rates from 2020 to 2021 for corn and soybean across potential 2021 volatility levels. 2020 volatility was 0.15 for corn, and 0.12 for soybean . 2021 volatility is 0.23 for corn and 0.19 for soybean. For 2021, premium rates are expected to increase for much of both corn and soybean due to increases in volatility. It is important to note, however, that the final outcome may differ greatly as it depends directly upon how the crop’s producers choose to plant and policy terms.

*Fixed 2020 volatilities are bolded and asterisked.
Rate Changes, Price Volatility, and Managing Your Crop Risk
Crop insurers and reinsurers use the AIR Multiple Peril Crop Insurance Model for the United States, available in Touchstone Re™, to price and manage crop portfolio risk. To effectively manage your U.S. MPCI risk, both rate changes from the RMA and price volatility must be taken into account. AIR conducts an analysis of every year’s rate changes from the RMA to estimate the pure change in premium rates and provides a rate mask that can be used with our U.S. MPCI model. The updated mask reflects the premium rate structure for the given year.
While the rate mask ensures that the correct premium rate structures are in place for the upcoming season, the AIR U.S. MPCI model also allows users to compensate for price movements through catalog selection. The model comprises four catalogs, representing high, medium, historical average, and low scenarios for price outcomes (known as the High, Medium, Historical, and Low catalogs, respectively). The Historical volatility catalog exhibits price volatilities closest to the historically observed price swings from 1974 to 2017. In the Low, Medium, and High catalogs, the model uses the RMA-established price volatility from 2003 to 2017 to determine the associated price volatility.
For the most accurate view of risk, users should review all four catalogs to conduct crop portfolio analyses that provide a blended view of the risk as well as choose the catalog that best reflects the price volatility for the given year. For 2021, AIR’s recommendation to clients is to review the medium and historical price volatility catalogs, as these are currently most representative of market conditions.
Learn why understanding your price risk is crucial in today's crop insurance market


