
Dry, hot conditions ravaged large parts of Canada throughout 2021—setting a new Canadian record high temperature of 46.6° Celsius—1.6° higher than the previous record. Given the weather conditions, wildfires have garnered a lot of interest this summer but for crops the impact of this year’s drought is likely to be significant, if not historic.
Current Weather Conditions and Outlook
The dry conditions in western Canada have been a concern as far back as the seeding period when warm and dry conditions allowed planting to begin early in the season and to progress quickly. By July 31, Agriculture and Agri-Food Canada reported that nationally 74% of agricultural land was classified as Abnormally Dry to Exceptional Drought (D0-D4) with nearly 99% of the agricultural landscape in the Prairies classified as drought. Large parts of Manitoba hit the D4 (Exceptional Drought) level—representing an event that occurs every 50 years—while southern Saskatchewan experienced D3 (Extreme Drought), representing an event that occurs every 20–25 years.
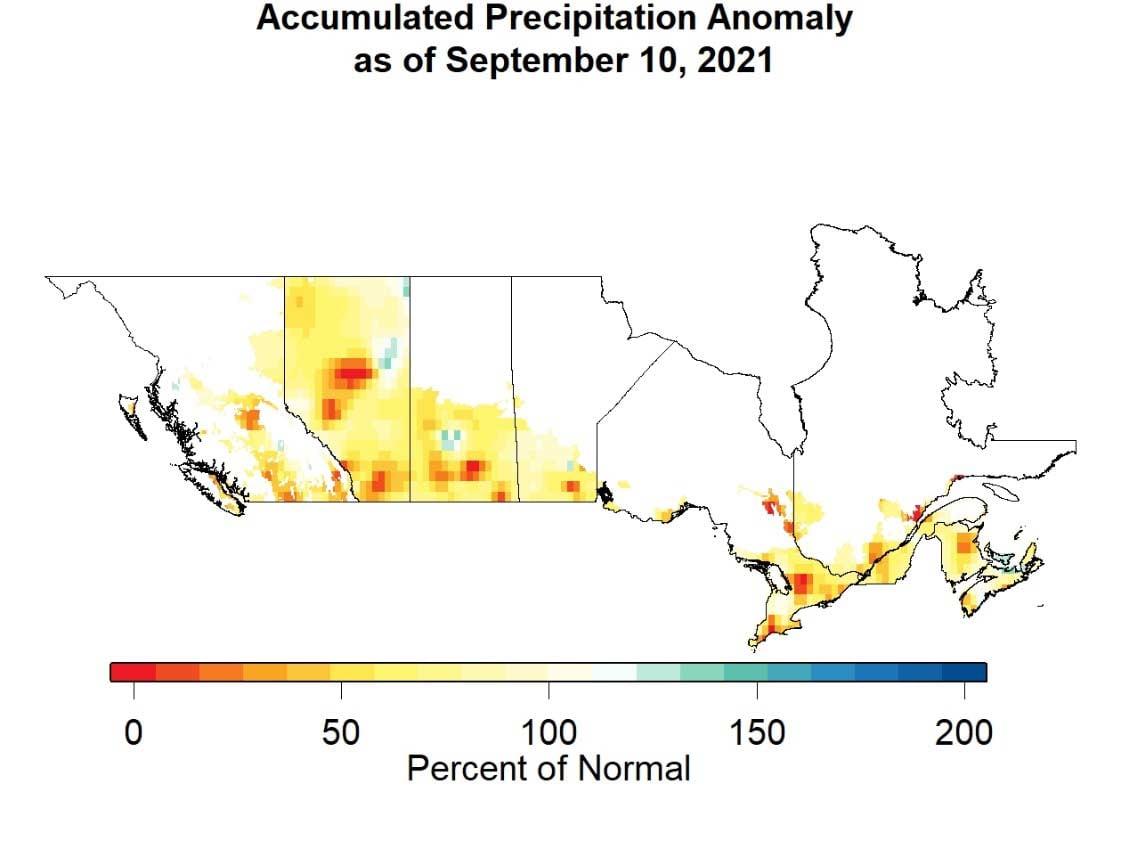
The total precipitation deficit as of September 10, can be seen in Figure 1, with extremely low total accumulated precipitation relative to normal in central Alberta, as well as in southern Alberta and Saskatchewan. Most areas across the country have lower than normal precipitation.
Weather Impact on Crop Yield Estimates
While official yield statistics won’t be available until December, a collaborative effort by the Remote Sensing and Geospatial Analysis Section, Agriculture Division, Statistics Canada and Agriculture and Agri-Food Canada (AAFC) produces yield estimates using remote sensing, agroclimatic data, and survey data. Their findings for canola and spring wheat, as of August 30, are summarized in the fourth column of Table 1 and show dramatic decreases in yields relative to the 5-year average.
The AIR Multiple Peril Crop Insurance Model (MPCI) for Canada estimates yields for major insured crops on an 8-km grid by accounting for the effects of weather on yield throughout the growing season and assuming that there will be no further beneficial or adverse weather impacts from the estimate date to the projected harvest date. These estimates account for extremes in water availability and temperature, but not for hail events. We calculate yield ratios—yields measured relative to estimates of what the “normal” yield for crops would be (given current practices and technology)—which could differ from the 5-year average yield. AIR estimated yield differences for canola and spring wheat, using reported weather up to September 10, are shown in the fifth column of Table 1.
| Crop Type | Geography | 5-Year Average Yield (Bushels per Acre) | Statistics Canada / AAFC Estimates as of Aug. 30 Relative to 5-Year Average Percent (% Difference) | AIR Estimated Mean Yield Ratio (% Difference) as of Sept. 10 |
|---|---|---|---|---|
| Canola | Manitoba | 41.56 | -22% | -10% |
| Saskatchewan | 41.52 | -49% | -17% | |
| Alberta | 41.68 | -31% | -23% | |
| Spring Wheat | Manitoba | 57.37 | -16% | -7% |
| Saskatchewan | 47.54 | -36% | -24% | |
| Alberta | 55.64 | -37% | -22% |
In both sets of yield estimates in Table 1, the yield deficits are significant and are assessed to be more severe for Alberta and Saskatchewan than for Manitoba. In general, the AIR estimated yields are higher than the Statistics Canada/AAFC estimates. The Statistics Canada/AAFC estimates, however, are presented relative to the 5-year average, and the past 5 years have seen relatively good outcomes, possibly overestimating the impacts of 2021’s weather.
There are some reasons to think that in a year such as 2021 the AIR model would underestimate the impacts. A series of severe storms producing crop-damaging hail impacted the Prairie Provinces between August 21 and 28, for example, and hail impacts are not included in the AIR estimate. In addition, the AIR model assumes that the weather will return to normal after the effective estimate date and continue to be normal for the remainder of the growing season—giving crops the opportunity to recover. As the majority of the 2021 growing season has passed and there are widespread expectations for a poor harvest, many farmers may have decided to cut their losses, dialing back on pesticide costs or harvesting early, for example.
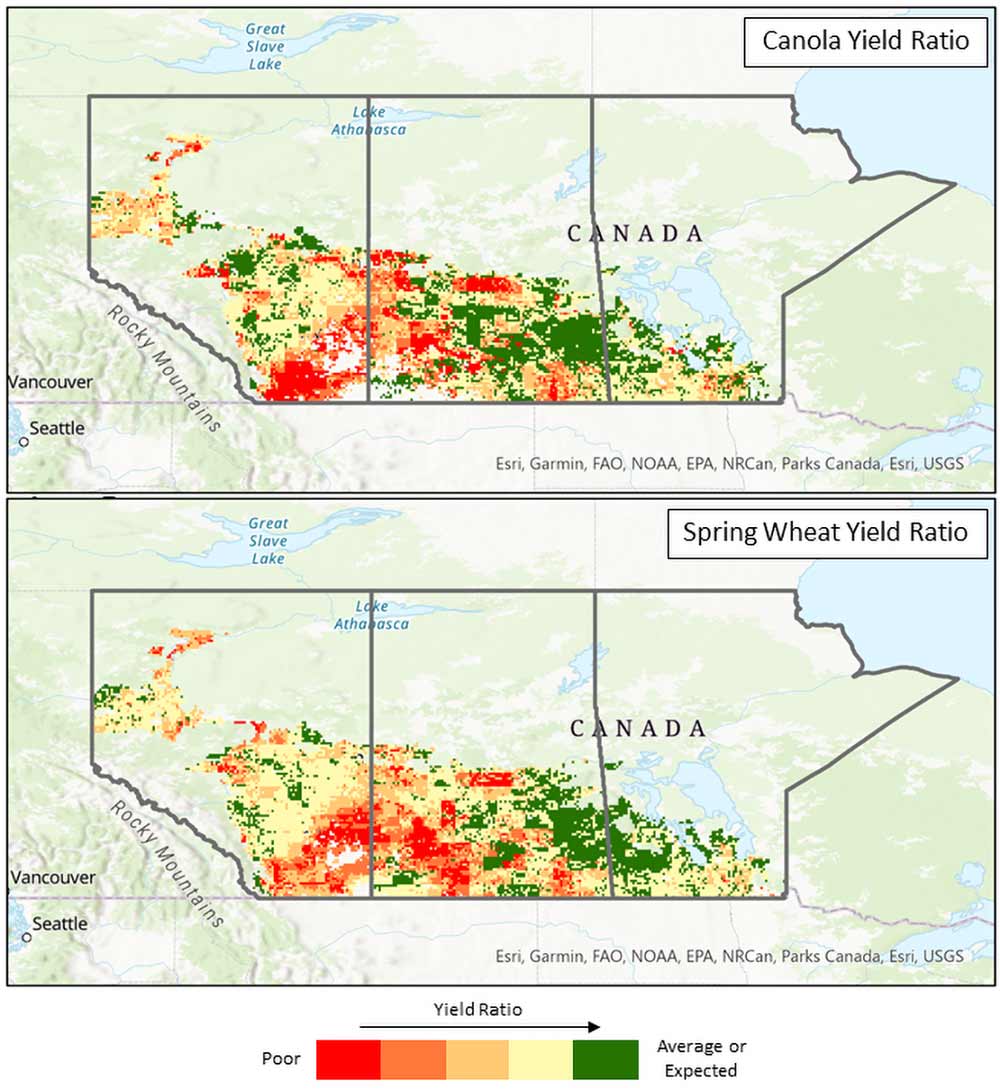
AIR’s estimated yield ratio maps for canola and spring wheat, using reported weather up to September 10, are shown in Figure 2. Yields are very low in the southern and eastern portions of Alberta and the western portion of Saskatchewan. Only in eastern Saskatchewan and western Manitoba do we see significant areas of normal yields.
Implications for Crop Insurance
Alberta’s Agriculture Financial Services Corporation (AFSC) has announced that they expect to pay out more than CAD 1 billion on CAD 600 million in premiums. According to the AIR MPCI Model for Canada, a loss ratio of 200% under current premium rates would correspond to an 18-year return period loss. By comparison, a recurrence of the weather during the major drought year of 2002 would have a return period of 128 years and correspond to a 360% loss ratio (under current premium rates and crop mix).
In recent years, premium rates in many of the provincial crop insurance programs have decreased as reserve funds have grown due to multiple years in which premiums exceeded claims. And in 2021 AFSC announced a 20% discount on premiums to be applied for 5 years. It remains to be seen—as the harvest proceeds in Canada and the full scope of losses becomes clearer—if premium rate decreases will be reassessed.
Maximize profit potential and make better decisions with AIR agricultural risk models and services