AIR is often asked where losses from extreme events fall on our exceedance probability (EP) curve. However, likening industry loss estimates to AIR’s published EP curve is not a valid comparison due to several differences in the way these estimates are calculated.
Given the severity of losses from wildfire over the last two years, this blog will provide an overview of how EP curves are computed using the AIR Wildfire Model for the United States. We will highlight discrepancies between AIR model output and industry loss estimates you may find through various media outlets following a major event.
Computing AIR’s U.S. Wildfire EP Curve
Let’s review how AIR’s published EP curve is computed.
First we run the stochastic (simulated) events in the U.S. wildfire model against exposures found in our industry exposure database, or IED. This database contains data on structures such as homes and commercial properties, their locations and attributes, and a set of assumed policy conditions throughout the model domain.
To conduct a valid comparison, therefore, we need to prepare data from an actual event to be analyzed in our model as if it were a stochastic event.
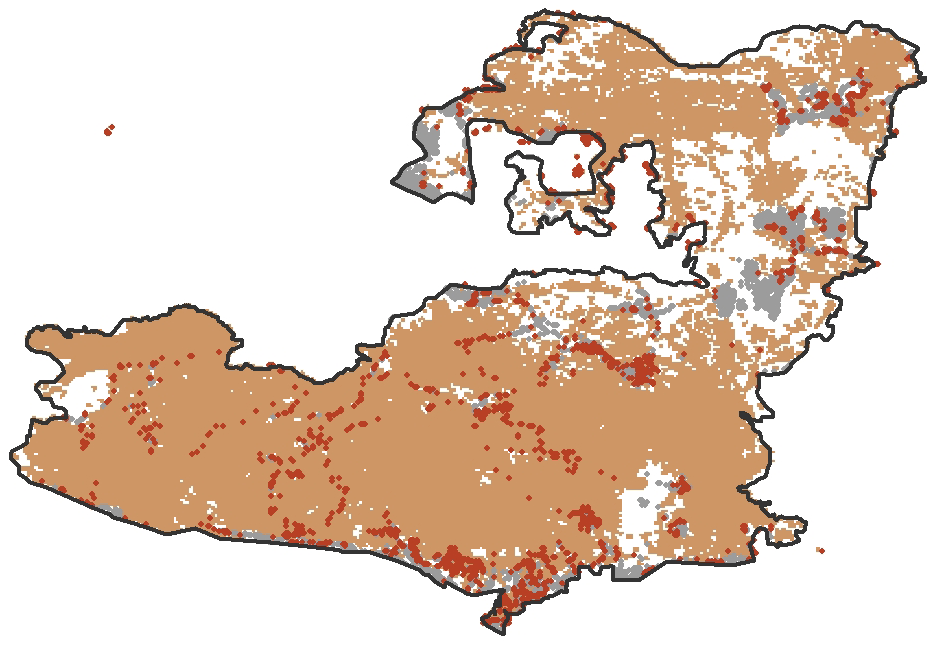
We begin with satellite imagery to identify only the impacted areas, otherwise known as the burn scar. As you can see from the Woolsey Fire example in Figure 1, there are white and gray areas within the perimeter that are not in the tan-shaded burn scar.

The physically based spread model in the AIR U.S. wildfire model considers and simulates real-world wildfire behavior; for example, it allows a wildfire to spread around certain areas, neighborhoods, or individual structures, without burning them. Information derived from AIR’s burn scar analyses validates well with this realistic fire behavior.
Once we have the burn scar, we can apply AIR’s damage functions to all the exposure within the model’s industry exposure database to determine event losses. This methodology is used to generate both the historical catalog in Touchstone® and for ALERT™ loss estimates.
Modeled vs. Industry Losses: What’s the Difference?
To draw a legitimate comparison between modeled and industry losses, we would therefore need to base industry losses for a given event on an identical set of assumptions that were used to compute the published EP curve.
Thus, there are several reasons why modeled losses differ from industry losses. For one, AIR’s industry exposure database does not account for certain policy conditions, such as guaranteed replacement cost—coverage that provides the full cost of replacing damaged property that has no limit and does not deduct for depreciation. Losses from mandatory evacuations and smoke damage outside the fire perimeter are also not considered by the model.
This means that to accurately place a recent event on AIR’s EP curve, you must use the values from AIR’s industry exposure database for exposures within the burn perimeter. For a more detailed assessment of risk for a given policy or portfolio, exposure data must reflect your detailed policy terms.
Changes in regulatory regimes are also not included in the model, and there have been recent regulatory adjustments that impact losses. For 2017 and 2018, the State of California has declared that claimants have two years and three years, respectively, to use their coverage D (loss of use coverage), whereas it would previously have only been one year. AIR is currently assessing the total impact of this change.
Recent U.S. Wildfires Are Not Tail Events
So where do the 2017 and 2018 wildfires sit on AIR’s EP curve?
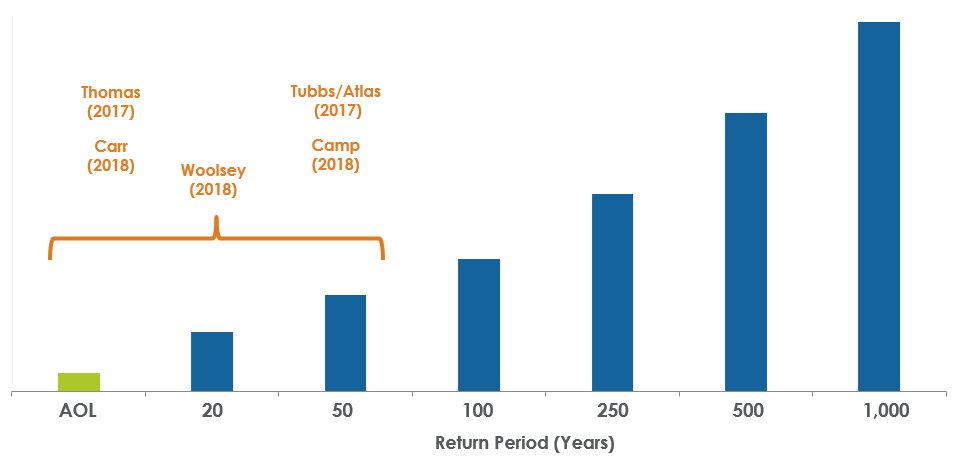
The Thomas (2017) and Carr (2018) fires sit at approximately the average occurrence loss (AOL), the Woolsey Fire (2018) is around the 10-year return period, and the Camp/Atlas (2017) and Tubbs (2018) fires are between 30- and 60-year return periods.

None of these recent U.S. wildfires, therefore, are considered tail events—rare events with high losses. Instead, these events have low return periods of less than 100 years, which reflects increasing U.S. wildfire risk, in large part due to development of the wildland-urban interface.
A probabilistic approach that considers today’s environment and conditions while realistically capturing the spread of fire to and through urban settings can help companies effectively manage their wildfire risk, especially when using detailed exposure data that reflects their own policies and portfolios.
Explore the AIR Wildfire Model for the United States


