


When a low-pressure system named “Bernd” parked itself over central Europe in mid-July 2021, it caused significant flooding in western Germany and neighboring countries. The German states of Rhineland-Palatinate and North Rhine-Westphalia were particularly hard hit, as were the Netherlands and Belgium.
The devastating flooding led to more than 180 deaths in Germany and caused catastrophic losses by disrupting properties and infrastructure. The event set new benchmarks for catastrophic losses in Europe and loss estimations continue to creep six months after the event with much of reconstruction work yet to be done. Estimates of insured loss by the insurance associations in Germany stand at roughly EUR 8.2 billion (USD 9.3 billion) as of mid-January 2022 and it is reasonable to assume that the economic losses may exceed EUR 35 billion (USD 40 billion).
Comprehensive Remodeling
As the event unfolded, Verisk scientists remodeled the event in our state-of-the-art flood models using a “bottom-up” approach, by simulating river flows in our hydrological and flood inundation patterns in our hydraulic model from observed precipitation fields. With the remodeled hazard and Verisk’s industry exposure database, we provided a range of insured loss estimates for the insurance and reinsurance market. As part of the ALERT event posting available to subscribers, we provided dedicated remodeling of the event together with flood inundation maps and additional shapefiles and a selection of five similar stochastic events.
Figure 1a presents the accumulated precipitation over two days on July 13–14, which was used to remodel the event. We analyzed hourly precipitation fields over Germany derived from NASA’s Global Precipitation Measurement (GPM) system during July 5–19. Daily observed rainfall data from more than 1,600 gauging stations, obtained from the Climate Data Center at Deutscher Wetterdienst (DWD), was also assimilated to improve the quality of the GPM precipitation input.
The observed precipitation fields were used in our hydrological model to generate flows for all the rivers captured in the Verisk model. In Figure 1b, the modeled river flow return periods are provided. Notably, some of the smaller tributaries to the Rhine, such as the Ahr and Erft, exceeded the 500-year flow return period.
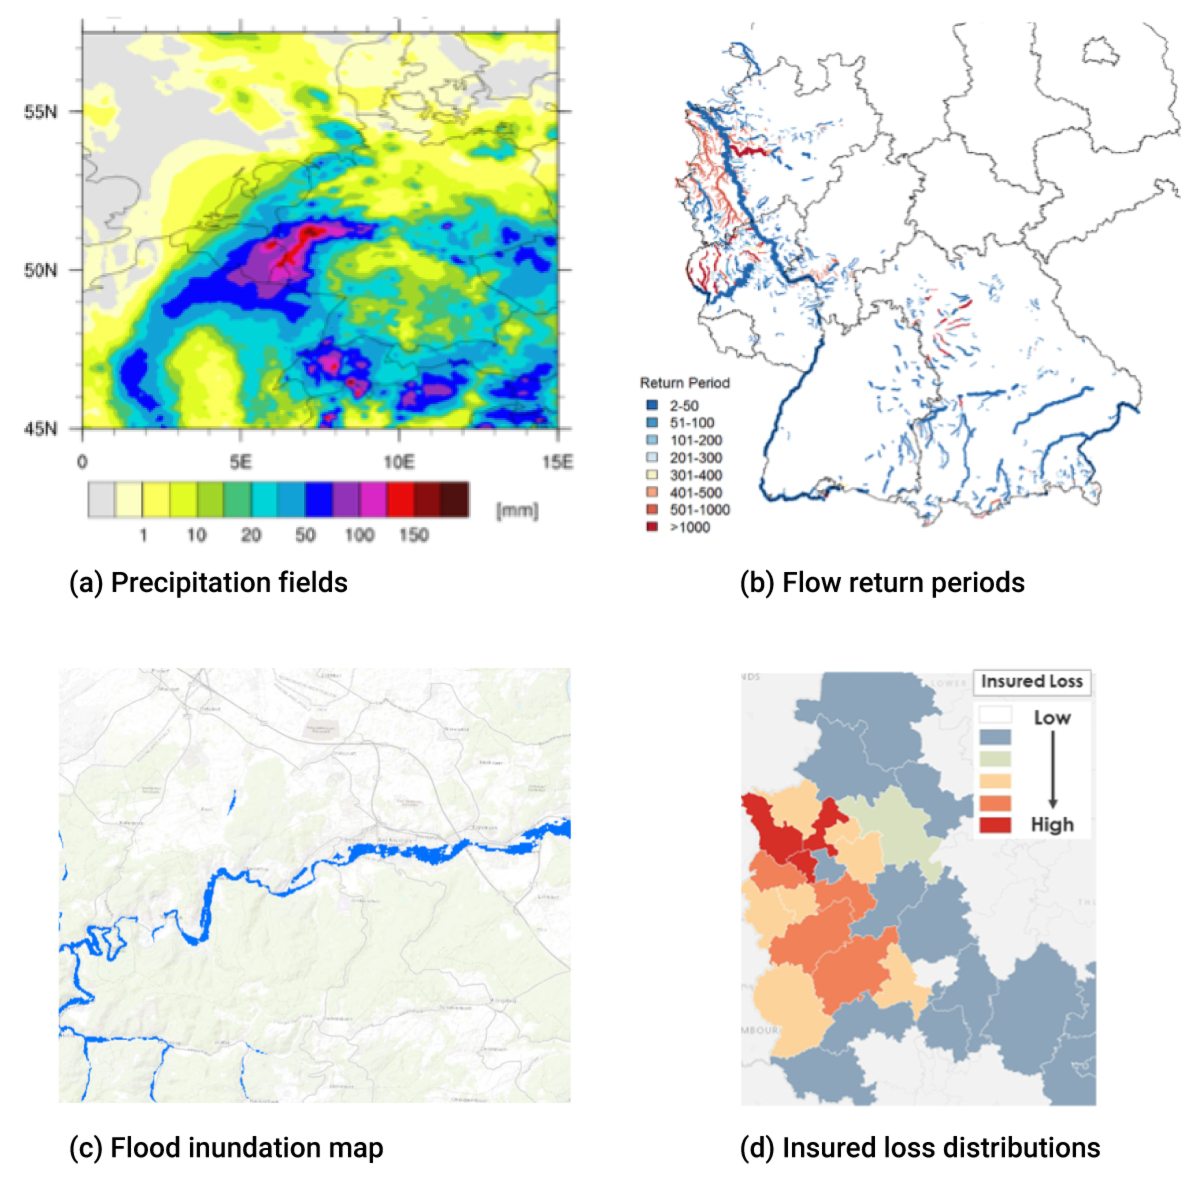
We also published flood footprints as shapefiles of the modeled event, (Figure 1c). Our first source of validation for the ALERT flood footprint event was from Copernicus Satellite images, where good alignment was observed for impacted communities. Especially in the heavily impacted Ahr region, ALERT shapefiles were compared with published flood maps from local authorities.
One important note, however, is that the flood depths published represent the hazard from the on-plain component of the model and do not show the off-plain component, which also plays an important role for exposure away from the floodplains and is included in the insured loss estimates.
For this event, a notably higher contribution of off-plain loss was modeled than for previous marquee events such as the 2002 or 2013 floods. Since the model also contains a significant number of events driven by the off-plain component, however, the split of on- and off-plain losses for the 2021 event is approximately on a par with Verisk’s average split for Germany across the 10,000-year stochastic catalog. The majority of damage was from the Ahr and Erft rivers, both of which are modeled hydraulically by Verisk’s on-plain component.
Finally, the insured loss distributions are calculated on our industry exposure database and displayed in Figure 1d at CRESTA level. The initial remodeling provided industry insured loss ranges and did not account for uncertainty factors such as demand surge, cost inflation, and infrastructure damage, which influence the loss estimations for this event, or non-modeled components such as debris flow and clogging of bridges that made the July 2021 event unique and added to the insured loss numbers.
Within two weeks of the event, model users could download these remodeled event sets into Touchstone and Touchstone Re and quickly come up with a range of loss estimates for their book of business.
Focusing on the Ahr and the Erft
As the floodwaters receded and cleanups began and claims were filed, Verisk researchers turned to the factors that contributed to this devastating event. Looking closely at the especially hard-hit Ahr and Erft valleys, we sought to understand what led to this “perfect storm” in these regions.
Soil and topographic features of the Ahr Valley make it more prone to flash flooding than surrounding areas. Steep slopes and poor moisture storage translate precipitation into overland flow quickly. These features can lead to flash flooding or floods when large volumes of water flow and accumulate quickly in downstream areas. When more flow occurs in a short amount of time, the hydrograph, or the plot of flow over time, becomes steep and sharp.
Verisk accounts for hydrological parameters that account for the “flashiness” of a flood wave, including maximum soil moisture storage, time to peak, channel length, slope, and roughness in our inland flood model. In the Ahr basin the unit catchment slopes and channel slopes are steeper, and the soil moisture capacity is lower, than in many of the surrounding drainage basins such as the Erft (Figure 2a and Table 1).
| Attributes | Ahr Drainage Basin | Erft Drainage Basin | Rhine Drainage Basin |
|---|---|---|---|
| Drainage Area (km2) | 914 | 2083 | 114,500 |
| Average Channel Slope | 0.015 | 0.005 | 0.009 |
| Average Catchment Slope | 0.17 | 0.033 | 0.10 |
| Average Stream Power (W) | 7,300 | 1,300 | 2,930 |
| Average Velocity (m/s) | 1.30 | 0.90 | 0.47 |
| Average Maximum Soil Moisture Capacity (mm) | 558 | 699 | 599 |
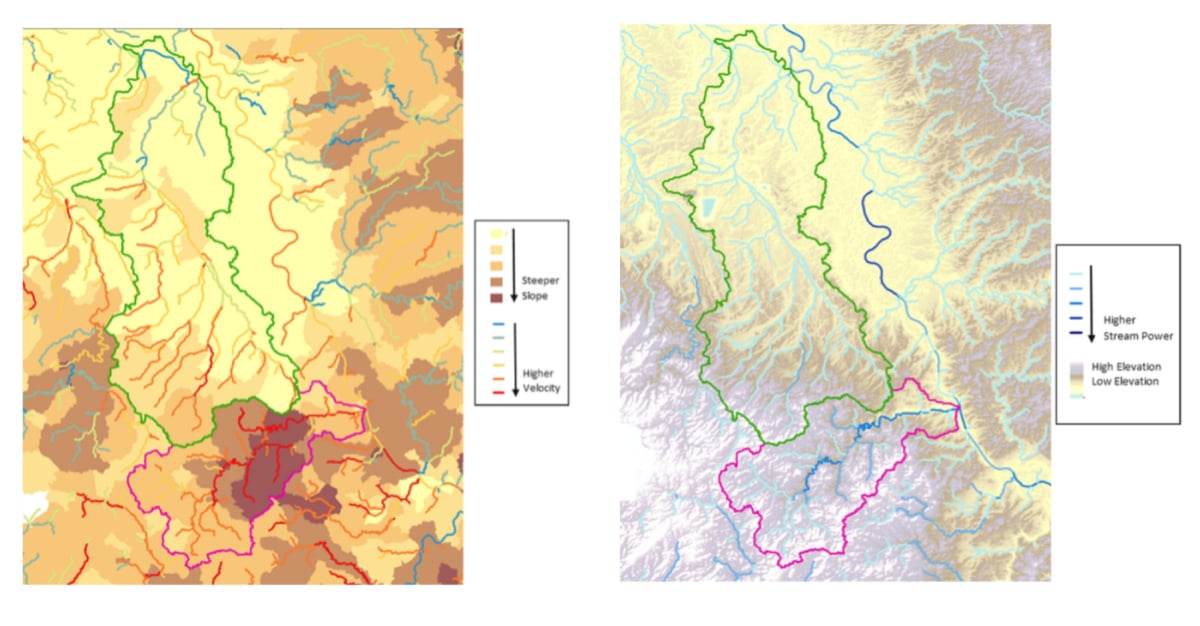
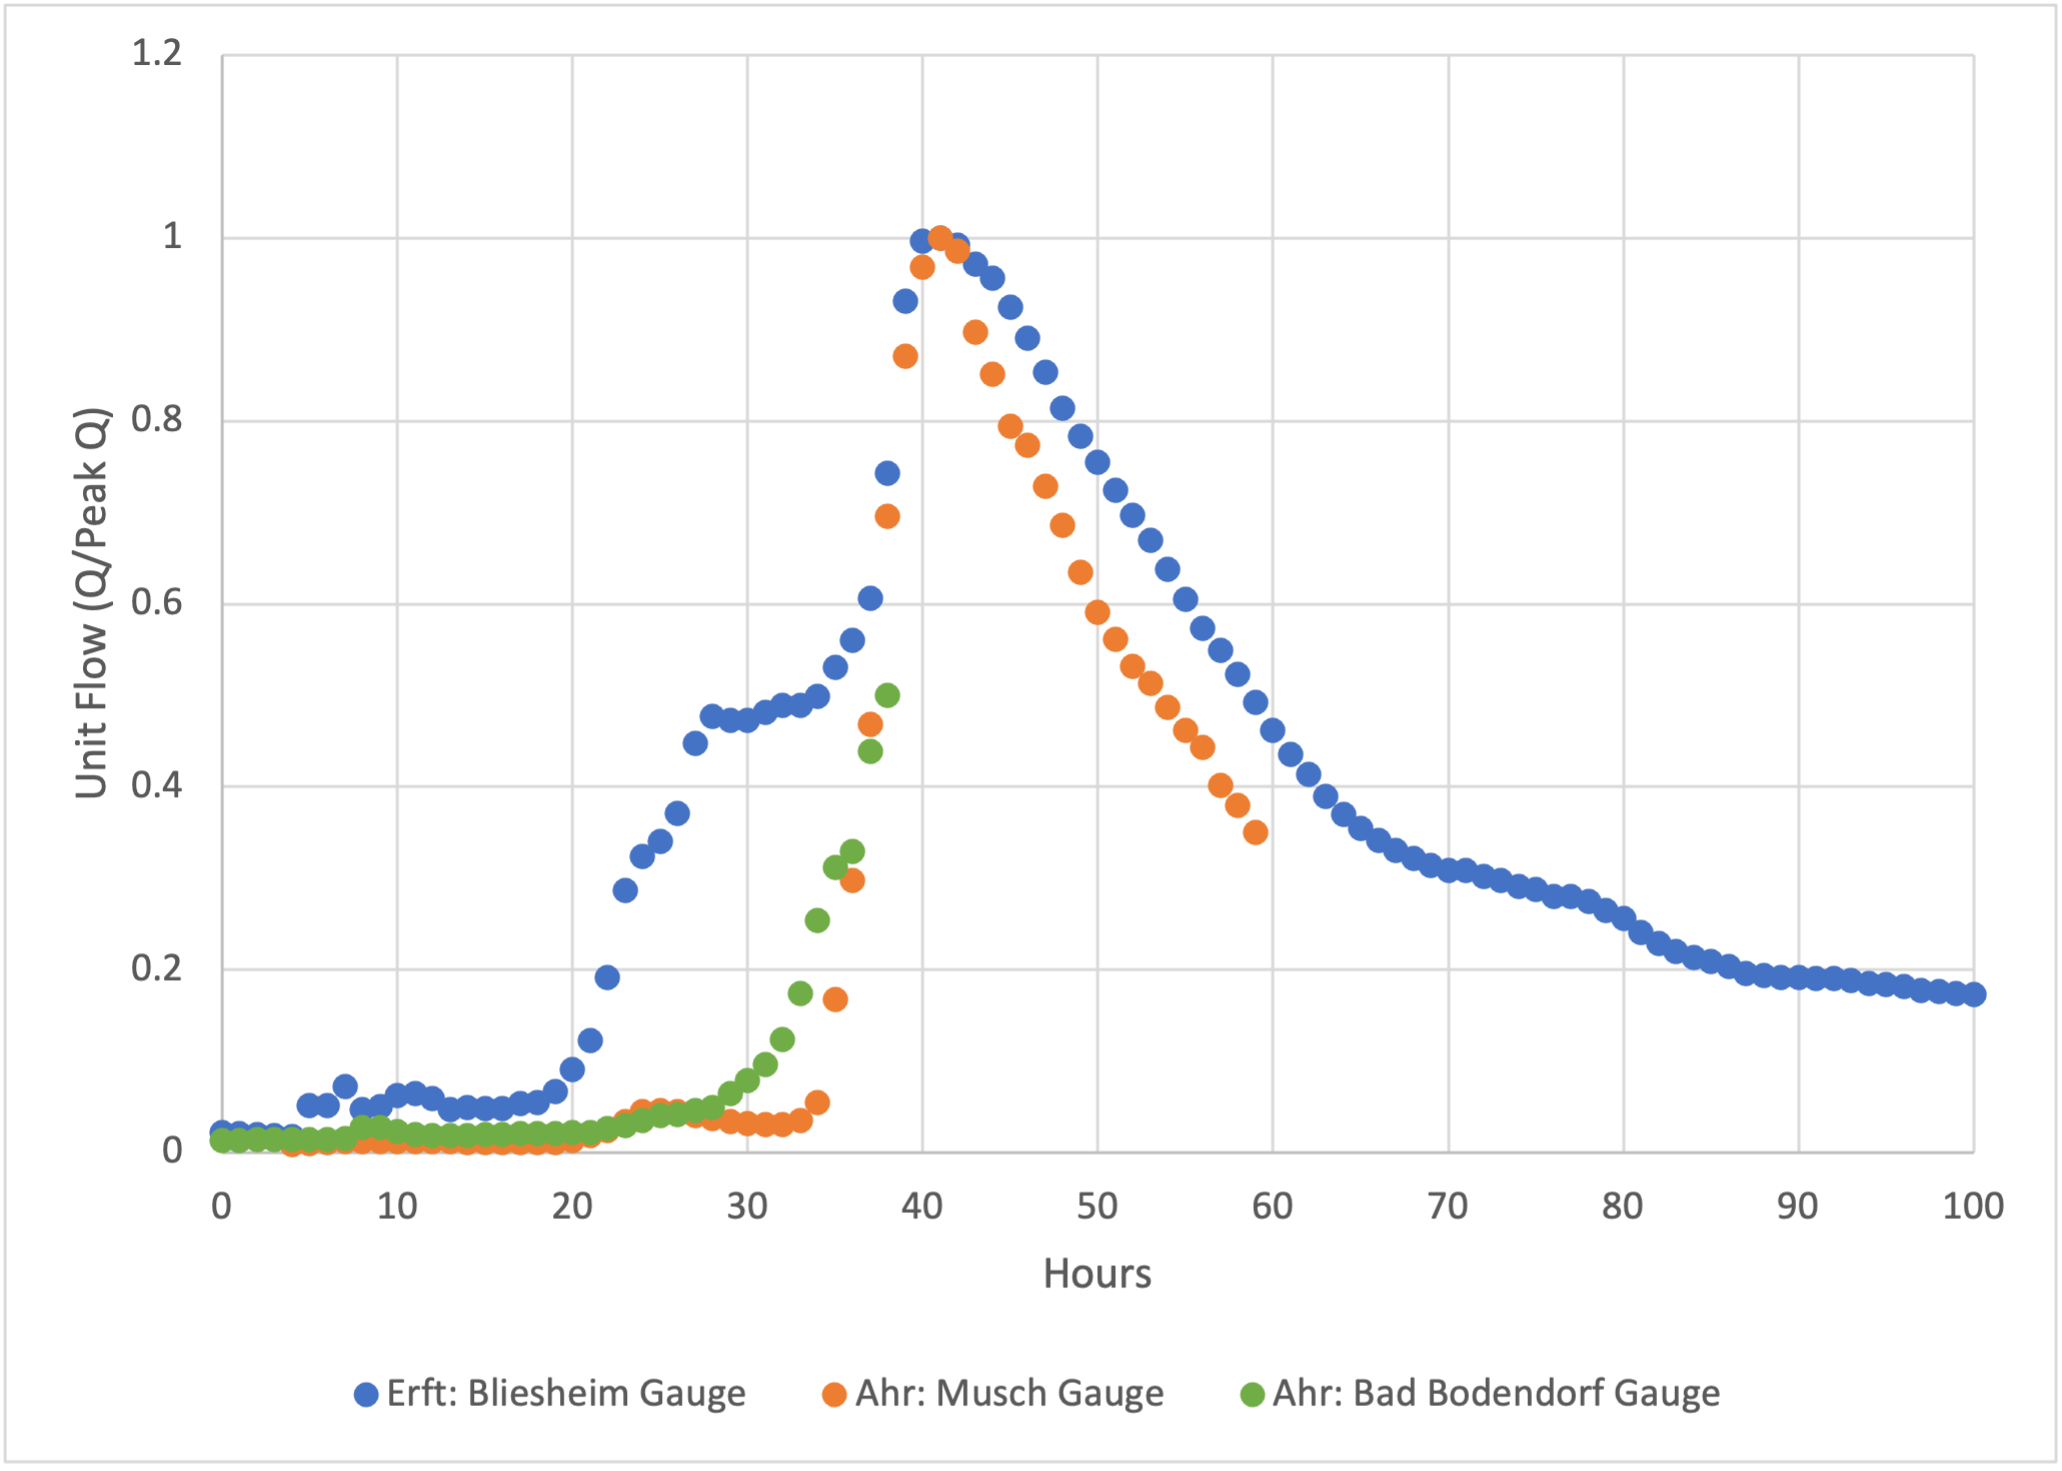
Figure 3 shows a comparison of scaled hydrographs for the event for gauges in the Ahr and Erft drainage basins. Because the two gauges farther downstream along the Ahr were destroyed by the event, the gauge at Musch is used, as it has a similar drainage area as the Bliesheim gauge on the Erft. The hydrograph for the Ahr gauge rises and falls much more quickly than the gauge on the Erft. This is indicative of the tendency for the Ahr to have “flashier” floods.
Another difference between flooding in the Ahr and Erft basins is stream power—the energy present within the flowing floodwaters. This energy translates into the force the water applies to the streambed and stream banks, and it drives erosion and debris transport. Steeper slopes and larger discharges lead to increased stream power. As the stream power increases, the quantity of sediment/debris that the flowing water can transport increases. The Ahr River had significantly more modeled stream power than the Erft River (Figure 2b). This is consistent with the large amount of observed erosion and deposition along the Ahr River.
The Bottom Line
The tragic July 2021 floods will provide learnings to improve how we handle and forecast floods in the future. We will continue to investigate the event and incorporate its learnings. Nonetheless, the research we have conducted on this event so far has provided a validation exercise, which confirms that Verisk’s inland flood models for central Europe produce a robust view of risk.
Quantify flood risk and uncover new opportunities with Verisk inland flood models.
