This year’s remarkable Atlantic hurricane season ends today! There were 17 named storms, 10 hurricanes, and 6 major storms—more hurricanes and major storms than even NOAA’s revised seasonal forecast anticipated. Many records were set, and the U.S. major hurricane drought ended. This year was the first on record in which the U.S. experienced three Category 4 or higher landfalls, and marked only the second time since 2007 that two Category 5 storms struck the country. It was one of only four Atlantic seasons known to have produced 10 tropical cyclones of hurricane strength in a row (Franklin to Ophelia)—half of which occurred in the spectacularly active month of September.
After Hurricane Harvey made landfall in Texas on August 26 and Irma struck Florida on September 10, Dr. Peter Sousounis and I blogged asking, “How often are there two U.S. major hurricanes in two weeks?” We studied the historical record and found that from 1950 to 2017, there were four years (1954, 2004, 2008, and 2017), based on the central pressure, when major hurricane landfalls occurred within a 15-day time window (approximately two weeks). With that in mind, one compelling question to ask is whether we see such major hurricane clustering in AIR’s stochastic catalog, and how often we see it.
One way to answer this question is to construct the distribution of consecutive major hurricanes from the stochastic catalog. This can be done via a statistical technique called bootstrapping. The 50,000-year stochastic catalog was used for this study. Here is a brief description of the method:
- Examine the catalog and determine whether each year, from Year 1 to Year 50,000, is a hit year (1) or a nonhit year (0). This becomes the base for the bootstrap sampling. A hit year is defined here as a year with at least one major landfalling hurricane cluster or at least two consecutive major hurricanes landfalling on the U.S. East Coast within a 15-day window.
- Choose arbitrarily the number of bootstrap samples—say 10,000—sufficient to construct the hurricane clustering distribution.
- Randomly select 10,000 years with replacement from Year 1 to Year 50,000.1
- From each chosen year, we construct a bootstrap sample starting from the chosen year to the chosen year plus 67 (equivalent to the length of the 1950–2017 historical record). Therefore, each of the 10,000 samples is composed of 68 consecutive years, equivalent to the length of the 1950–2017 historical record. For example, if Year 1 is randomly chosen, then data of Year 1 to Year 68 from step 1 would become a bootstrap sample. Similarly, if Year 2 is chosen, then data of Year 2 to Year 69 would be another bootstrap sample.
- For each bootstrap sample, count the number of hit years.
- Generate the frequency distribution from all 10,000 bootstrap samples.

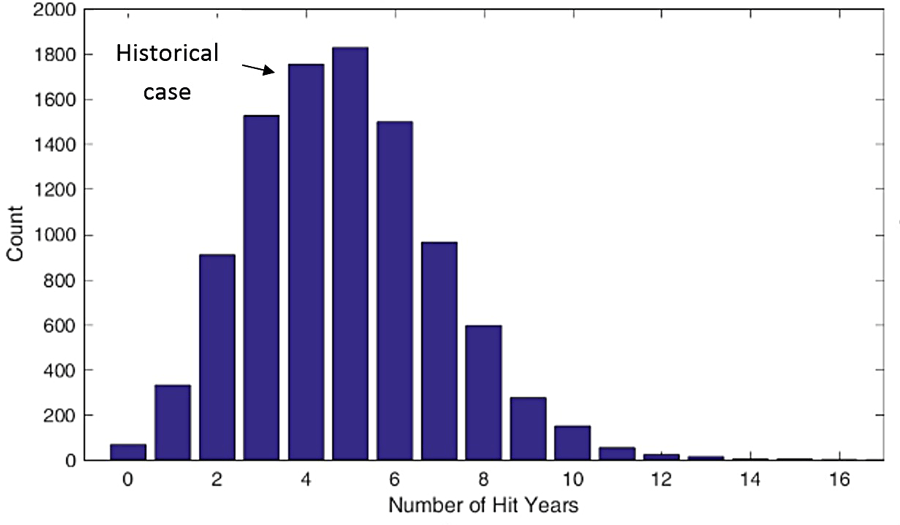
Figure 1 shows the frequency distribution from one bootstrapping exercise. This frequency distribution tells us that the number of years with consecutive major U.S. landfalling hurricanes can be as low as none to as high as more than 10 out of 68 years, but most frequently occurs at around 4 or 5 years. Therefore, what we see about the major hurricane clustering frequency is well within this frequency range. This is not unexpected because our stochastic catalog was built based on the historical record. This study demonstrates that the AIR stochastic catalog reasonably represents the historical hurricane record. I, for one, hope that it will be a long time before we experience back to back major hurricanes again!
1 In bootstrap sampling, sampling with replacement is a standard technique. For example, we might get more than one bootstrap sample that starts from Year 1, i.e., replicates are allowed. The underlying assumption is that each sample is independent from one another so the selection of the next sample is not affected by the selection of the previous sample. Another way of looking at it is to consider that we draw 10,000 numbers out of an urn that contains endless supply of 1, 2, ..., 50,000.


