


Perspectives

Advancing the Science of Risk Analysis
July 30, 2021
The pandemic has forced businesses and individuals to contend with a level of uncertainty that has had no precedent in modern history. An ongoing health crisis is compounded by immensely complex, globally interconnected economic effects large and small. While some of the individual impacts may have been foreseeable, and while we have recently experienced economic downturns, global supply chain disruptions, and outbreaks of epidemic disease (among countless other impacts), the scale and far-reaching implications of the COVID-19 pandemic are transforming how decision-makers deal with uncertainty.
For us as risk modelers, and for many of our clients in the insurance space and beyond, uncertainty has always been a definitive aspect of what we do. After all, the business of insurance is possible only with the existence of risk and uncertainty.  For several years now, we have been developing a new framework for capturing, calculating, and displaying uncertainty in the financial module of our models. AIR’s Next Generation Models (NGM) reflect a substantial investment in our commitment to helping our clients do their jobs better. It represents a foundational change in the architecture of our financial module to provide a more rigorous, flexible, and transparent framework for the treatment of uncertainty. NGM features a novel loss aggregation methodology that results in a more accurate view of risk compared to the previous generation loss engine, and provides the ability to accommodate a much wider range of complex policy terms. As we move into the initial full release of NGM, scheduled for 2022, I wanted to take some time to explore the motivation behind the significant changes and what they mean for the future of extreme event modeling.
A Historical Perspective on the Evolution of Modeling
AIR Worldwide pioneered the probabilistic catastrophe modeling framework in the late 1980s to provide an alternative to actuarial and “rule of thumb” approaches that were standard at the time. The introduction of the first U.S. hurricane model was met with skepticism. Several decades of low insured catastrophe losses had brought about a sense of complacency about the risk, and companies mostly relied on their historical claims experience to estimate potential losses. When Hurricane Andrew struck in 1992, the losses far exceeded expectations and shook the insurance industry to its core. This watershed moment transformed how companies managed risk; catastrophe modeling was here to stay.
The basic structure of catastrophe models has remained essentially unchanged, but the science of modeling has evolved from advances in technology and/or improved access to data, resulting in a reduction in or better characterization of uncertainty. One example on the technology side is the introduction of physical climate modeling to supplement statistical modeling for perils such as winter storms and floods. The ability to make use of large-scale global circulation models, which predict how the atmosphere will change over time using mathematical equations that govern fluid flow and thermodynamics, was possible only with increases in computing power by several orders of magnitude. Another example is the application of machine learning to a wide range of modeling challenges, including making the global circulation models fit for risk estimation purposes and using satellite imagery to enhance exposure data.
In parallel, modeling has also advanced throughout the years with access to ever larger data sets and/or efforts to improve the characterization of uncertainty. One example is the development of the Next Generation Attenuation (NGA) earthquake ground motion prediction equations, coordinated by the Pacific Earthquake Engineering Research Center and originally released in 2008. This groundbreaking project was made possible by the creation of a large, uniformly processed database of ground motion data and resulted in a suite of empirically derived equations that, when implemented in the AIR model, accounted for the uncertainty in knowledge of the underlying physical processes.  Another example is a comprehensive study that AIR undertook to detail the evolution of building code adoption and enforcement practices throughout the United States. By knowing what codes were likely enforced based on when a building was constructed, we could form a much more accurate view of potential losses from disasters.
Many such milestones have driven the evolution of the science and art of modeling throughout the past decades. With the launch of Touchstone® almost a decade ago, we envisioned a flexible, powerful, and future-ready platform to help our clients make better informed risk management decisions. Touchstone’s financial loss module, however, was largely inherited from the previous generation of modeling software. While the initial releases of the platform focused on improving software capabilities and the user experience, our researchers have been working behind the scenes for the past several years on thoroughly rearchitecting Touchstone’s financial loss module. Similar to many past major modeling advancements, AIR’s Next Generation Models are enabled by technological advances necessary to run computationally intensive calculations as well as access to large sets of previously unavailable data. One of the most notable achievements in NGM is the improved estimation and propagation of uncertainty in financial loss calculations.
Why Does Uncertainty Matter?
Models, which are mathematical representations of complex real-world phenomena, are inherently uncertain. Broadly speaking, uncertainty in modeling can be categorized as primary—which reflects uncertainty in the size, intensity, and location of potential events—and secondary—which reflects uncertainty in everything downstream of the model catalog in AIR’s modeling framework (read Modeling Fundamentals: Understanding Uncertainty to learn more). For any given event, there is a range of possible outcomes in local intensity, damage, and loss, which is why these terms are expressed using probability distributions instead of as single numbers.
Catastrophe modelers have created a rigorous discipline around capturing and propagating uncertainty in the hazard and engineering components of models. What culminates from this process is a probabilistic distribution of damage ratios that captures the uncertainty that’s upstream in the modeling workflow. But what model users ultimately care the most about is the loss output, and we’ve historically spent much less time discussing how uncertainty is propagated within the financial module. Likewise, our model users frequently request detailed validation on our hazard and engineering components, but rarely is the financial module questioned. To be sure, Touchstone’s existing financial engine is powerful and efficient, and its treatment of uncertainty has been well established and carefully validated. Its main shortcomings, which we’ve understood for some time, are in its ability to reflect certain complex policy terms that have been increasingly in use, lack of flexibility in the order in which terms are applied, and inability to spatially correlate losses when convolving distributions.
The Fundamentals of Correlation, and What’s Different in NGM
The question of how to propagate uncertainty in the financial module is really a matter of how to realistically accumulate losses as one considers different units of risk—a single site, locations within a policy, policies within a portfolio—across different perspectives of loss and different combinations of perils, all the while considering layers, limits, and other policy conditions. Keeping in mind that losses for each view of risk are not point estimates but probability distributions, the problem becomes how to properly combine distributions as one moves to aggregated risk perspectives of various tiers.
We know intuitively when we observe damage patterns in the aftermath of a disaster that losses are spatially correlated. A building in close proximity to one damaged by an earthquake is much likelier to also be damaged than one that’s a few towns away. At the same time, there is considerable variability, as we often see an unscathed building right next to one that is destroyed. The manifestation of spatial correlation in losses can vary based on peril (for example, the spatial correlation pattern for an earthquake event will be significantly different from that of flood).
Touchstone’s existing methodology convolves loss distributions using a numerical approach, which can mathematically propagate uncertainty as losses are accumulated but is unable to account for the spatial correlations in losses. A fundamental shift in NGM is the introduction of new algorithms for loss aggregation that explicitly capture peril-dependent spatial correlations as well as the correlation between coverages (building and contents, for example). The development, validation, and calibration of these algorithms was made possible in close partnership with our clients, who have given us access to vast amounts of claims data from historical events. Detailed and accurate claims data have only been more widely available in recent years as the industry began to prioritize data quality. We are also taking advantage of increased processing power and optimization techniques in order to run the sophisticated and computationally intensive algorithms. I encourage you to read this article for a more detailed discussion of the motivation and methodology behind NGM’s new loss aggregation algorithms.
The Benefits of NGM and What’s Next
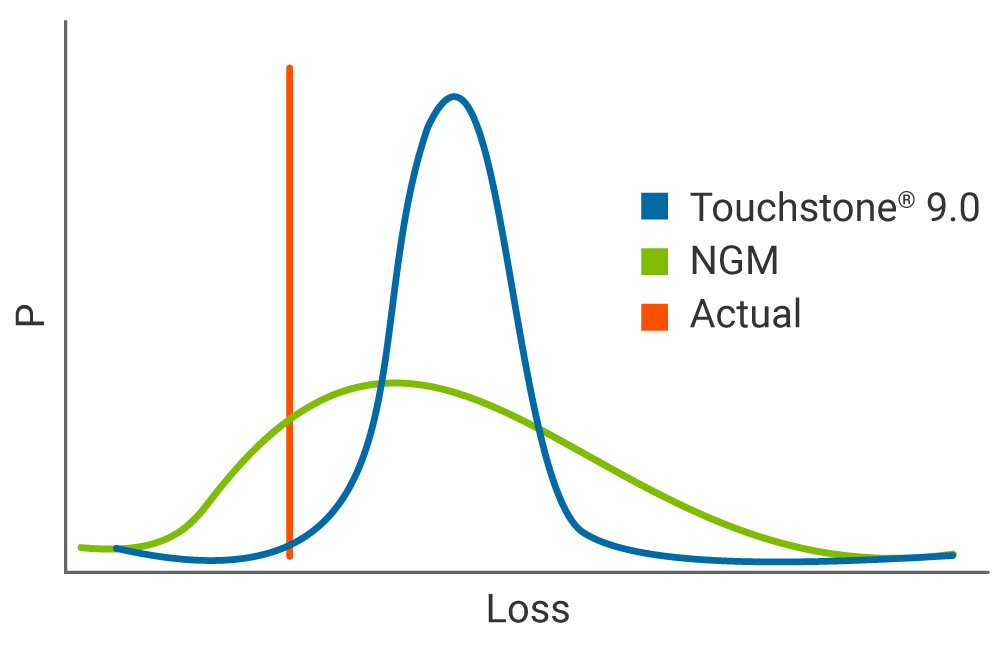
At a very high level, NGM’s enhanced loss aggregation methodology enables a more accurate view of risk, at every tier of aggregation beginning with a single risk at a single location. Compared to the existing loss engine, the implementation of spatial correlation in NGM results in a wider distribution of losses with a fatter right tail. In the stylized representation of a historical loss validation below, the narrower distribution from the current aggregation methodology implies a higher level of precision in losses than could actually be achieved. The NGM distribution better reflects the inherent uncertainty and is more likely to capture the actual loss (shown in red).
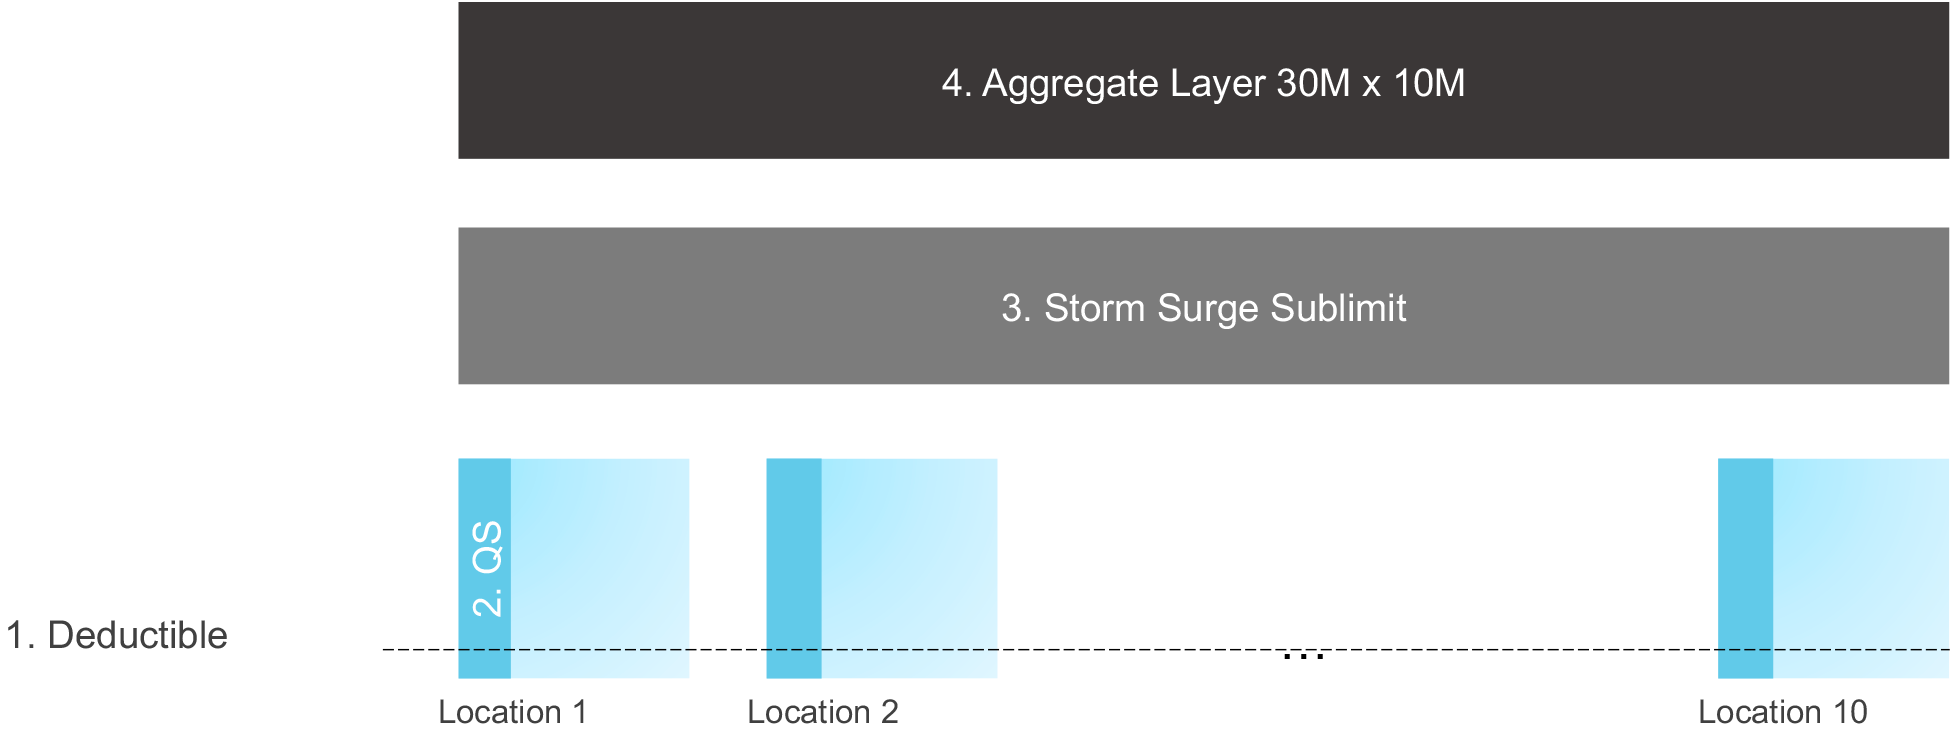
The completely rearchitected loss engine also allows for a much higher degree of realism in how insurance terms are applied at each aggregation tier, reflecting actuarial principles and actual market practices. NGM results in a much more accurate computation of gross, reinsurance, and net losses. To show a hypothetical example, consider the case of a commercial policy with 10 locations, each of which has a 20% quota share treaty. The policy has a USD 20 million storm surge sublimit, and an aggregate policy layer of USD 30 million in excess of USD 10 million. In the current loss engine, location-level treaties cannot be applied in policies with layers (the quota share would need to be applied at the policy layer as a way of approximation), sub-peril-specific sublimits are not possible, and aggregate policy layers cannot be modeled (would have to be treated as an occurrence layer). NGM, in contrast, can account for these terms and apply them in the correct order. After ground-up losses are computed, the deductible and quota share are applied at the location level, followed by the storm surge sublimit, and finally the aggregate layer.
Understanding, characterizing, and communicating uncertainty will only become more important as we continue to move toward more robust solvency reporting requirements and changing industry regulations regarding climate change. The initial release of our new framework, available now as a technical preview for a limited subset of models and due for full release next year, is just the beginning in our longer-term vision for advancing the science of risk analysis and as such, changes in loss results due to NGM should be viewed as a model change, similar to when we introduce new science in other components of our models. I’ve attempted to provide a historical perspective on why we’re introducing NGM and a very generalized view of the high-level benefits. For a fuller and more detailed exploration of upcoming changes, please visit the NGM page on our website, where we will continue to share articles, presentations, and documentation in the coming months.

Jayanta Guin
EVP and Chief Research Officer
AIR Worldwide
