Modeling Business Interruption Losses
Dec 17, 2008
Editor’s Note: For major events, business interruption (BI) losses can account for a significant proportion of total commercial losses. Historically, catastrophe models estimated Business Interruption (BI) losses based primarily on repair time estimates for different degrees of building damage and the assumption that at low to moderate building damage levels, most businesses remain in operation without incurring any significant BI. This assumption resulted in significant underestimation of BI losses. AIR's approach, as explained in this article by AIR Project Manager Dr. Vineet Jain, accounts not only for building damage—or direct BI—but also for BI from indirect sources, such as losses stemming from actions taken by civil authorities, loss of business income from dependent properties, and utility service interruption.
 by Dr. Vineet Kumar Jain
Introduction
Most insured losses caused by natural disasters come from property damage: damage to structures and their contents. Losses from the interruption of business activities, however, can make up a significant portion of total insured losses. Hurricane Katrina, for example, caused about $25 billion in insured commercial losses, of which six to nine billion dollars has been attributed to business interruption, “BI.” For certain businesses, such as chemical plants and off-shore oil and gas platforms, BI risk can be significantly higher than risk to property. Additionally, there is evidence that BI, not property damage, can be the most important variable in the survival of a business—or a community—after a natural disaster.
Traditionally, losses attributable to BI have been estimated by trying to determine how long it would take to repair whatever degree of damage a property sustained. In turn, it was assumed that at low to moderate damage levels most businesses remain operating and therefore don’t incur any significant BI (and its attendant costs). Estimating Business Interruption losses in this way, however, results in a significant underestimation. Recent analysis of claims data by AIR confirms that building damage alone cannot explain total BI losses.
The modeling of lost business income to achieve reliable estimates of probable BI loss must consist of more than simulating property damage. As described below, it also must take into account the range of decisions open to business owners. Capturing the uncertainty involved in allowing for human choice makes the construction of an effective BI loss model especially challenging.
Downtime
The central variable in estimating Business Interruption losses is “downtime.” Downtime, however, can be variously interpreted or defined, and often is subject to complex policy conditions designed to limit BI insured losses. In general, and as used here, downtime is understood as the number of days it takes before a business can return to full operation following a catastrophe event.
The causes of downtime fall into two categories: direct BI, and indirect BI. In the case of direct BI there is physical damage to an insured structure that causes a suspension of business activities—and loss of business income because of the suspension. Indirect BI can result from a wide range of circumstances, and can occur including when there is no physical damage to an insured structure. Examples include instances when a place of business may not be accessible because a curfew has been imposed; or when a supplier of a necessary business input is itself experiencing business interruption; when there are extensive electrical or water or other public utility failures; or when an entire area has been evacuated of its residents (and presumably also a business’s workforce).1
Factors Affecting Downtime
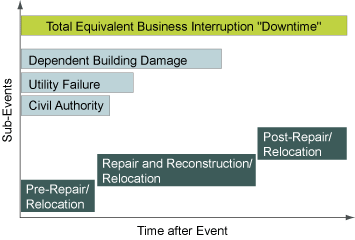
The key variable, downtime, can be divided into three stages: 1) Pre-Repair/Relocation; 2) Repair and Reconstruction/ Relocation; and 3) Post-Repair/Relocation. The pre-repair stage includes the time it takes to assess damage, obtain building permits, find and engage contractors, and so on. Some businesses may choose to relocate rather than wait for repairs; but relocation itself takes time and incurs its own costs. Some businesses may be able to conduct some level of their normal operations while repairs are underway. Even after repairs are completed, business income probably will not immediately resume at pre-disaster levels as it may take some time to regain the earlier market share. Similarly, it can take time to rebuild a labor force that may have been dislocated. All of these contingencies impact the duration of downtime.
Each of the downtime stages is affected by additional factors. Repair will be affected by the level of damage sustained, the size of the structure to be repaired, and the structure’s architectural complexity (a small church may take longer to repair than a large Wal-Mart facility). Similarly, the contents of an auto assembly plant are more difficult—time-consuming—to replace than the more generic contents of an office building.
In addition to such structural/building characteristics, the specific characteristics of a business also affect downtime. Every business will have its own degree of resiliency in response to a disaster, even while different kinds of businesses have different intrinsic resiliencies. One business office, for example, may well choose a more effective path to recovery than another. However, a business office can relocate relatively easily without suffering significant business implications. A hotel cannot.
Figure 1 below lays out the different stages that make up downtime and indicates how additional contributing factors function along parallel timelines. As such, they cannot legitimately be just added together. For example, the “Civil Authority” factor (which includes such contingencies as the imposition of a curfew) may restrict the access of customers to a business for some period of time and also delay or prolong repair activities. However, Civil Authority time cannot be added to Building Repair time in estimating overall BI downtime.

Figure 1: Components of Business Interruption Downtime
Decision Tree of a Business Owner
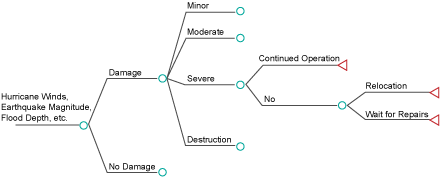
These complexities in the determination of total BI downtime are further complicated by the decisions a business owner makes. A decision tree, as shown in Figure 2 below, lays out a formulation of the decisions an owner must make under conditions of uncertainty. (For the sake of simplicity, the example in Figure 2 is for a business having no dependent businesses—that is, no businesses upon which it is significantly dependent for either production inputs or sales.) Estimates of the downtime associated with each individual possible pathway in the decision tree, together with estimates of the likelihood of that pathway being followed, can be used to compute the mean and the probability distribution of total downtime.

Figure 2: Business Owner’s Decision Tree
Since the occurrence of the initiating event, its associated hazard, and the damage experienced at the specific business location are random variables (in a model simulation), the paths taken need to be sampled many times to generate a full probability distribution for BI downtime.
While the example illustrated in Figure 2 represents, as noted, a business not dependent on either suppliers or retailers, many businesses are more complex. Examples of downtime calculation for both cases are discussed in further detail below.
BI for Businesses with No Dependents
A business with no dependent businesses is defined, as stated above, as one that is not significantly dependent on other businesses for input to production and/or sales. Examples include retail sales and personal and repair services. In this case, the causes of BI are chiefly two: physical damage to its own property, and “Lifeline Disruption,” disruptions in civil authority and/or utilities.
Total downtime for businesses with no dependent businesses can be determined using:
Total Downtime = Max {(Pre-repair +Repair time) Or (Relocation time) Or (Continued Operation time), Time for restoration of Lifelines} + Time to regain pre-event market share
Here the first term represents the time it takes a business to return to full technical operation after a disruption. The “Max” operation is employed in the equation under the assumption that the modeled business won’t be able to operate without the restoration of its lifelines (as above, the return to effective civil authority and its attendant services). The second term accounts for the losses attributable to loss of market share once the business is back in operation.
Of course, the values the different time components acquire are a function of the level of building damage, building characteristics, the nature of the business, and local and regional economic changes after a catastrophe event.
BI for Businesses Having Dependents
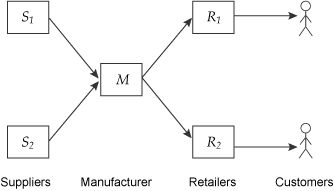
Businesses that are dependent on other businesses are common in the manufacturing sector. A business that has dependent businesses is referred to here as the Principal Business; and businesses on which the Principle Business is dependent are referred to as Dependent Businesses. To simplify the Modeling exercise, it is assumed here that Principal Business M needs only two inputs, A and B, from retailers S1 and S2 in order to produce one unit of its product, C. C is delivered to market equally by two distributors, D1 and D2, as shown in Figure 3 below.

Figure 3: A Supply Chain System for Business M
In addition to being dependent on lifelines, Principal Business M is dependent on four businesses in the supply chain network. Assuming that the supply chain has no resiliency—that no inventory buildup or export is possible and no alternate supplier is available—an x% daily reduction of input from any of the suppliers leads to x% daily reduction in output for the Principal Business.
With respect to demand, an x% reduction from a Retailer leads to x/2% reduction for the Principal Business, M. Assuming that business income is constant over time, x% daily reduction can be expressed equivalently as a Business Interruption of x/100 days. The Business Interruption for this business at “day t“ (or other time unit) of the disruption can be expressed as follows:
Downtime at Day t = Max {Or [IF Fail (S1), IF Fail (S2)], IF Fail (M), [0.5 IF Fail (D1) + 0.5 IF Fail (D2)]}
Total downtime for M, the Principal Business, can be estimated by integrating the downtime as estimated above over the maximum downtime associated with any business in the supply chain network.
Conclusion
The interruption of business after a natural disaster can be a source of significant loss. A modeling framework that incorporates the procedures outlined above can take into account both building characteristics and business characteristics in estimating BI downtime, allows the development of separate downtime functions for different types of businesses (occupancies), and can capture the probable effect on downtime of the range of decisions open to business owners. Within this framework it is possible to simulate patterns of BI downtime over the full spectrum of property damage as observed in the actual data.
It should be acknowledged that detailed BI policy conditions and property characteristics are often not available to the user for input into a catastrophe model. For example, information on whether a policy includes coverage for dependent building(s) damage, their locations, and the degree of dependency between locations is generally not available. However, the methodology set forth in this article does not require any additional input from the user, but instead employs certain logical assumptions about occupancy and the characteristics of “typical” BI policies to model total BI losses for any given occupancy and the variation in BI losses across different occupancies.
1 As discussed in this article, Business Interruption at a location can occur for a variety of reasons. What compensation is recoverable from insurance coverage depends upon policy conditions. Direct BI is covered under many standard policies. Indirect BI generally is available by endorsement for an extra premium.
