


Preview of the 2021 Atlantic Hurricane Season
Jun 16, 2021
The 2020 Atlantic hurricane season surpassed all expectations, setting several records. There were twice as many tropical cyclones as the 30-year average; by the end of the season, 30 named storms had formed, 13 of which reached hurricane strength, and of those, seven became major hurricanes (Category 3 or higher). A record 12 named storms in 2020 made landfall in the United States; eight struck the Gulf Coast, five of them in Louisiana alone. Six hurricanes made landfall along the Gulf Coast, half of them in the Pelican State. Only one other year on record (1995) saw as many as the 10 rapidly intensifying storms we saw in 2020. Will the 2021 Atlantic hurricane season be as active as last year’s?
Changes for this Atlantic Hurricane Season: Earlier NHC Outlooks, Updated 30-Year Average, No More Greek Letters
For six consecutive years Atlantic hurricane activity began prior to the official start of the season on June 1. Last year was also the third in a row to see a storm reach hurricane status in July—we more often see the first hurricane of the year in August. Because of this recent early Atlantic tropical cyclone activity, the National Hurricane Center (NHC) decided to issue its tropical weather outlooks starting May 15 and the World Meteorological Organization (WMO) seriously contemplated whether the official start to the season should be moved earlier as well. It appears the NHC was onto something with their earlier start, as this year already saw its first named storm when Ana formed in the Atlantic on May 22. (The East Pacific also saw an early first named storm when Andreas formed on May 9.)
The National Oceanic Atmospheric Administration (NOAA) has also made some updates, namely to what constitutes an average season, which is based on the 30-year average and updated every 10 years. For the period spanning 1981–2010, the climatological average for Atlantic hurricane season activity was 12 named storms, six hurricanes, and three major hurricanes. NOAA’s updated climatological average is based on activity from 1991 to 2020 and increases the average number of named storms and major hurricanes by almost 20%. The new climatological average, effective for 2021, is 14 named storms, seven hurricanes, and three major hurricanes.
Because 2020 produced so many named storms and activity started early, all the official storm names the WMO chose for last year had been used by September 18—which is around the middle of the Atlantic hurricane season. After September 18, Greek letters were used to name nine storms; the only other year that the WMO had to resort to using Greek letters for storm names was 2005 for six storms. Toward the end of the 2020 season and deeper into the Greek alphabet, three storms in quick succession—Zeta, Eta, and Theta—sounded very similar, which caused confusion because these storms were very different. Hurricane Zeta made landfall in Cocodrie, Louisiana, on October 28 as a Category 2 hurricane; Hurricane Eta made landfall less than a week later just south of Puerto Cabezas, Nicaragua, as a Category 4 hurricane on November 3; and Tropical Storm Theta formed the next week and was short-lived and weak, never making landfall. Due to the confusion caused when communicating about these storms and the fact that Greek letter–named storms cannot be retired more than once, the WMO decided to do away with the practice starting this year. Instead, a supplemental list of storm names is available if the formal list that is cycled through every six years is exhausted.
Climate Change and Hurricane Activity
The recent increases in storm counts and earlier starts to Atlantic hurricane activity have brought changing climate to the forefront of discussions about this year’s season. Research has been published over the last few years indicating that hurricanes are becoming wetter and moving more slowly, thus exacerbating inland flooding, as well as weakening more slowly, leading to larger wind speed damage footprints. Because of their slow forward movement, storms such as hurricanes Harvey and Florence in 2017 and 2018, respectively, and Tropical Storm Imelda in 2019, brought record hurricane-induced precipitation to impacted areas for much longer than historical averages would have suggested. Hurricane flood risk is also heightened by rising sea levels that exacerbate storm surge, as indicated by AIR’s recent research study on the impact of climate change on U.S. hurricane risk, conducted in collaboration with the Brookings Institution and AXIS. Our analysis also shows that an increase in the frequency of the strongest storms further elevates hurricane risk. As one step in helping our clients understand the potential impacts of climate change on U.S. hurricanes in the future, AIR’s Climate Change Practice developed the Miami Hurricane Climate Change Event Set, a set of 81 plausible scenarios by perturbing the parameters of a hurricane similar to Hurricane Andrew in ways consistent with the effects of a changing climate.
Main Factors that Influence Hurricane Development
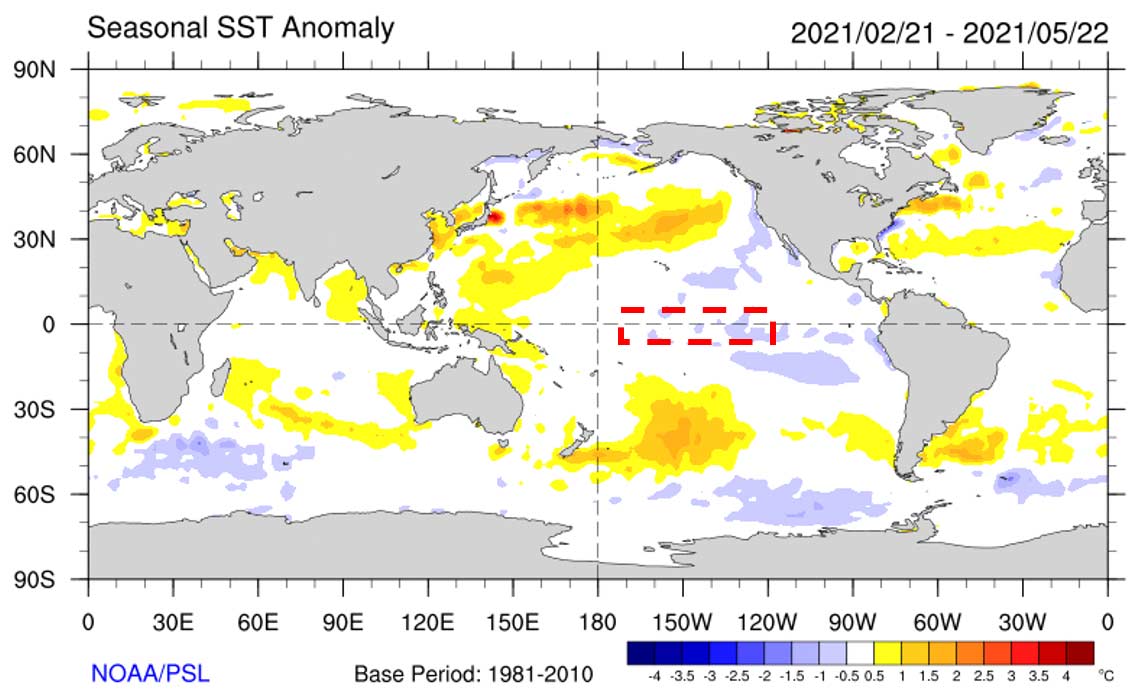
A number of factors influence Atlantic hurricane activity, including sea surface temperatures, wind shear, and vertical instability. These are affected by El Niño/La Niña-Southern Oscillation (ENSO)—a periodic fluctuation of SSTs and air pressure in the equatorial Pacific Ocean. Part of what drove 2020 hurricane activity in the Atlantic basin was a moderate La Niña—the cooler of ENSO’s phases. La Niña is associated with cooler sea surface temperatures (SSTs) in the eastern or central Pacific, which enhances convection across the Atlantic and creates favorable conditions for cyclogenesis. La Niña conditions are an enhancement of neutral ENSO conditions, both of which allow for above-average Atlantic hurricane activity. We are currently in a neutral phase, which is measured by examining SST anomalies in the Niño 3.4 region, which spans latitudes 5°S–5°N and longitudes 170–120°W (Figure 1). Forecasts indicate that neutral conditions are expected to persist throughout this year’s Atlantic hurricane season (Figure 2).
 Eric Uhlhorn, Ph.D.
Principal Scientist
Edited by Rachel Wisch, CEEM
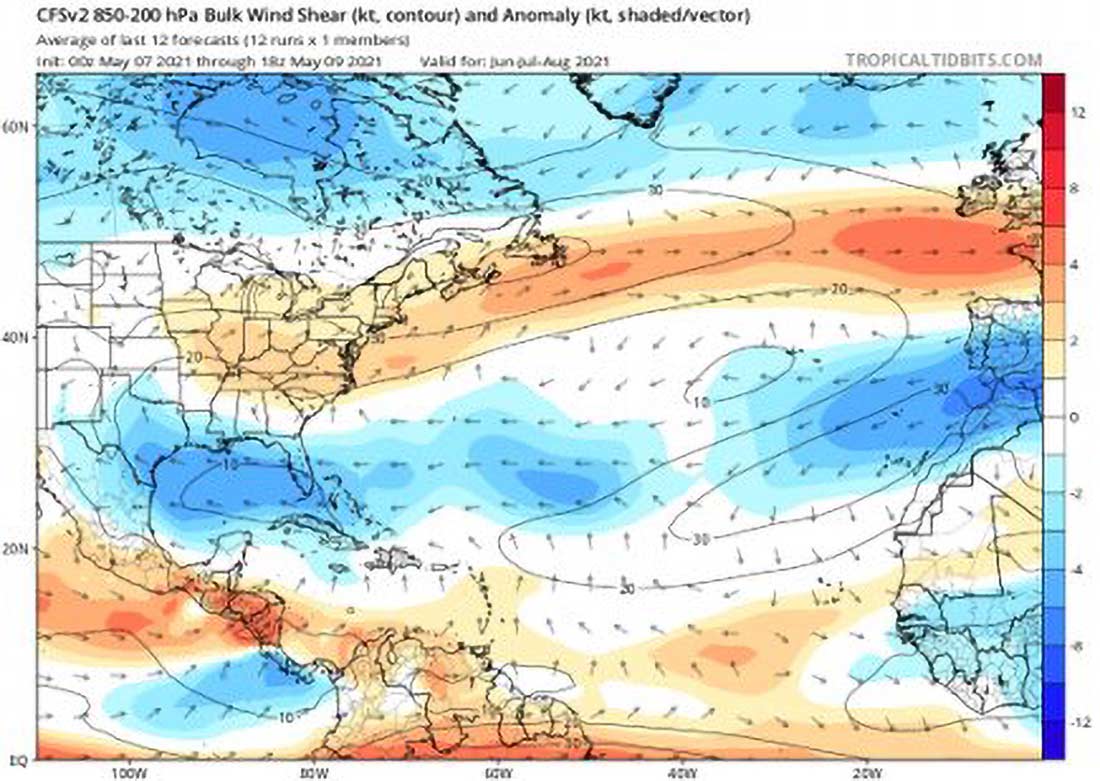
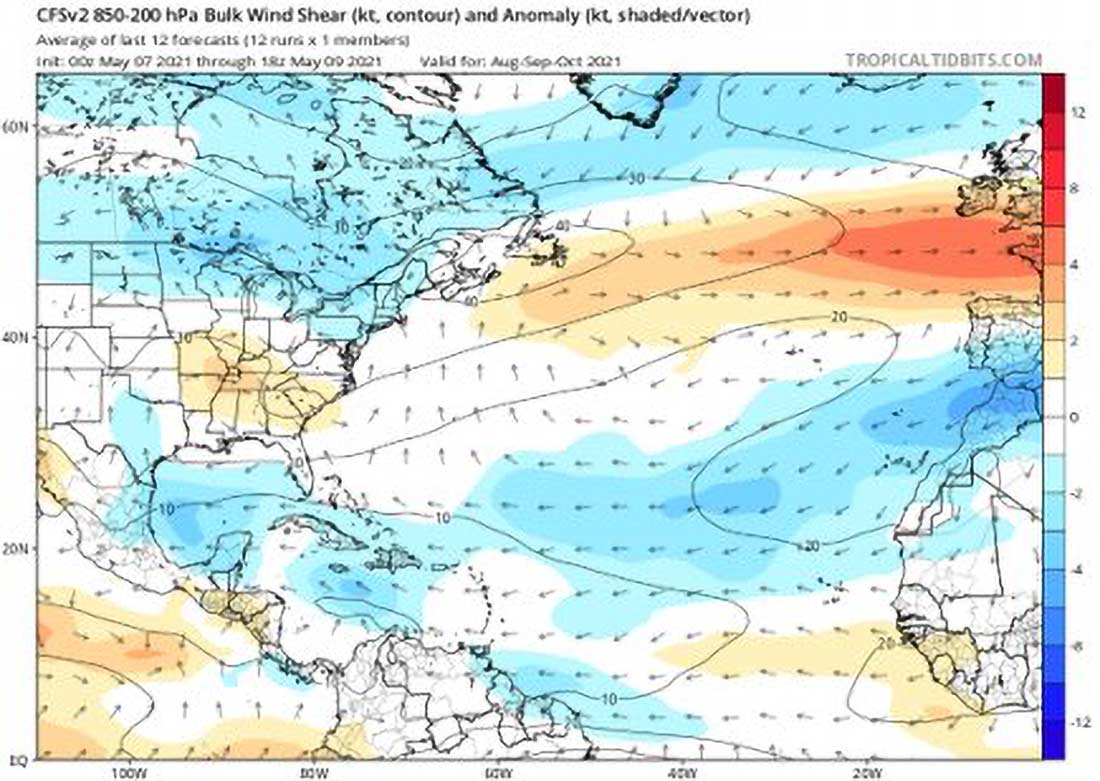
During a neutral ENSO phase, minimal wind shear should also be present across the Atlantic, which aligns with current forecast data (Figure 3).
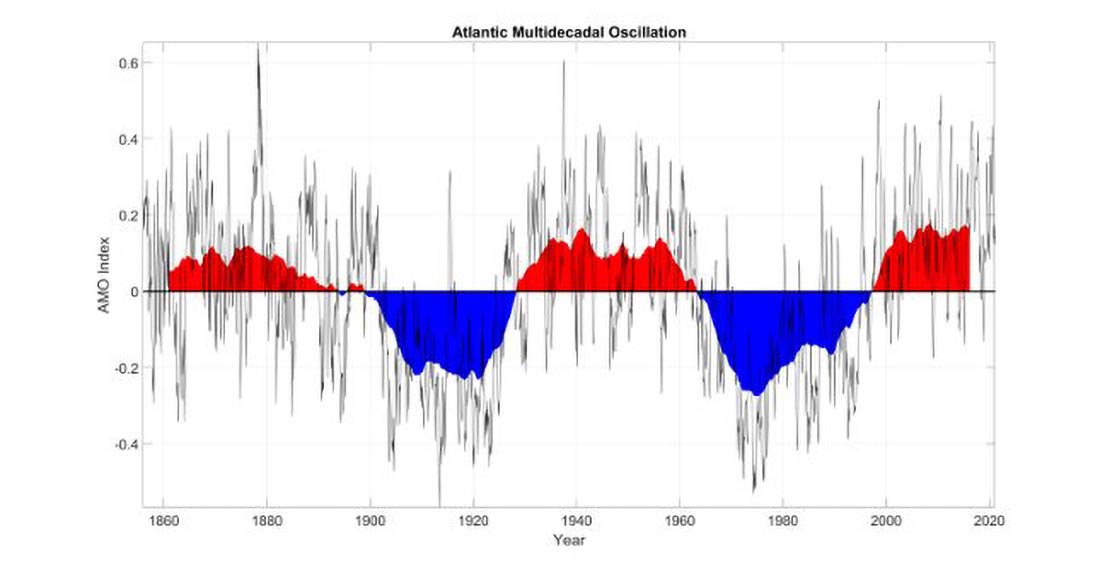
The strength of SST anomalies is measured by the Atlantic Multidecadal Oscillation (AMO)—a natural variability of SST and sea-level pressure fields in the North Atlantic. Where ENSO shifts pattern every three to seven years, the AMO shifts pattern every 20 to 30 years. In contrast to ENSO, warm AMO periods tend to have warmer SSTs in the North Atlantic and correlate with increased tropical cyclone frequency in the Atlantic basin. The current warm AMO pattern has persisted since the mid-1990s and remains above average, suggesting elevated seasonal activity (Figure 4). What drives the AMO and how it affects SSTs, and even its existence, have been the topics of recent research and require further study.
Sub-Seasonal Factors of Interest
While ENSO and the AMO have years-long patterns, other indicators fluctuate more frequently, such as the North Atlantic Oscillation (NAO), the Madden-Julian Oscillation (MJO), and the Saharan Air Layer (SAL). The NAO is based on the difference in sea-level pressure between the Icelandic Low and the Azores High, with positive phases associated with storms that track closer to the East Coast and negative phases associated with storms that recurve prior to reaching the coast. The NAO can shift annually and seasonally and is only predictable about two weeks in advance.
The MJO also has very short lead times for forecasts of only two to three weeks. This eastward-moving disturbance of clouds, rainfall, winds, and pressure in the tropics circumnavigates the globe in just 30 to 60 days. Periods of enhanced upper level divergence and precipitation from the MJO are correlated with increased tropical cyclogenesis, but its short cycle makes using it for tropical cyclone seasonal forecasts inherently uncertain.
Cycling even faster is the SAL, a very hot, dry layer of air laden with dust that forms from spring to early fall and moves out over the cool, moist surface air of the tropical North Atlantic Ocean every three to five days. The SAL can impact Atlantic hurricane activity by reducing atmospheric instability, increasing vertical wind shear, and blocking radiation that can elevate SSTs. This signal, too, poses challenges in terms of hurricane season forecasts due to its fast cycle time.
Pre-Season Forecasts
So, what can we expect for the 2021 Atlantic hurricane season? Pre-season forecasts consider everything discussed thus far to formulate best guesses of potential activity in the basin for the season. It is important to note, however, that pre-season forecasts are really just that—best guesses—as the atmosphere-ocean system is highly complex and it is extremely difficult to predict far in advance how the various indicators will play out and interact. It is because of this that some forecasting bodies issue updates throughout the season. For now, though, the main pre-season forecasts suggest above-average activity when compared to the climatological average (Table 1).
| Source | Named Storms | Hurricanes | Major Hurricanes |
| NOAA | 13–20 | 6–10 | 3–5 |
| University College London | 17 | 8 | 3 |
| Colorado State University | 17 | 8 | 4 |
| The Weather Company | 18 | 8 | 3 |
| North Carolina State University | 15–18 | 7–9 | 2–3 |
| AccuWeather | 16–20 | 7–10 | 3–5 |
| Climatological Average (NOAA) | 14 | 7 | 3 |
Additional Considerations: Recent Increases in Materials and Repair Costs
According to AIR and Xactware® analyses, materials costs have gone up significantly in the past year and especially in this last quarter from supply chain disruption in the construction market. Repair costs have also gone up significantly in the last two months. These increases are outside the scope of demand surge, which tries to answer the cost increase question from a post–extreme event perspective. Companies should bear these pre–hurricane season increases in mind. Please read our blog post for the detailed analysis of the situation as it stands today.
Managing Your Atlantic Hurricane Risk
What the 2021 Atlantic hurricane season will bring remains to be seen, and it’s important to remember that multiple factors can drive losses. While last year’s hurricane season broke many records, the storms that occurred were accounted for in the stochastic catalog of the AIR Hurricane Model for the United States. It’s also important to note that hurricane season forecasts are inherently uncertain, thanks to the many variables that influence hurricane activity, with last season being a prime example. In addition, whether an active or relatively quiet season will result in catastrophic losses for the (re)insurance industry is even more difficult to predict.
On the one hand, even record-breaking levels of activity in the North Atlantic Basin do not necessarily correspond to major losses in the United States, as was the case in 2020. On the other hand, one landfalling hurricane, such as Andrew or Katrina, can cause damage catastrophic enough to dwarf the losses of another year’s entire season. And a relatively quiet season with a series of tropical storms and lesser hurricanes (including bypassing systems) can have just as much of a cumulative impact as one or two major hurricanes. Using a probabilistic model that incorporates a complete range of physically possible storms can prepare you for what the 2021 Atlantic hurricane season could bring.
