


After Tohoku, AIR’s View of Hazard from Megathrust Earthquakes and Insights into Vulnerability to Tsunami
Feb 17, 2021
Editor's Note: AIR plans to release a substantially updated earthquake model for Japan this summer. This article is the second of three in our series on managing Japan earthquake risk; it describes how the M9.0 Tohoku earthquake informed our view of hazard from megathrust earthquakes in Japan and how we are updating the vulnerability component of our model. The first article in the series provided a detailed discussion on the time-dependent rupture probability forecasting of large earthquakes on the Nankai Trough and faults in Japan and explained why the updated AIR Earthquake Model for Japan incorporates HERP’s view of seismic risk in some cases and diverges in others. The third article will describe our updates to modeling tsunami risk. (All magnitudes in this article are expressed in moment magnitude.)
The authors would like to gratefully acknowledge the contributions of their colleagues, Ankit Dubey, Ph.D., and Farid Khosravikia, Ph.D., Yue-Jun Yin, Ph.D., to this article.
Ten years ago, on March 11, the M9.0 Tohoku-oki earthquake struck Japan. This megathrust earthquake ruptured part of the subduction interface near the Japan Trench, where the Pacific Plate dives underneath the Eurasian Plate. According to the Japan Reconstruction Agency, more than 120,000 buildings were destroyed, 278,000 were half-damaged and 726,000 were partially damaged; the direct financial damage from the disaster was estimated to be about USD 199 billion (~JPY 16.9 trillion), according to the Japanese government. The World Bank projected that the total economic cost could reach USD 235 billion, making it the costliest natural disaster ever recorded.
Japan is one of the most seismically active regions in the world. Despite the country’s complex tectonic setting being among the most studied, the M9.0 Tohoku quake was unexpected in the region from a historical perspective. Tohoku was not only the first subduction earthquake exceeding M8.5 in the Japan Trench since 1900, but it was also the largest earthquake to strike Japan since record-keeping began in the 1600s. Across the dense regional instrumental network, more than 1,000 strong ground-motion recordings of Tohoku provided a rare opportunity to study source processes and ground motion characteristics of a megathrust subduction earthquake in great detail. In this article, we discuss what we have learned from the observations of the Tohoku earthquake both in terms of magnitude and ground motion shaking intensity and how our perspectives on hazard and risk analysis from megathrust earthquakes in Japan have changed as a result. We also discuss how damage observations and claims data after Tohoku as well as changes to design and construction practice have informed our view of vulnerability.
The Past Was Not Prologue: Limited Historical Data and Unforeseen Seismic Risk in Japan
As discussed in Part I of this series, the main reason for the unforeseen risk from a megathrust earthquake along the Japan Trench is that prior to the 2011 Tohoku earthquake, the seismic hazard models developed by Japan’s Headquarters for Earthquake Research Promotion (HERP) had relied heavily on historical seismicity. As a result, the view of fault segmentation, characteristic earthquake magnitude, recurrence rate, and cascading ruptures were all based mostly on historical data. The Tohoku earthquake, however, clearly proved that the dearth of mega earthquakes in the past was not a reliable indicator of future seismic activity; limited historical data had led to an underestimation of hazard. In addition to the Japan Trench, subduction zones along the Nankai Trough and the Kurile Trench have the potential to produce megathrust earthquakes. It is therefore crucial to examine and include paleoseismic and paleotsunami data (geological and tsunami-related evidence of prehistoric large and mega magnitude earthquakes) and geodetic data (GPS measurements of crustal deformation along fault zones) when modeling large and mega earthquakes on subduction zones.
In the past decade, AIR seismologists, HERP, and many other members of the scientific community have undertaken a broad range of studies to better understand regional seismotectonics in Japan. Since 2011, HERP has made several key updates to their model, including: (1) a higher rate of seismicity for inter- as well as intra-slab earthquakes for all subduction zones; and (2) a down-dip extension of rupture interface with higher upper bound magnitudes (as high as M9.2) for megathrust earthquakes along the Nankai Trough and Kurile Trench. These updates significantly increase hazard along the eastern coast of Japan.
 Feng Wang, Ph.D.
Principal Scientist and Manager
 Arash Nasseri, Ph.D.
Principal Engineer and Senior Manager
Edited by Sara Gambrill, CEEM
Tohoku Informs View of Global Seismic Risk
The Tohoku earthquake not only informed the view of risk associated with megathrust earthquakes in Japan but also globally, e.g., the Hikurangi subduction zone in New Zealand and the Lesser Antilles subduction zone in the Caribbean, where, with limited historical data, the possibility of mega (M9.0 or larger) earthquakes cannot be ruled out. The updated AIR Earthquake Model for Japan incorporates the latest HERP 2019 time-dependent model along all subduction zones and the potential for megathrust earthquakes along the Nankai Trough and Kurile Trench.
Accounting for Ground Motions of Megathrust Earthquakes
When considering the possibility of megathrust earthquakes in Japan, it is critical to have a realistic understanding of the ground motion they create, which could significantly impact buildings and infrastructure. Along with this realistic understanding, it is important to have comprehensive forecasting tools for estimating the ground motions of earthquakes of different magnitudes occurring in different tectonic environments. The ground motion prediction equations (GMPEs) in AIR’s updated model have been developed using ground motion recordings from regional and global earthquakes. Although most modern GMPEs are complex and comprehensive, their forecasting capabilities heavily depend on the range of the ground motion data covered in the database used in developing them. Most regional ground motion databases include intermediate and even large magnitude earthquakes; however, because of the scarcity of great and mega (M9.0 and larger) earthquakes, all GMPEs suffer from the lack of ground motion data for these types of earthquakes.
Insights into GMPEs After Tohoku: Magnitude Saturation and New Magnitude Scaling
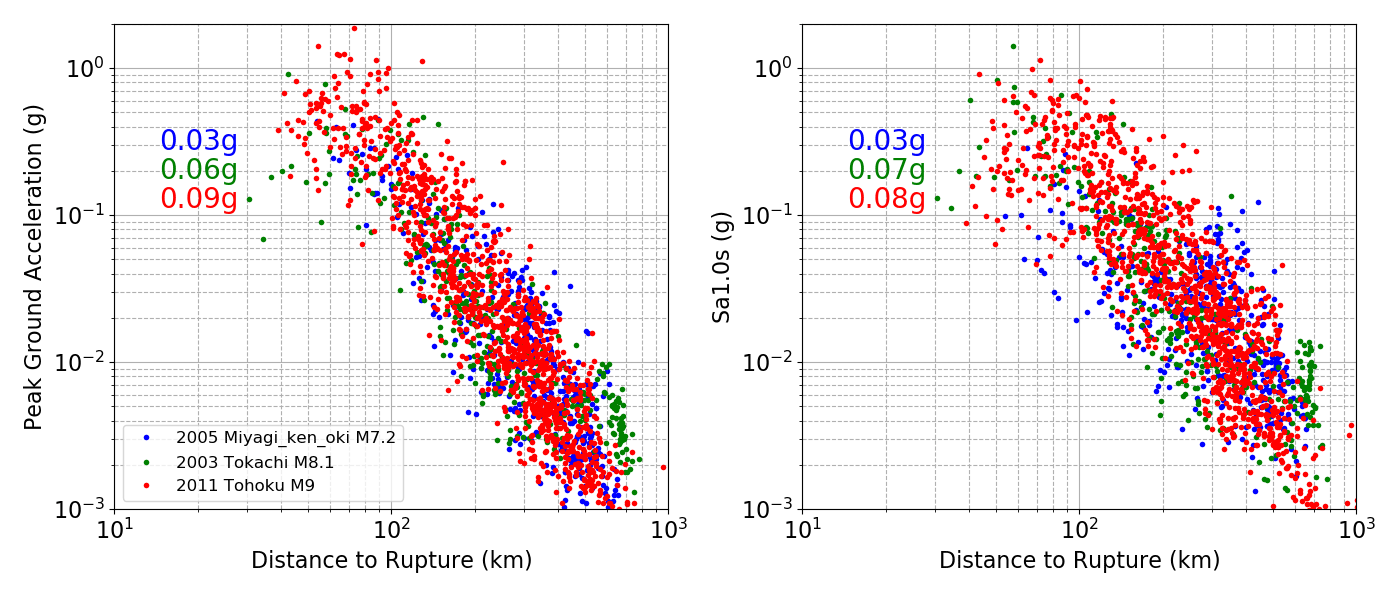
Before Tohoku, GMPEs developed for interface earthquakes in Japan used only data from earthquakes of magnitudes less than Mw 8.5 (e.g., Takahashi et al. 2004, Kanno et al. 2006, and Zhao et al. 2006) due to the lack of ground motion observations for larger magnitude quakes. Modelers used these GMPEs to estimate ground motion for not only large but also megathrust quakes by extrapolating these equations. This led to the exponential increase of ground motion with magnitude for mega earthquakes. There was no data before 2011 to verify how ground motion increased with magnitudes from large to mega earthquakes. By comparing Tohoku ground motion data with that of smaller magnitude interface earthquakes in Japan (2003 Tokachi M8.1 and 2005 Miyagi-ken-oki M7.2), however, it is clear that the increase of both short- and long-period ground motions saturates at larger magnitudes (Figure 1). After Tohoku, the challenge has become constraining the ground motion-to-magnitude scaling for mega earthquakes.
Such saturation of magnitude scaling for long-period ground motion was also seen in limited ground motion recordings of the M8.8 Maule, Chile, earthquake, in 2010 and finite fault numerical ground motion simulations (Gregor et al. 2002). Most recently Wirth et al. (2020) simulated an ensembled ShakeMap for the M9.0 Cascadia megathrust earthquake, using a broadband simulation and GMPEs. Their new simulation also agrees well with both the observed ground motion records during the M8.8 Maule and M9.0 Tohoku earthquakes (Frankel et al 2018; Wirth et al 2020). One possible explanation for the saturation is the lower energy ratio between long-period waves and total radiated energy (Zhao et al. 2011 and Stewart et al. 2013). In addition to the new magnitude scaling for megathrust earthquakes, rupture heterogeneity—populated by patches of high-slip asperities—initiated strong high-frequency radiation of seismic energy (Koper et al. 2011 and Ye et al. 2018), leading to strong short-period ground motions at locations in eastern Japan (Goto and Morikawa 2012). Furthermore, there are many active volcanoes in eastern Japan due to subducting slabs, leading to the volcanic path effect (McVerry et al. 2006): the hot rocks in the lava associated with volcanoes modify ground motion in such a way that the seismic waves decay faster.
Revising GMPEs for Megathrust Earthquakes After Tohoku
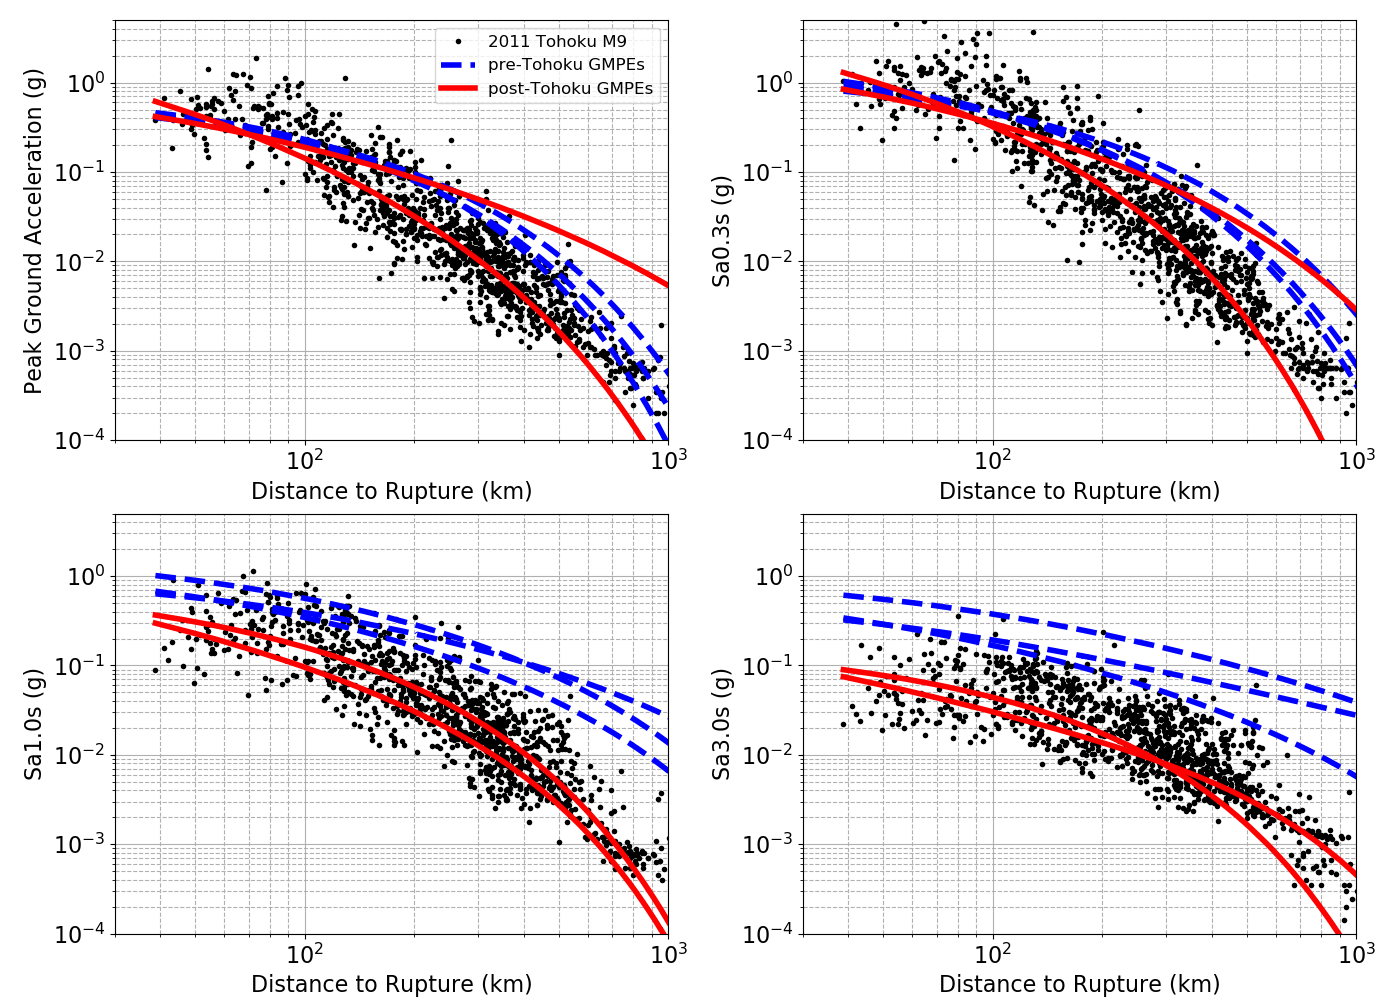
Recent studies on Tohoku ground motion indicate revision of GMPEs for megathrust earthquakes (Ghofrani and Atkinson 2014, Abrahamson et al. 2015 and Zhao et al. 2016) and help constrain source effect and decay with distance for both short- and long-period ground motion. Figure 2 compares the ground motions calculated from five GMPEs for the Tohoku earthquake. For longer period ground motions, the two recently published GMPEs (red solid lines), Abrahamson et al. 2015 and Zhao et al. 2016, indicate much lower ground motion across all distances compared to the other three GMPEs (blue dashed lines) developed before the 2011 Tohoku earthquake. These two post-Tohoku GMPEs also account for the volcanic path effects by defining some parameters related to volcanic fronts, also known as volcanic arcs—a chain of volcanoes formed above a subducting plate, positioned in an arc shape as seen from above—and defining volcanic zones (Zhao et al. 2016) to capture the faster decay.
The Limitations of the HERP 2019 Model’s One GMPE for Larger Magnitude Earthquakes
The HERP 2019 hazard model, which is the most recent model, only uses one GMPE, Si and Midorikawa (1999), which provides peak ground acceleration (PGA) and peak ground velocity (PGV) for ground motion calculation. This GMPE was used for hazard models before Tohoku, and it should also be noted that for this GMPE, they capped the magnitude at 8.3; for all events larger than M8.3, and for M9.0 ground motion calculation, their PGV is similar to the Tohoku data (PGV). This also indicates there is some kind of saturation of ground motion for megathrust earthquakes (considered by capping at 8.3 in the model). Therefore, in the latest HERP hazard model for earthquake scenarios with magnitudes larger than 8.3, the ground motion is calculated using Mw=8.3 within the GMPE because of its similarity to the ground motion for larger earthquakes; this calculation is used as a proxy to account for the saturation of ground motion at larger magnitudes (Fujiwara et al. 2014).
Using only this GMPE, however, has two limitations. The first limitation is that Si and Midorikawa (1999) does not provide spectral acceleration (SA) calculations. Although the earthquake engineering community in Japan typically uses the Japan Meteorological Agency (JMA) intensity and PGV to develop most of their fragility curves driven by observed damage from past earthquakes, GMPEs with a calculation of SA at various periods have become a global standard and more advanced intensity-based damage modeling has been used in risk assessment. After Tohoku, Japanese GMPE developers started to adapt their ground motion models to include SA estimations. For specific types of buildings and infrastructure, such as tall buildings and long-span bridges, they conducted site-specific response analysis using SA values in addition to using Japanese hazard maps developed with PGV and JMA intensity.
The second limitation is that using only one GMPE could introduce large epistemic uncertainty due to lack of data and limitations in knowledge about wave propagation for different types of earthquakes. A GMPE logic tree is commonly used in hazard calculation, where a suite of GMPEs applicable to certain types of earthquakes is selected. The final ground motion is the weighted average of ground motion calculated from each individual GMPE.
GMPEs in the Updated AIR Earthquake Model for Japan
To calculate the ground motion of megathrust earthquake scenarios, AIR’s updated Japan earthquake model utilizes a state-of-the-art GMPE logic tree to consider epistemic uncertainty. We have incorporated five GMPEs into our model: two published after Tohoku and three published before. We give relatively higher weights to the two newer GMPEs so that both the new magnitude scaling for megathrust earthquakes and the volcanic path effects for short period ground motions are incorporated in our model. We include the three pre-Tohoku GMPEs but assign them relatively lower weights to account for epistemic uncertainty; for interface earthquakes with magnitudes smaller than 8.0, the three pre-Tohoku GMPEs also used observation to constrain the ground motion calculation. Given that the dominant contribution to hazard is from subduction earthquakes in Japan, our new ground motion model leads to hazard reduction—mainly due to new magnitude scaling, informed by the Tohoku ground motion data. The reduction is more pronounced for long-period ground motion, where the two new GMPEs show significant reduction for SA1s and SA3s (Figure 2). Although the seismicity update in HERP 2019 led to an increase in hazard values due to larger magnitudes and the inclusion of unknown/unexpended sources not in historical data, the saturation of long-period ground motion at larger magnitudes has reduced hazard significantly.
Insights into Buildings’ Seismic Response from Damage Observations and Claims Data after Tohoku: Shake and Tsunami
Tohoku’s massive destruction took a terrible toll on the people who survived it. Making sense of such a disaster can be an overwhelming task. Through an engineering lens, however, this earthquake provided an opportunity to glean lessons about this event’s impact on the built environment for future use in applications that could help prepare users for the next catastrophe. In addition to generating an unprecedented wealth of ground motion data, Tohoku generated a superabundance of damage observations and detailed insurance claims data, which fueled numerous studies focused on assessing building response to earthquakes and their sub-perils. Specifically, observations and claims data from the Tohoku earthquake provided great insights into how tsunamis damage buildings and infrastructures. Lessons learned from the Tohoku earthquake helped advance mitigation strategies and establish engineering design requirements to protect against tsunamis.
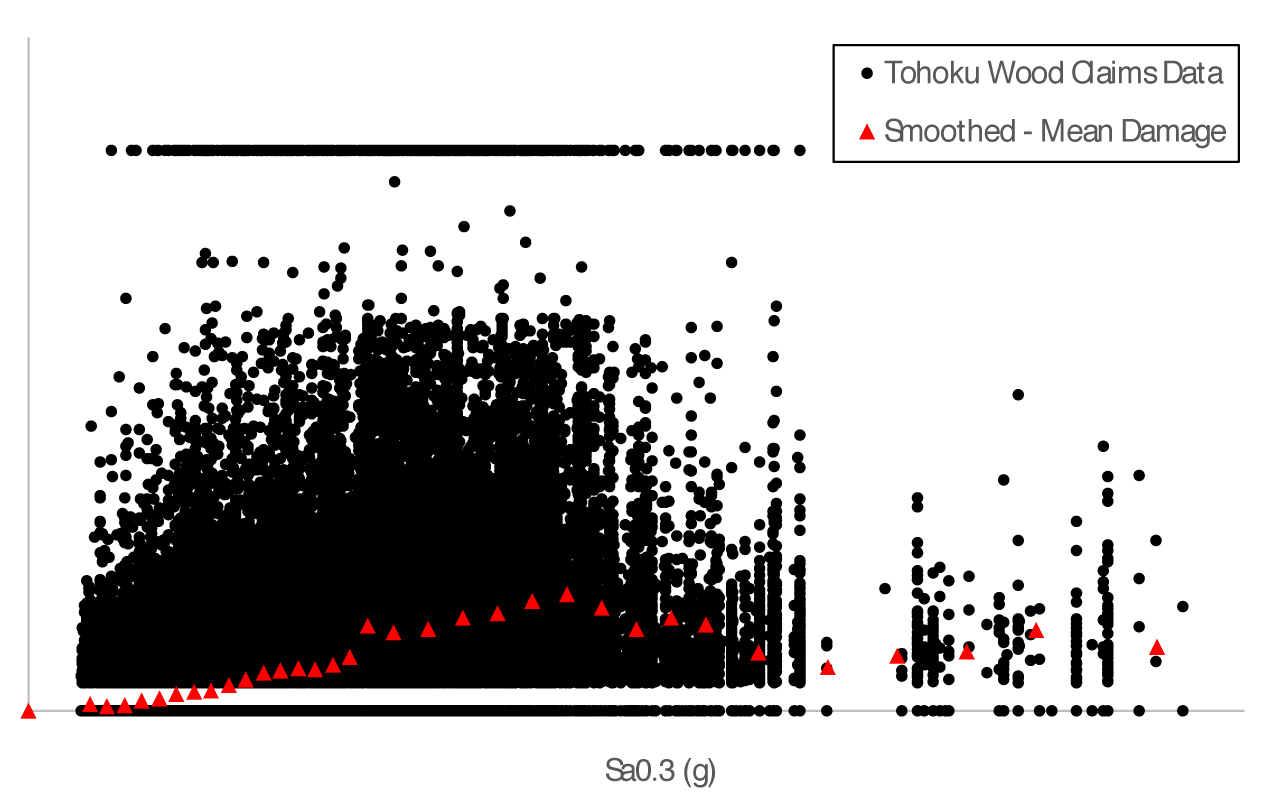
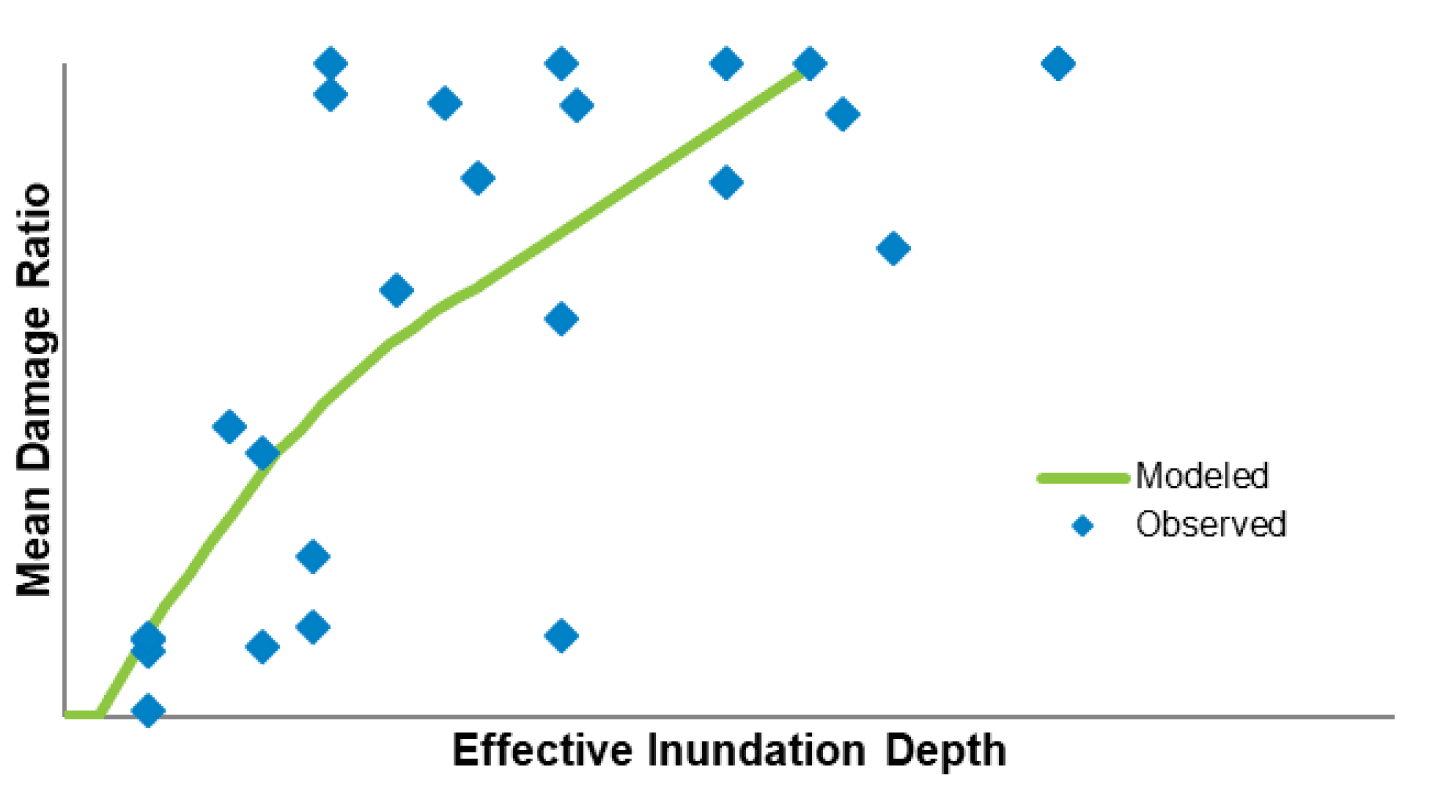
Damage observations and claims data that identified the primary cause of damage—tsunami or shake—from the Tohoku earthquake were used to improve the AIR model’s shake vulnerability functions (Figure 3, lefttop panel). Using the claims data and recorded (or inferred) ground motion parameters, AIR researchers conducted studies to identify ground motion intensities with the highest correlation to damage (Lai et al., 2015). Claims data from properties damaged by tsunami, along with information about tsunami inundation depth, enabled AIR engineers to derive and validate tsunami vulnerability functions (Figure 3, rightbottom panel). In addition, numerous publications and data sources from the Japan Ministry of Land, Infrastructure, Transport and Tourism (MLIT) were utilized throughout the development and validation process.
Changes to Design and Construction Practice: Building-Resilient Communities
Lessons learned from the Tohoku earthquake not only helped advance engineering knowledge but also promoted the notion of building-resilient communities. In the Building Standard Law of Japan, requirements for designing buildings against shaking are stringent; in general, buildings performed as expected in the Tohoku earthquake ground shaking, according to observations. Thus, the law did not change the design requirements for ground shaking; however, enhancements were made in the guidelines for the design and construction of buildings in areas exposed to high tsunami hazard. One of the notable enhancements involved Japan’s coastal protection policies, which address breakwaters, seawalls, water gates, and control forests. Policy changes were made to ensure the performance of coastal protections against a potential tsunami with a return period of approximately 150 years. The 150-year return period tsunami level refers to the “prevention level,” indicating that the coastal protection should prevent tsunamis from hitting inland to protect lives and properties. For extreme tsunamis (i.e., a return period of longer than 150 years like that of the one generated by the Tohoku earthquake), which the local government refers to as “preparedness/mitigation level,” the main objective is to protect human lives and to reduce loss and damage with comprehensive disaster management measures, including coastal protection, urban planning, evacuation, and public education.
For example, the 13-foot breakwaters destroyed during Tohoku in Miyako, Iwate Prefecture, were replaced by 41-foot concrete seawalls. Since the event, the Japanese government has spent approximately USD 12 billion to build 245 miles of seawall structure along this stretch of coast to protect the area from future tsunamis. The new seawalls aim to halt tsunamis and prevent them from inundating the land. For extreme events the wall will still be able to delay flooding and provide more time for evacuation. Note that, in addition to seawalls, some towns have prohibited building in low-lying areas near the coast, while others have raised their land before building new structures.
What if the Tohoku Earthquake Were to Recur Today?
Using AIR’s updated Japan earthquake model, we simulated ground motion intensity for the Tohoku earthquake and its impact on current exposure (Figure 4, left panel). The data from more than 1,000 recording stations were used to calibrate the simulated intensities, ensuring the most accurate footprint of ground motion. Many of the areas along the east coast in Miyagi, Fukushima, and Ibaraki prefectures experienced strong high frequency ground shaking, to which low-rise and mid-rise buildings are particularly sensitive. The right panel of Figure 4 shows a map of simulated loss ratio using AIR’s updated Japan industry exposure database.
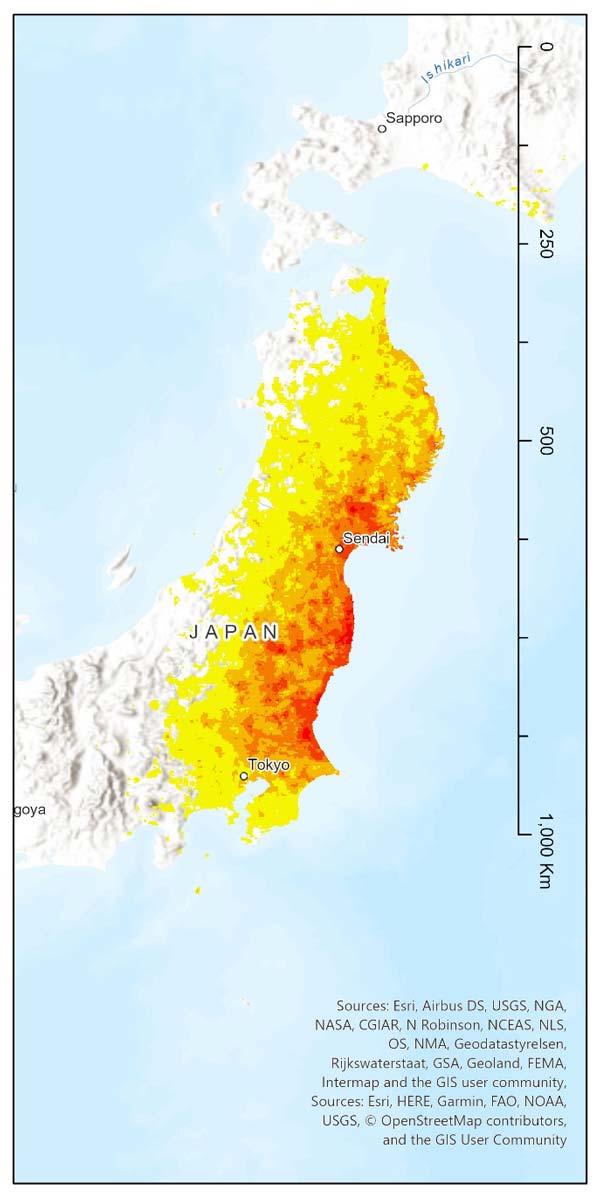
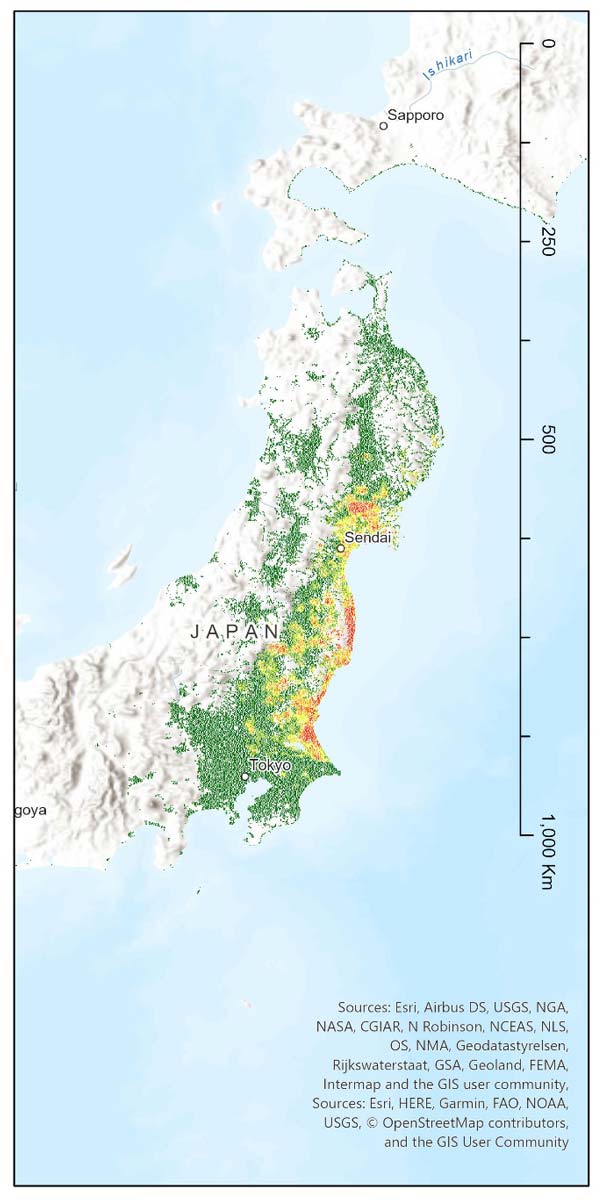
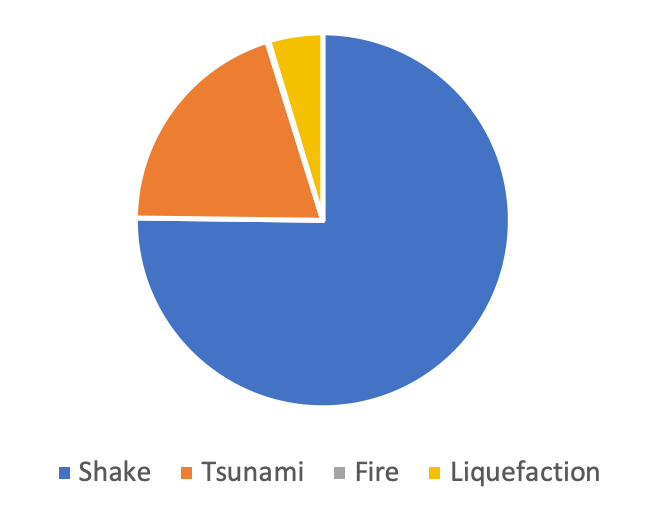
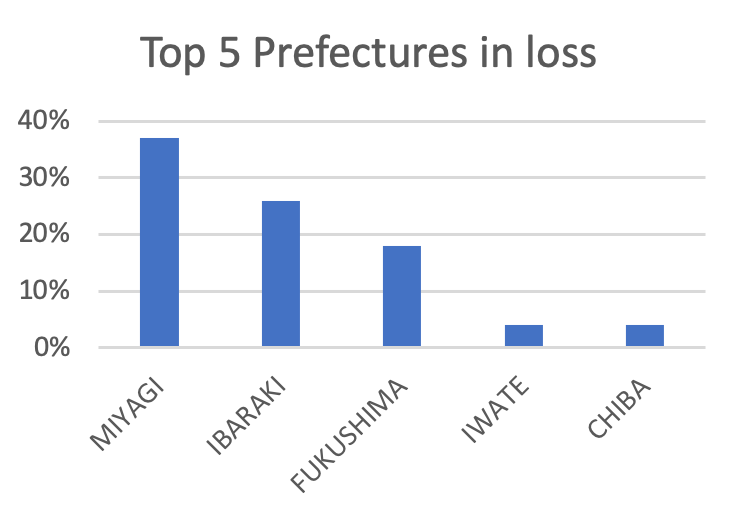
Figure 5 shows AIR’s modeled losses for this earthquake. Damage caused by ground shaking accounts for about three quarters of the total losses. Miyagi is the most damaged prefecture, followed by Ibaraki and Fukushima. (Note the nuclear power plant damage is not accounted for in AIR’s simulation.) The tsunami triggered by this megathrust earthquake devastated many coastal towns.
Managing Japan Earthquake Risk
Ten years ago this year, the M9.0 megathrust Tohoku earthquake became the most widely instrumented earthquake in history, generating copious ground motion data, damage observations, and detailed insurance claims data. Our updated Japan earthquake model incorporates insights into ground motion prediction equations, including the weighting of two produced after the earthquake and three produced before, to provide more accurate forecasting of megathrust earthquakes, magnitude saturation, and new magnitude scaling. In addition, our insights into buildings’ seismic response gained from damage observations, detailed claims data, and changes to design and construction practice as it relates to tsunami risk inform our damage functions. With the updated seismicity and ground motion modules as well as the latest understanding of the vulnerability of the built environment, AIR’s model presents the most realistic view of the earthquake risk in Japan, which, as expected, diverges from the current view in myriad ways. For example, tail risk from megathrust earthquakes is reduced due to the ground motion saturation.
A recurrence of a Tohoku-like earthquake is an example of the extensive and widespread damage an earthquake could produce in Japan. While no model can predict when or if the next megathrust earthquake in Japan will occur, using the updated AIR Earthquake Model for Japan, anticipated for release this summer, can help you prepare for such losses by providing the most detailed and accurate view of seismic risk in Japan.
In the third and last article of this series on managing Japan earthquake risk, we will cover in depth how AIR modeled tsunami hazard and damage.
Resources
The Guardian. “Tsunami, earthquake, nuclear crisis – now Japan faces power cuts". Retrieved 12 January 2020.
Arcgis, “Tōhoku tsunami”. Retrieved 12 January 2020.
National Police Agency of Japan “Police Countermeasures and Damage Situation associated with 2011Tohoku district - off the Pacific Ocean Earthquake”. Retrieved 12 January 2020.
Koshimura, S. and Shuto, N. (2015). Response to the 2011 great East Japan earthquake and tsunami disaster. Philosophical Transactions of the Royal Society A: Mathematical, Physical and Engineering Sciences, 373(2053), p.20140373.
Business Insider, “'It feels like we're in jail': Japan spent $12 billion on seawalls after the devastating 2011 tsunami — and now locals are feeling like prisoners”. Retrieved 12 January 2020
