


2021: Another Very Active Atlantic Hurricane Season
Dec 20, 2021
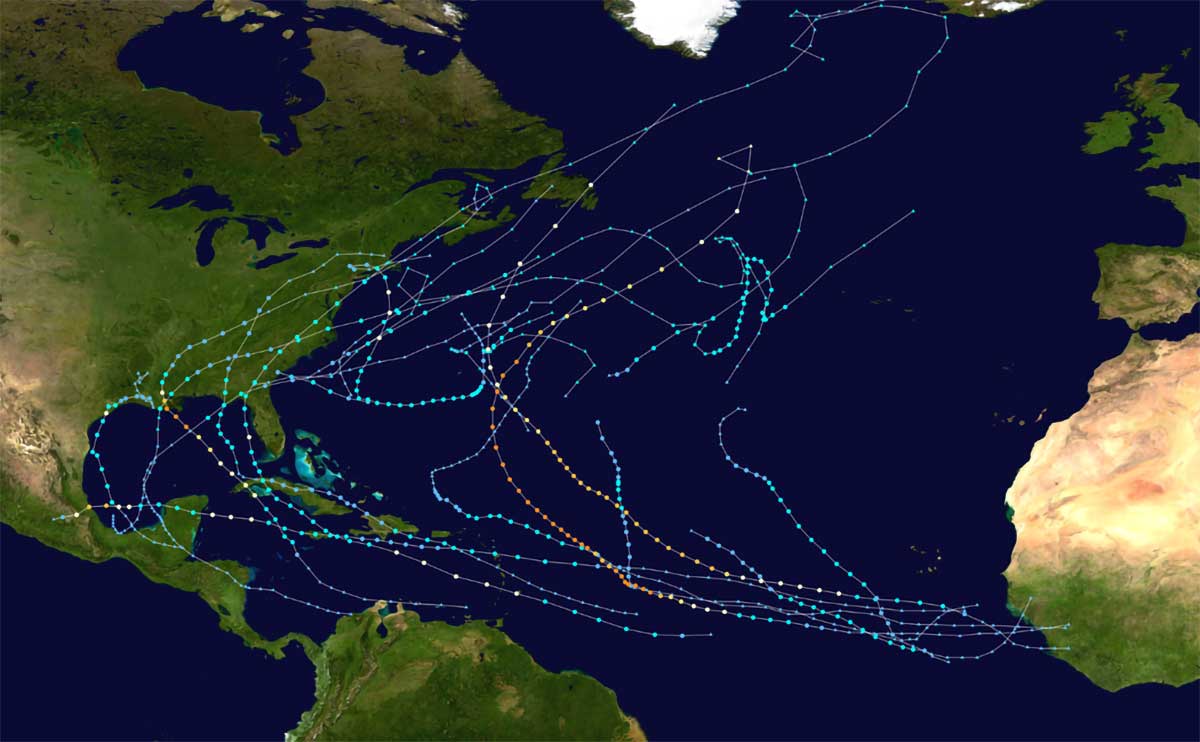
Although not quite as active as 2020’s, the 2021 Atlantic hurricane season was a very active one and records were set. In total, 21 named storms formed this year, the third highest total on record after 2005 (27) and 2020 (30). For the second year in a row, and only for the third time ever, all 21 of the names allocated by the World Meteorological Organization for the season were used.
Climate Signals and the Early Part of the Season
For the seventh year in a row, the naming of the first storm occurred before the official start of the season on June 1 when Tropical Storm Ana formed in the Atlantic on May 23. Because of this streak of pre-season storms the National Hurricane Center (NHC) issued the first of its Tropical Weather Outlooks on May 15 this year, two weeks earlier than in previous years. Seasonal activity began in earnest when four storms formed in rapid succession—Bill, Claudette, Danny, and Elsa, the last of which became the earliest fifth named storm on record on July 1, surpassing last year’s record-setting Edouard, which formed on July 6. Elsa also became the first hurricane of the season a day later.
What Drove Early Hurricane Activity?
Several factors influence Atlantic hurricane activity, including sea surface temperatures, wind shear, and vertical instability. These are affected by El Niño/La Niña-Southern Oscillation (ENSO)—a periodic fluctuation of SSTs and air pressure in the equatorial Pacific Ocean. Part of what drove early hurricane activity in the Atlantic basin was a continuing but weakening La Niña—the cooler of ENSO’s phases. La Niña is associated with cooler sea surface temperatures (SSTs) in the eastern or central Pacific, which enhances convection across the Atlantic and creates favorable conditions for cyclogenesis.
Sea surface temperatures in the North Atlantic were much warmer than average, particularly off the U.S. East Coast and across the entire sub-tropical North Atlantic. Pre-season forecasts accurately predicted both the neutral ENSO and above average sea surface temperatures. The Atlantic Multidecadal Oscillation (AMO), a long running index of sea surface temperatures, provides a measure of the average surface temperatures across the North Atlantic. These tend to fluctuate between warm and cool phases every 40-60 years. The AMO has been in a warm phase since the late 1990s, and studies have shown that during such warm phases heightened hurricane activity is to be expected.
Several sub-seasonal indices also affect tropical cyclone development. The Saharan Air Layer (SAL)—a dry and dusty air mass that develops over the Sahara Desert—is periodically carried out over the Atlantic where it can impact cyclogenesis. The SAL contributes significantly to dry air, which inhibits tropical cyclone development over the Main Development Region (MDR), which is the area between the coast of Africa and Central America, so called because virtually all African waves originate in this region. These African waves account for 85% of all Atlantic major hurricanes and 60% of all named storms. A marked increase in SAL activity covered much of the Atlantic basin following Hurricane Elsa and did much to suppress tropical cyclone development until mid-June, when the season’s first dramatic burst of hurricane activity occurred.
The Madden Julian Oscillation (MJO), described by NOAA as “a mode of sub-seasonal atmospheric variability that influences the location and strength of tropical precipitation”, is another factor. There were several active MJO phases this season, the first of which occupied much of May, and the next occurred in the first half of July.
 Jeffrey Strong, Ph.D.
Scientist
 Eric Uhlhorn, Ph.D.
Principal Scientist
 Karthik Ramanthan, Ph.D.
Vice President
Edited by Jonathan Kinghorn, CEEM, and Sara Gambrill, CEEM
August: Record Precipitation, Rapid Intensification, and the Costliest Storm
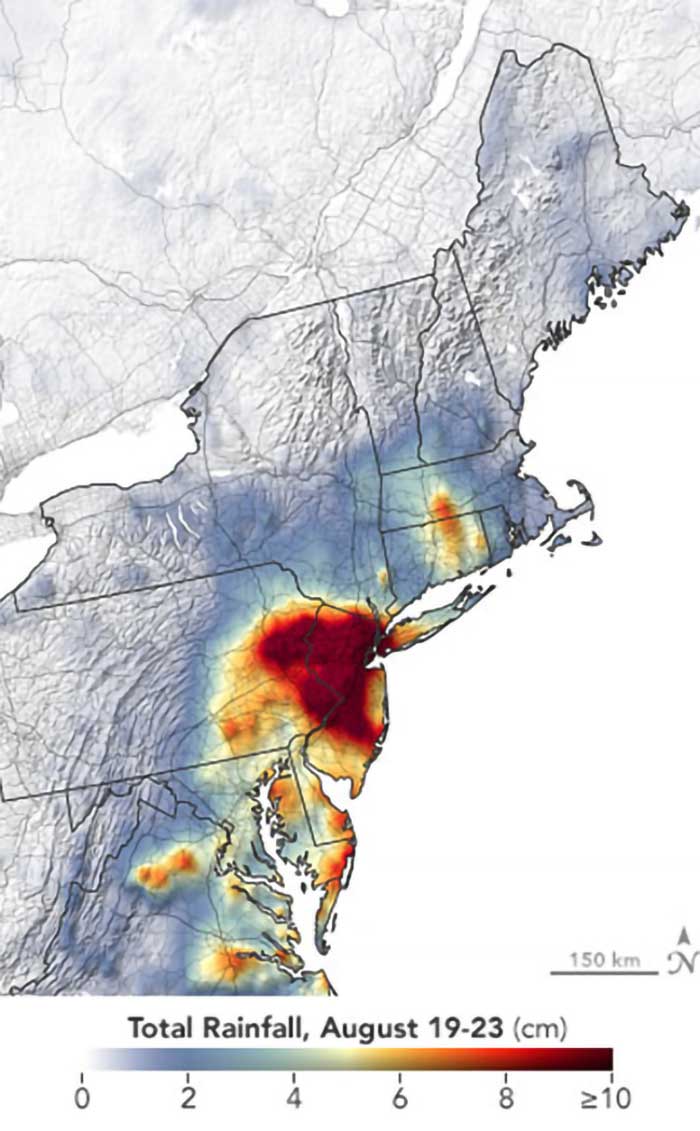
Record-breaking precipitation accompanied hurricanes Henri and Ida, most of which impacted the U.S. Northeast more severely than the Gulf Coast.
Category 1 Hurricane Henri weakened very rapidly once it came ashore in Westerly, Rhode Island, on August 22 but was moving forward at only 11 mph and carried with it heavy rainfall. New York City received a total of 7 inches during the storm, and a record-breaking 1.94 inches was recorded within one hour in Central Park. Henri caused similar problems in Connecticut, where soils were already saturated following the passage of Tropical Storm Fred a few days earlier. Fred had dumped almost 1 foot of rain in the northeastern metro corridor, in addition to having dropped prodigious amounts of precipitation and caused flooding in the Carolinas and Tennessee.
Following Henri came Hurricane Ida, the costliest U.S. hurricane of the year. This hurricane made its first landfall in Cuba on August 27 as a Category 1 storm. Having traversed the island, it then tracked northward and intensified over the warm waters of the Gulf of Mexico.
Although Ida weakened slightly from its peak intensity before making landfall near Port Fourchon, Louisiana, on August 29 it was still a formidable Category 4 storm when it came ashore, 16 years to the day after Hurricane Katrina and just 40 miles away. It made landfall with maximum sustained winds of 150 mph (240 km/h)—equaling last year’s Hurricane Laura and the Last Island Hurricane of 1856 as the strongest in the state’s history—and a central pressure of 930 mb—a figure only surpassed by Katrina in 2005. After landfall Ida maintained its peak intensity longer than other notable Louisiana storms.
As the system moved inland, however, it began to weaken significantly, but not before it had inflicted significant wind and flood damage to the region as well as extensive power outages. Following hot on the heels of Tropical Storm Fred and Hurricane Henri, Ida delivered record-breaking precipitation to a recently saturated northeast metro corridor.
Rapid Intensification
Grace, which was named on August 14, became a Category 1 hurricane two days after making landfall on Hispaniola. After a second landfall on the Yucatan Peninsula, Grace weakened but on entering the southwestern Gulf of Mexico it restrengthened and on August 21 it encountered warm waters and underwent rapid intensification. Rapid intensification is defined by NOAA as an increase in the maximum sustained winds of at least 30 kt within a 24-hour period, and as sea temperatures rise it is a growing concern, particularly when it occurs shortly before a storm’s landfall. This was the second of eight instances of rapid intensification experienced this year, the others being with Elsa and Ida (twice), followed by Larry, Sam (twice), and Wanda.
Maintaining Peak Intensity in the Peak of the Season
From mid-July the Atlantic was quiet again until another burst of activity marked the peak of the season. The biggest MJO event lasted from mid-August into October and coincided with the peak of the season. Neutral ENSO conditions also developed and persisted until mid-September, however, when a moderate La Niña state returned.
As usual, September—in which Larry, Mindy, Nicholas, Odette, Peter, Rose, Sam, Teresa, and Victor formed—was the most active month (the season’s peak is historically around September 10). Hurricane Nicholas, a slow and erratic Category 1 hurricane that hugged the coast in the greater Houston area in mid-September, was also responsible for heavy rainfall. It brought storm surge and flooding to parts of Texas and Louisiana.
In addition to producing the most storms, September was notable for how long some tropical cyclones maintained major hurricane status (Category 3 and greater). Hurricanes Larry and Sam, for example, formed in the Atlantic Main Development Region (MDR) where warmer than usual or record sea surface temperatures and favorable wind shear conditions enabled them to develop to Category 1 status on September 2 and September 24, respectively. Both were so-called “fish storms”—storms that stay out in the open Atlantic and pose no threat to land (Julian, Kate, Rose, and Victor, for example, impacted nowhere) and they followed similar tracks. Larry became a major hurricane (Category 3 or higher) on September 3 and remained a Category 3 storm until September 8. Sam became a major hurricane on September 25 and wavered between Categories 3 and 4 until October 3.
October Dropoff
Until early October the overall level of basinwide activity matched that in the record-breaking year of 2005, but then became quiet again. It is unusual to have a quiet October when La Niña conditions prevail, but several changing weather patterns including dry air in the MDR, fewer tropical waves, and an increased wind shear combined to effectively inhibit tropical cyclone development.
The Atlantic remained tropical storm-free until Wanda, the last storm of the season, was named on October 31. Wanda, unusually, developed from a Nor’easter—an East Coast storm with winds typically from the northeast—that brought heavy rainfall, damaging winds, and coastal flooding to parts of the northeastern U.S. The system encountered warm waters as it moved out into the Atlantic and developed into a tropical storm. As a tropical storm, Wanda remained at sea and never amounted to much, but this is the first instance recorded of a tropical storm developing from a Nor’easter. Following Wanda, the remainder of the season fizzled uneventfully, but as usual the season’s activity gives us plenty to talk about.
How Does 2021 Stack Up?
The higher numbers of named storms in recent years may be partly explained by improved technology, particularly satellites, facilitating the better detection of weak and/or short-lived storms. Seven of this year’s named storms developed into hurricanes, four of which became major hurricanes—Grace and Larry remained at Category 3 but Ida and Sam each attained Category 4. There were two U.S. landfalling hurricanes (Ida and Nicholas), both of which came ashore on the Gulf Coast.
| 2021 | Avg. | |
|---|---|---|
| Named storms | 21 | 14 |
| Hurricanes | 7 | 7 |
| Major hurricanes | 4 | 3 |
| U.S. hurricane landfalls | 2 | 1-2 |
| U.S. major hurricane landfalls | 1 | <1 |
Table 1 shows how the year’s storms compare to the 30-year average. It should be noted that NOAA’s Climate Prediction Center determines the number of storms that constitute the average Atlantic hurricane season using a 30-year period-of-record and that the period-of-record used is routinely updated every 10 years as it was this year, from 1981-2010 to 1991-2020. As a result of enhanced activity in the more recent period, the 30-year average has now been increased from 12 named storms and 6 hurricanes to 14 named storms and 7 hurricanes; the average number of major hurricanes has not changed. A possible contributor to this elevated activity in the more recent period is that the AMO has been in a warm phase since the late 1990s, as previously mentioned. In total, the number of named storms in 2021 was thus well above this new and higher figure but the totals for the other categories were close to the new averages.
Managing U.S. Hurricane Risk with AIR Models
While this year’s hurricane season was very active and above average with 21 named storms, a season such as 2021’s could be prepared for with our probabilistic models. Even record-breaking levels of activity in the North Atlantic Basin, however, do not necessarily correspond to major losses in the United States. In any given season there is no strong correlation between the number of tropical cyclones that form in the North Atlantic and U.S. landfalls. The 2010 season, for example, had the third highest number of named storms since 1851 (19) and the second highest number of hurricanes (12) but not one of those hurricanes struck the U.S. and only one tropical storm did so. And in some years, all it takes is one devastating storm bypassing or making landfall in a location with significant exposure for record losses to be experienced—Hurricane Ida this year, for example. The 2021 and the preceding 2020 hurricane seasons pale in comparison to the 2005 season when it comes to major hurricane landfalls in the U.S. mainland. While 2020’s Hurricane Laura and 2021’s Hurricane Ida had major intensity status at the time of their respective landfalls, the 2005 season had four major hurricane U.S. landfalls. To put either of these single events in context, more than half (53%) of the years since 1900 have had as many as one or more major landfalling hurricanes in the U.S. In fact, a season with two major hurricane landfalls is not all that rare: 23% of the years since 1900 meet this criterion. The potential landfall activity of 2021 still reflects the inherent uncertainty of losses in a given year, which our model accounts for.
Another measure of a season’s severity is its accumulated cyclone energy (ACE) index. ACE is an index that, in essence, combines the intensity and duration of a storm into a single number to express its energy; ACE scores for individual storms are combined to provide a figure for the season as a whole. The mean value of this index from 1991 to 2020 is 122.1 and the median value is 129.5. This season’s ACE score stands at 145.1, making this the sixth year in a row to have a score higher than 129; this score is down from last year’s 180.1. Unlike 2020, however, there were no major hurricanes after September and had there been any this season’s score would have been higher still. Hurricane Ida may have been the strongest hurricane of the year but it was also relatively short-lived and at 10.8 its ACE score was comparatively modest; the biggest contributions to the season’s ACE score came from hurricanes Larry (32.8) and Sam (53.8), thanks to the combination of their intensity and duration, but neither made landfall. Even so, the most active season on record—2005—accumulated a whopping score of 250; this year’s and last year’s hurricane seasons pale in comparison to the 2005 hurricane season in terms of economic and insured losses to the industry.
Comprising two U.S. landfalling hurricanes—Ida, a Category 4 that made landfall in Louisiana, maintained its intensity well inland, and drenched the Northeast, and Nicholas, a Category 1 that made landfall in Texas and brought heavy precipitation—as well as other storms that dropped heavy precipitation, the 2021 Atlantic hurricane season was accounted for in the stochastic catalogs of the AIR Hurricane Model for the United States and the AIR Inland Flood Model for the United States.
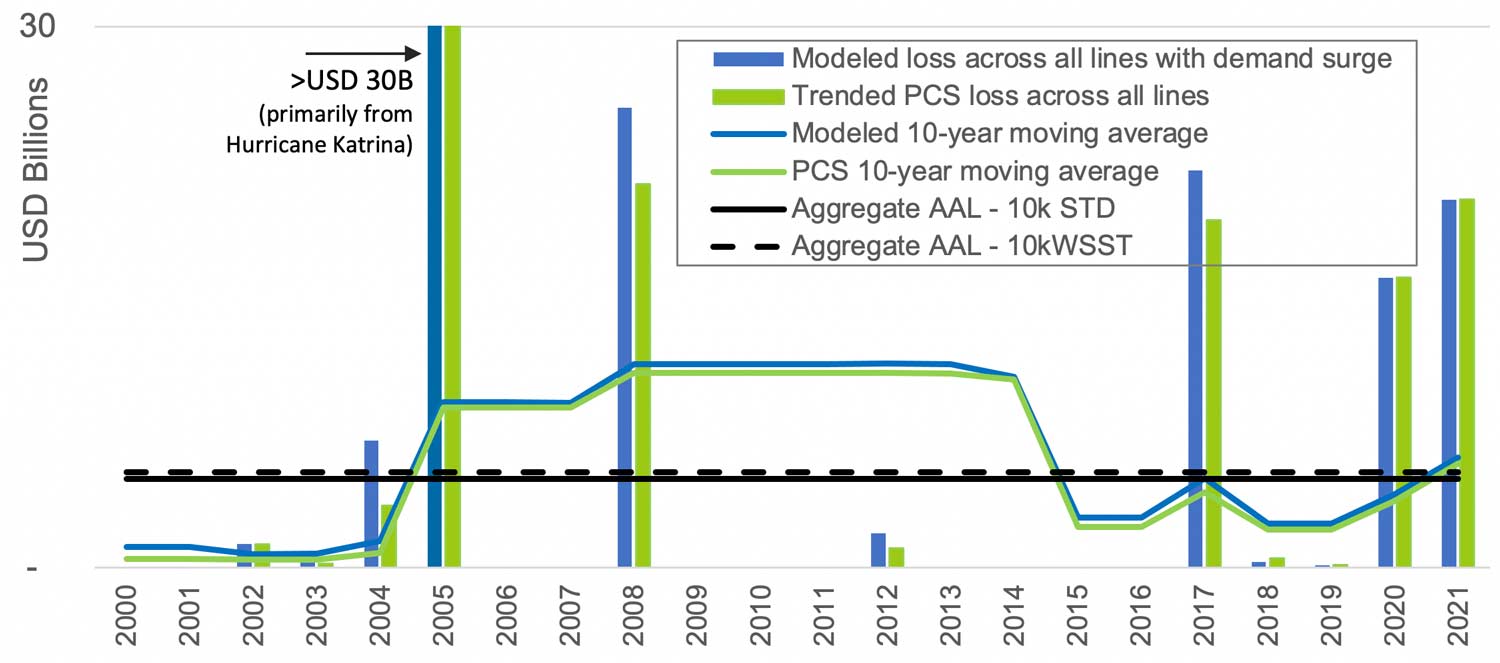
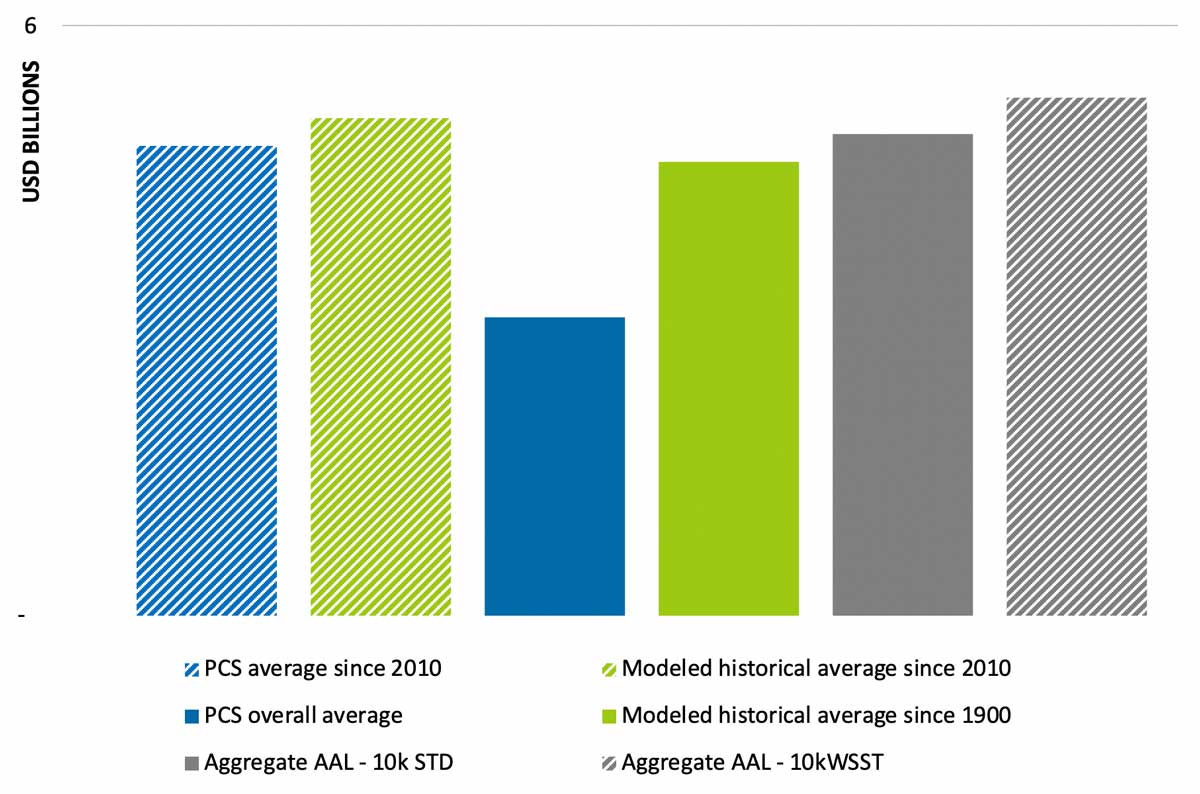
Figure 3 shows annual aggregate losses for all hurricane events impacting the Gulf states (Texas, Louisiana, Mississippi and Alabama) since 1900. These are obtained by running AIR’s detailed industry exposure database through a historical catalog of all hurricane events impacting the U.S. Shown alongside these estimates for relevant years are the trended industry insured loss estimates for the same Gulf states from Verisk’s Property and Claims Services® (PCS®). Also shown are the average yearly losses from our U.S. hurricane model’s historical catalog for all events since 1900 and events since 2000; average yearly loss from the trended PCS loss estimate since 1950, since 2000 for the Gulf states. Aggregate average annual loss (AAL) estimates for the industry in Gulf states using AIR’s 10,000-year standard (STD) and warm sea surface temperature (WSST) conditioned catalogs are overlaid on the same figure. Figure 4 zooms in on the average loss estimates showing an excellent match between them, further reinforcing the robustness of the stochastic loss estimates for the long-term vs near-present view of risk as shown in the historical data.
AIR Models Provide Comprehensive, Unified View of Hurricane-Induced Flood Risk
The 2017 and 2018 Atlantic hurricane seasons set records for precipitation and highlighted the impact hurricanes can have on flooding events in the United States. In August 2017 Hurricane Harvey was the wettest storm to flood Texas, and in September 2018 Hurricane Florence set the record for wettest tropical cyclone to impact the Carolinas. While AIR has modeled the inland flood peril since 2008 and launched the industry’s first probabilistic inland flood model for the United States in 2014, until a few years ago it was not possible to adequately simulate precipitation associated with tropical cyclones.
The first model for which AIR was able to develop and employ innovative methodologies that realistically simulated rainfall patterns of tropical cyclones was the AIR Inland Flood Model for Japan in 2017. We leveraged our experience developing this model and used machine learning techniques to update both the AIR Inland Flood Model for the United States and the AIR Hurricane Model for the United States—high-resolution, physically based catastrophe models that simulate both tropical and non-tropical precipitation realistically—that together offer the industry a unified and comprehensive view of flood risk from all precipitation events never before available to the industry to help you enhance your risk management and resilience strategies and truly own your U.S. flood risk.
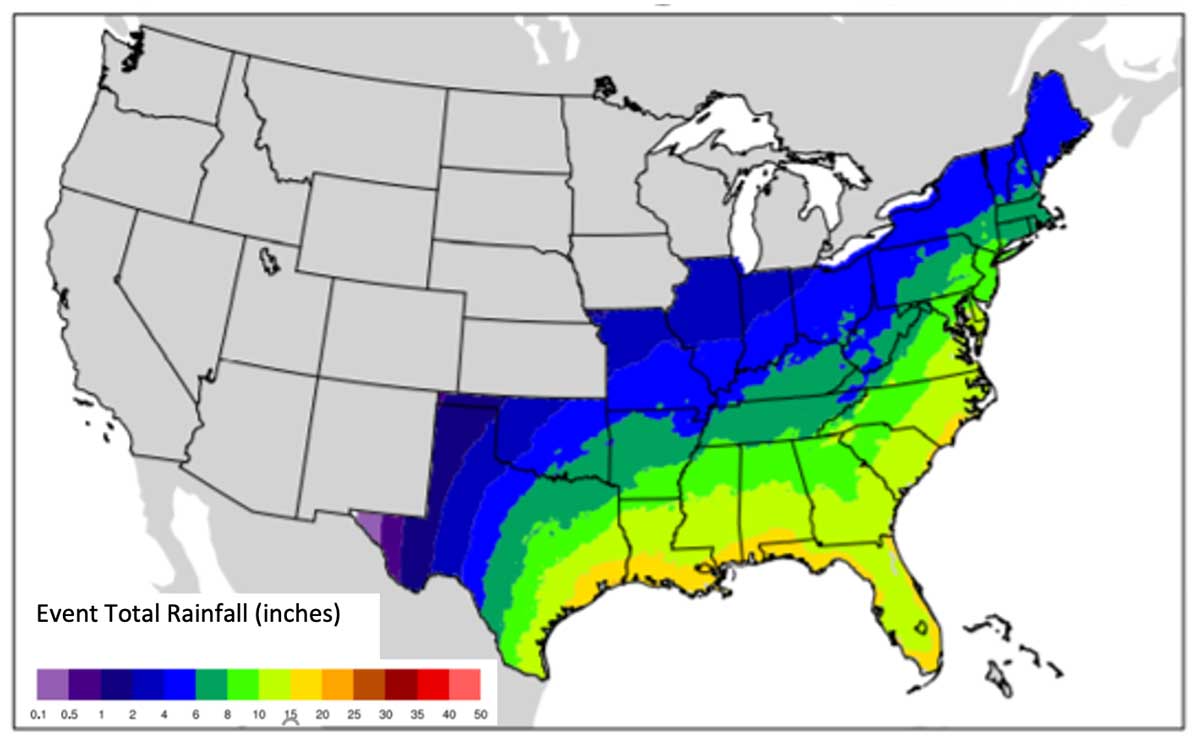
The AIR Hurricane Model for the United States provides a comprehensive view of hurricane precipitation flood risk, including insights into and capturing the significant flood risk in the Mid-Atlantic and Northeastern states. Figure 5 shows spatial extent 100-year return period quantiles of event-level hurricane precipitation within the 30-state model domain of the model. While the Gulf states, particularly their coastal areas, experience significant rainfall on a relatively regular basis, the Mid-Atlantic and Northeastern states receive high rainfall but at a lesser frequency and are therefore less prepared to handle flooding impacts. With Ida, for example, more rainfall fell over parts of Louisiana than in areas of Pennsylvania, New York, and New Jersey that saw historic levels of flooding impacts.
Considering the frequency and severity of precipitation-induced floods and the losses they can cause, managing just part of your flood risk is not sufficient. High-resolution, physically based catastrophe models that simulate both tropical and non-tropical precipitation realistically can allow insurers to expand into new markets profitably and cover the flood insurance gap.
AIR Models Represent the Near-Present Climate
The factoring in of climate change as it evolves makes for a convincing case that building catastrophe models from historical data alone, or even the statistics of that data, may leave gaps that affect a model’s ability to appropriately represent extreme weather events. AIR’s probabilistic U.S. hurricane and flood models represent the near-term climate on a 0- to 10-year time frame. As the risk continues to evolve, our models will continue to incorporate the latest research on this evolution and our global modeled losses will continue to be updated to reflect this changing risk.
For AIR’s U.S. hurricane model, we researched how hurricane wind, storm surge, and precipitation-induced flood events have changed and will change to understand how the AIR model captures these trends. The model uses a catalog of 100,000 plausible storms, some of which are more significant than events known to have occurred from the historical record, and it thus incorporates a complete range of physically possible storms, including extreme events that may happen today. The model and the data behind it are updated and validated regularly and thus reflect the current climate as well as the inherent uncertainty of losses in a given year.
It is generally expected that any effects of climate change would manifest themselves first in basinwide activity, where the sample sizes are the largest and statistically robust signals would therefore be expected to show up first. Science has not yet clearly identified exactly how anthropogenic change will impact tropical cyclone activity. Most modeling studies under projections of climate change have predicted a future with fewer total events but a higher proportion of the most extreme events. A small minority of models, however, have challenged that somewhat conventional outcome with predictions of increases in tropical cyclone frequency across the spectrum of event intensities. All studies are subject to various uncertainties.
More pertinent to property and casualty risk than basinwide activity, of course, are the statistics of landfall activity. Because of small sample sizes for this even rarer type of event, any impact of climate change, already a gray area for influences on basinwide activity, will be even more difficult to detect in the statistics of landfall. In the past roughly 120 years of the historical record, there is no discernible trend in either landfall frequency or intensity. AIR research reveals that the recent trend in increasing intensity over the last 40 years is almost identical to one from 1925-1965 and moreover coincides with the same kind of AMO behavior for both time periods.
Understanding how climate change affects the severity of extreme weather phenomena is something we care deeply about at AIR, as it is part of our mission to help companies make more informed decisions and, ultimately, to help make society more resilient in the face of natural disasters. If it can happen, it will happen at some point, and using a probabilistic model that has incorporated a complete range of physically possible storms can prepare you for that eventuality.
While forecast accuracy may be increasing, seasonal forecasts are inherently uncertain; probabilistic models remain the most reliable method of obtaining a comprehensive view of U.S. hurricane risk in the current climate.
