


Wet Weather Impacts on U.S. Crop Yields: What Can We Learn from 2019?
Apr 27, 2020
The “Great Flood of 2019” made headlines during the winter and spring of last year by breaking records and affecting nearly 14 million people across the U.S. Midwest and South. Rivers reached historic levels, levees were breached, and homes were inundated. And hundreds of thousands of acres of normally dry land were swamped, causing record delays in crop planting and development.
While the crop insurance industry has been concentrating on drought as the major source of indemnity payments, excess moisture—especially at the start of the 2019 season—was brought to the forefront. The record prevented planting that resulted from excess moisture required the industry to understand the true extent of potential payments. Using the U.S. MPCI model, AIR was able to accurately value prevented planting damage in September 2019, before final totals were published; we also provided yield estimates in October that were within 2% of the final corn yield and 1% of the final soybean yield and generated the industry net loss ratio expected by the industry.
This article describes how the wet weather of 2019 unfolded and how it affected planting decisions; the record slow planting progress; and how AIR estimated corn and soybean yields and net loss ratios for the industry.
Flooding from Prolonged Wet Weather
The Midwest was particularly hard hit by wet weather, experiencing its third-wettest winter since 1895 and repeated storm events throughout the winter and spring. While every state in the Midwest experienced excessive winter moisture, February saw a record amount of rainfall in the southern states and snowfall in the northern states. As a result, flooding occurred in large areas of the Ohio River and Mississippi River basins. In March, cropland in Nebraska, Missouri, South Dakota, Iowa, and Kansas experienced significant flooding. While some drying of flooded lands occurred through the beginning of April, additional storms followed. Through April and May, storms brought a steady flow of precipitation. This type of early growing season wetness increases the likelihood of prevented planting, which could cause losses.
 Julia Borman, Ph.D.
Senior Scientist
Edited by Rachel Wisch, CEEM
Producers Face Difficult Planting Decisions
Planting was incentivized in multiple ways, even under the sub-optimal growing conditions for 2019. A major consequence of the early season moisture was the prevention of planting during the normal crop planting window, especially for corn in the Midwest and the Dakotas; yet December corn futures prices rallied during the projected planting price discovery period, incentivizing the planting of corn over soybean. The Market Facilitation Program (MFP), instituted by the USDA in response to a larger tariff-based export market decline for U.S. producers, further complicated the difficult planting decisions farmers were facing. Unplanted acres were not eligible for MFP, although producers could obtain small payments if a cover crop had been planted and a successful prevented planting claim were filed.
How Does Late Planting Affect Final Yields and Why?
Historical observations from the University of Illinois indicate that in years with late plantings of 10% more than the historical average, each 1% increase in late planting tends to reduce the national corn yield by 0.9 bushels per acre. Root growth is inhibited by excessive moisture, confining roots to shallow depths and affecting long-term growth potential. Above-ground biomass, such as leaf expansion and stem growth, are also stunted. Early-stage crops can only tolerate a couple days of soil saturation or flooding and are therefore most vulnerable to complete failure. If crops survive these conditions, they may further suffer from nitrogen deficiency (and thus potentially reduced yields) as the nutrient is especially prone to being washed away by flooding.
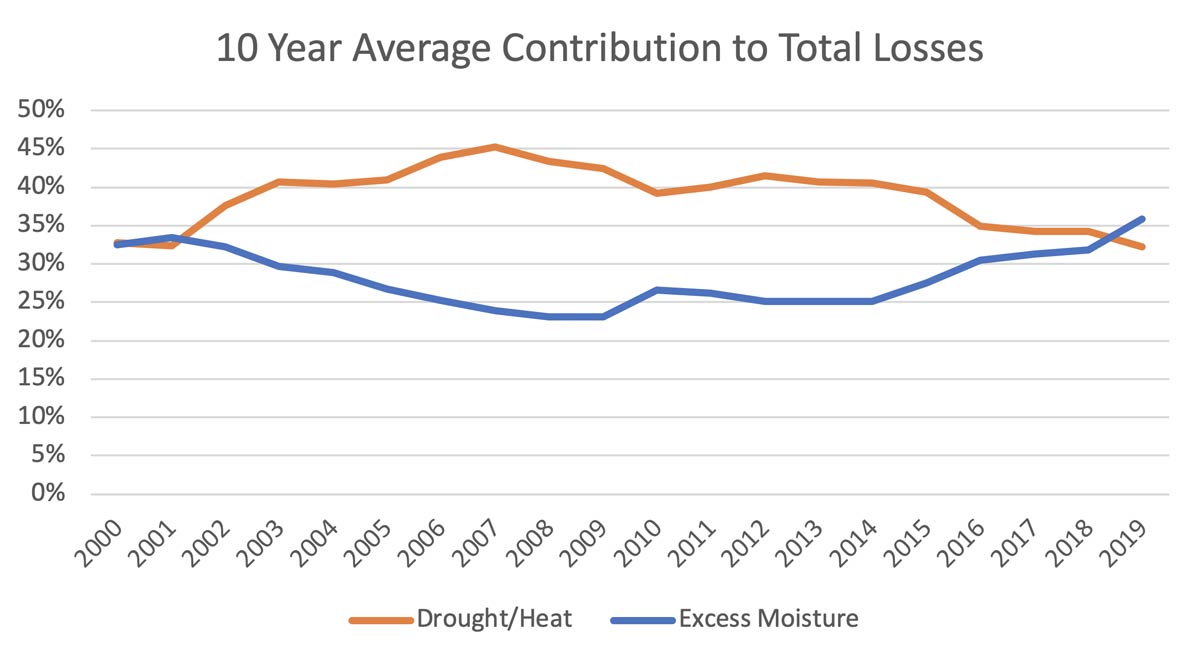
Lack of recent experience with crop losses due to excess moisture meant there were many unknowns for insurers, such as the extent of 2019 planting; which crops would be chosen by producers; and if prevented planting claims would end the streak of good results the industry had been experiencing since 2014. Prevented planting had not been the focus of discussion since 2011, and excess moisture had not been the leading contributor to indemnity payments; the 10-year running average of drought and heat was much higher than that of excess moisture (Figure 1).
Reports Reveal Record Slow Planting Progress
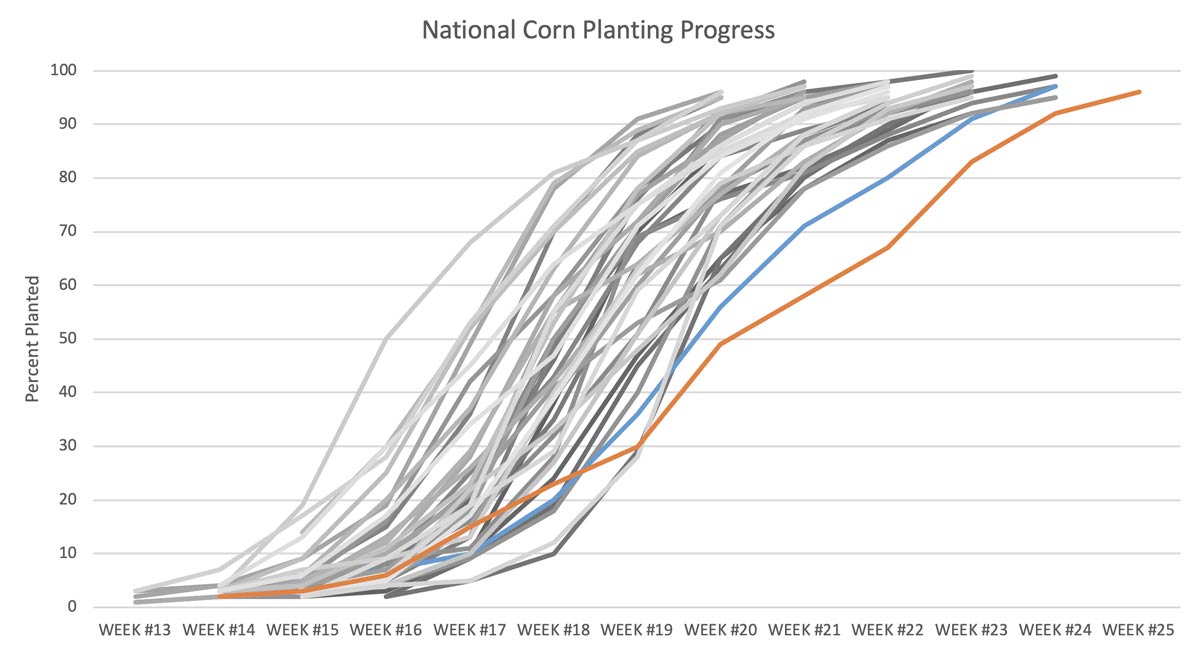
As of June 9, national U.S. corn planting progress was at 83% and soybean progress was at 60%. The corn progress for 2019 was by far the slowest since 1979, as reported by the NASS planting progress reports (Figure 2). Until 2019, 1995 exhibited the slowest corn planting progress for the same week timestamp; 91% had been planted, which was 8% above the 2019 value.
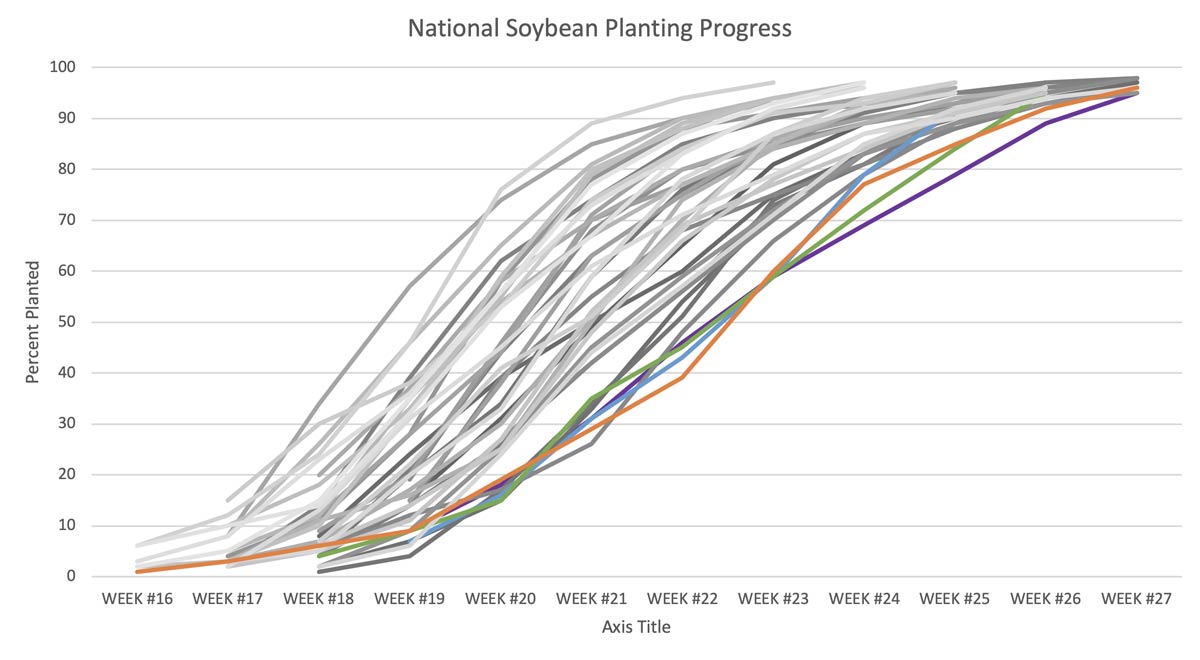
For soybean, the progress was also some of the slowest in recent history, with 1981, 1995, and 1996 all having had similar planting patterns up to this point in the season (Figure 3).
AIR Estimates the Extent of Prevented Planting Losses
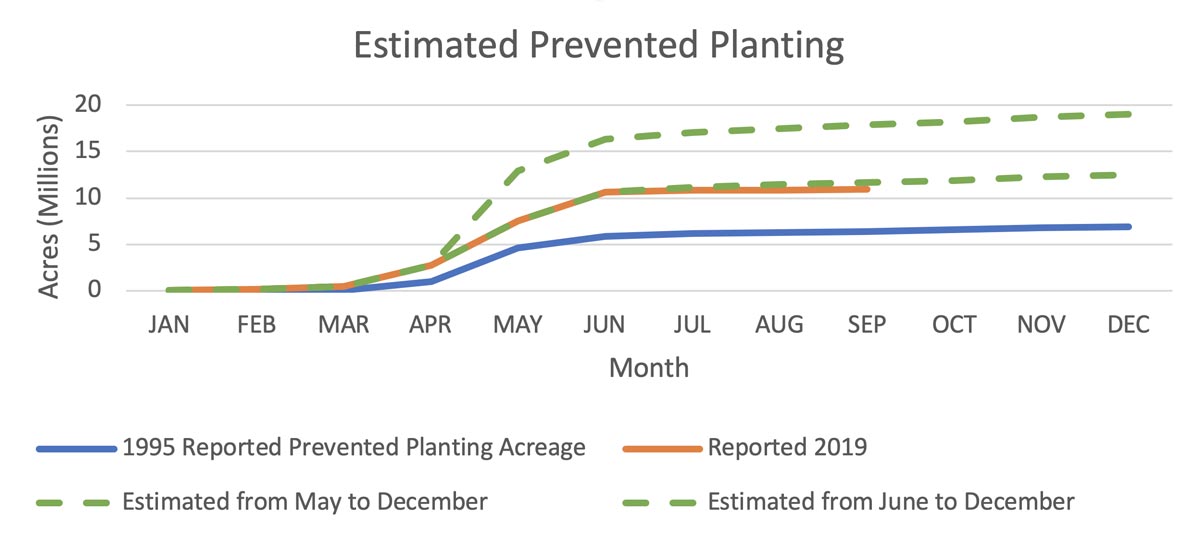
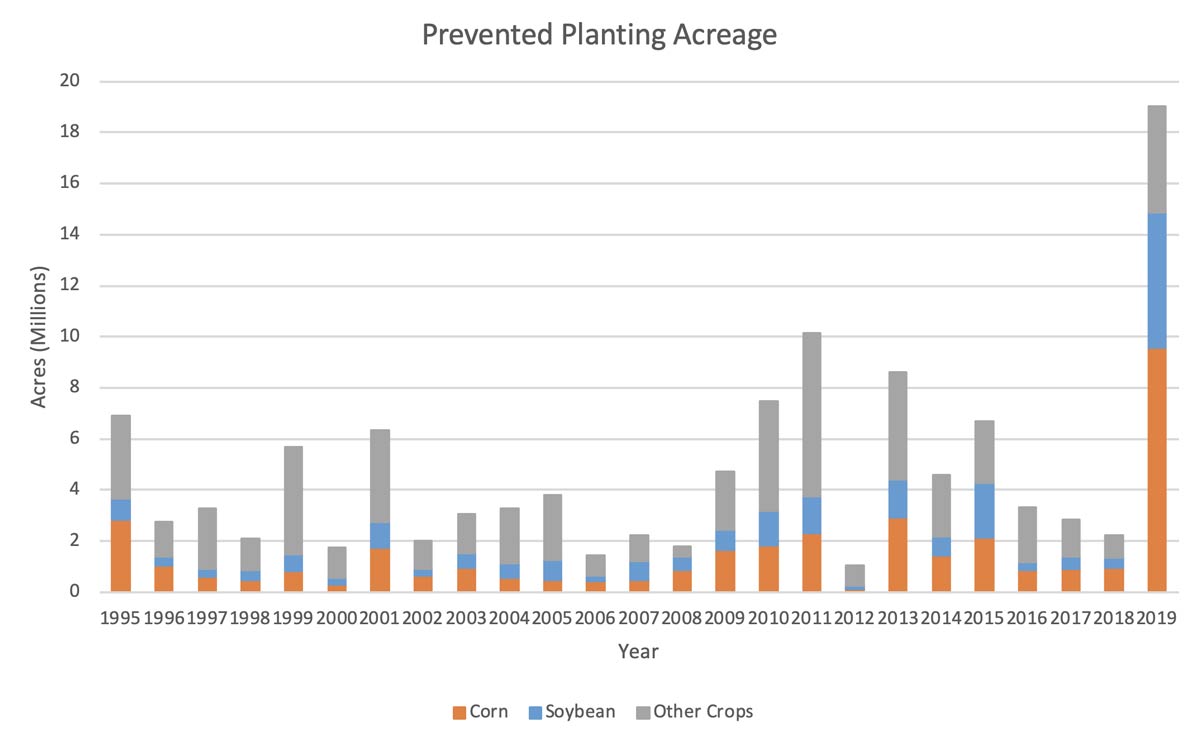
Using the 1995 benchmark developed in June 2019, AIR reported in the September U.S. MPCI 2019 CropAlert™ that prevented planting losses would total around USD 4.35 billion for the season. To do this analysis RMA Cause of Loss data from 1995 was used to check the acreage estimates for 2019 (Figure 4). If prevented planting reporting followed the same rates in 2019 that it did in 1995, then prevented planting losses for crop insurance would be bounded between 12.5 million and 19 million acres. At the September 2019 cost of USD 2.86 billion on the first 12.5 million acres, if prevented planting were to reach 19 million acres, AIR estimated that the cost to the industry would be USD 4.35 billion.
The USDA Farm Service Agency (FSA) released new estimates of the extent of prevented planting losses on October 10, putting losses at 19.6 million acres across all crops, 15.9 million acres of which were attributed to corn and soybean. The FSA values designate any cropland participating in farm programs (not necessarily crop insurance) into one of three categories: planted, failed, and prevented.
The full scope of prevented planting losses was only understood once the 2019 crop season concluded. AIR’s estimate of approximately 9.6 million corn acres and 5.3 million soybean acres were affected by prevented planting, in line with the FSA October total estimate of 19 million affected acres for the season (Figure 5). In addition, AIR indemnity calculations of USD 4.35 billion were close to the actual USD 4.2 billion in payouts experienced by the industry as of April 2020.
Estimated 2019 Crop Yield Using the AIR U.S. MPCI Model
In addition to prevented planting estimates, AIR reported yield expectations in every monthly issue (June to October) of the 2019 CropAlert. AIR uses the Agricultural Weather Index™ (AWI™) to determine deviations from trend line yields for corn and soybean over the course of the growing season. The methodology establishes a trend line for corn and soybean by establishing the contribution of weather to the observed yield variation of the last years and then using a “weather-corrected” yield time series that is more representative of current technological improvements to fit a trend line. Once the trend line has been established, current growing conditions—up to the week prior to publication—are used, in conjunction with average weather for the rest of the season, to determine a final harvest yield.
From the AWI-determined trend line, a baseline yield is established for every county. Current growing season weather conditions are then used with the AWI to determine deviations from that baseline—above baseline when cumulative weather has been favorable, or below baseline if cumulative weather is negatively influencing crop growth.
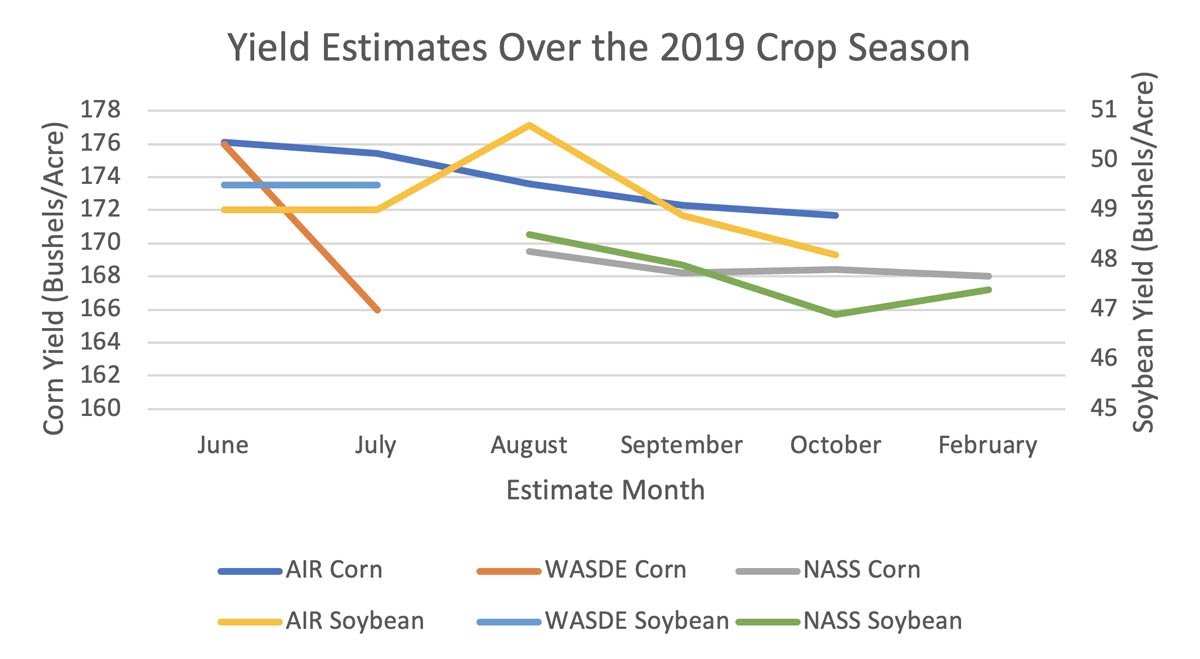
The AIR estimates alongside the WASDE and NASS Crop Production estimates from the 2019 season are shown in Figure 6. AIR final estimates in October were 171.7 bushels/acre for corn and 48.1 bushels/acre for soybean. The final values published by NASS in February 2020 were 168.0 bushels/acre for corn and 47.4 bushels/acre for soybean, meaning AIR estimates were within 2% of final corn results and 1% of final soybean results.
Estimated 2019 Net Loss Ratios for Crop
Using the estimated yields and futures price information in October, AIR also performed an analysis to estimate industry loss ratios. The analysis was a combination of event filtering in Touchstone Re™ of the low volatility stochastic catalog and adjustment of model outputs to incorporate the expected USD 4 billion in prevented planting losses on each of the events. Within the U.S. MPCI model, prevented planting losses are included in events. The events for which we filtered in the previous section’s scenarios, however, did not necessarily have high prevented planting included and were adjusted to reflect the high prevented planting loss payments.
The average gross loss ratios with prevented planted adjustment of the AIR analysis fell between 108% and 121%. A portion of the gross risk is ceded to the federal government through the Standard Reinsurance Agreement. Adjusting the gross loss ratios to reflect an industry-based designation and determine that the net loss ratios will be between 92.8% and 99.3%.
While the final values for loss ratios will not be known for some time, industry expectations are a net loss ratio just below breakeven, with individual Approved Insurance Providers experiencing 7-point gains to 5-point losses, indicating that AIR estimates for final net loss ratio outcomes align with current industry expectations.
Accurately Estimating Your Crop Risk
One of the main challenges in assessing the risk of loss to a crop insurance portfolio prior to the growing season is that historical data are limited and do not adequately represent the risk. The AIR MPCI Model for the United States assesses the risk of damage and loss through the use of four stochastic catalogs of crop yield and price ratio that allow you to choose the catalog that best reflects your view of price volatility for the current year. Each of the four catalogs is a set of 10,000 potential yield outcomes that can occur across crops in each county for the coming growing season paired with a set of 10,000 harvest price/planting price ratios that reflect historical, low, medium, or a high price volatility level. These stochastic catalogs do not rely only on records of past weather patterns; they also include events outside of the historical record that could have occurred given daily atmospheric conditions experienced during recent years. The primary cause of loss for the 2019 season diverged from the 10-year trend, which demonstrates that relying on historical losses to assess today’s risk is insufficient. To accurately estimate crop risk, (re)insurers need a robust, up-to-date risk assessment model to ensure maximum profit within risk tolerance levels.
