


Modeling Fundamentals: Defining Events in the AIR U.S. Inland Flood Model
Sep 08, 2020
Distinct and independent events are fundamental to event-based probabilistic natural catastrophe risk models. Insurance and reinsurance contracts and treaties, in many instances, are structured on events and require application of certain hours clauses. Defining events for some natural catastrophes, such as earthquakes and hurricanes, is relatively easier, owing to their infrequent occurrence and clearer extent in both time and space. Earthquakes, for example, are named by the date and epicenter of their occurrence, and perimeter of their impact (e.g., 1906 San Francisco earthquake) and hurricane events are defined and demarcated based on the wind speed and the track they chart (e.g., 2017 Hurricane Harvey). In contrast, the flood peril presents a unique set of challenges in how events are defined.
Identification and demarcation are not easy in the case of inland flood events, particularly for a large country like the United States. Rainstorms often occur in quick successive spells with significant interaction, resulting in a longer duration flood; extensive river networks propagate floodwaters far downstream, extending the space-time boundaries of events and further increasing the potential for additional rainstorms to overlap and confound; and long-lasting snowmelt events from large snowpack-laden watersheds can present a complex intertwining with rain-driven flood events. Furthermore, there is invariably a significant interdependence among successive flood events by virtue of antecedent soil moisture and the buildup of water storage from preceding events impacting the runoff response to the succeeding rainstorms.
All of these factors make the grouping of local flooding instances into defined flood events a challenging proposition. This challenge is further complicated by the fact that the private flood insurance industry and catastrophe models for flood are both relatively new ways of addressing flood risk and have not yet laid out clear objectives and guidance for defining flood events or for usage of the hours clause. This article outlines important aspects of defining flood events and how the AIR Inland Flood Model for the United States has implemented its clustering algorithm for preparing the comprehensive 10,000-year stochastic flood event catalog.
Characteristics of Flood Events in the United States
Frequency, duration, and spatial extent are the three important features characterizing flood events. According to the Federal Emergency Management Agency (FEMA), “floods are the most common and costly natural disaster in the United States.”
First, because it is such a large country, it is not surprising how frequently flooding occurs: at any given time there is a flood occurring somewhere in the United States. According to peak flow data from the United States Geological Survey (USGS), stream gauges for the period spanning 1995 to 2018 revealed that over 95% of weeks have at least one gauge recording a flow with a return period of more than 2 years. A 2-year return period peak flow is commonly considered the channel forming flow, which when exceeded, overflows into the floodplains. Figure 1 illustrates this continual flood activity throughout the randomly selected year 2017 by showing the number of USGS river gauges above flood stage during each of the first 49 weeks. Thirty-two of those weeks had at least 30 gauges with peak flows above 2-year threshold; only one week, Week 48, in the year had zero such instances.
 Keith Sawicz, Ph.D., CEEM
Senior Scientist
 Kiran Chinnayakanahalli, Ph.D.
Manager and Principal Scientist
 Hemant Chowdhary, Ph.D.
Assistant Vice President and Principal Scientist
Edited by Jonathan Kinghorn, CEEM
Second, the duration of an inland flood event depends upon its climatological characteristics as well as on the size of its watersheds and river basins. Figure 2 shows the event durations of 20 significant historical flood events in the recent past that are included in the marquee event catalog of the AIR Inland Flood Model for the United States. All but two events have a duration much longer than 168 hours (1 week), suggesting that flood event duration for the United States typically far exceeds this length of time. For example: while the 2010 Tennessee Flood resulted from a single 5-day meteorological event with little impact beyond the state, the January-February 2017 California flood event lasted ~47 days, and significant flooding was also experienced in Pennsylvania, Ohio, Georgia, Florida, Texas, Washington, Oregon, Idaho, and Nevada. The widely reported Oroville dam failure unfolded from February 7 to 14 in 2017, corresponding to the second of the two significant flooding spells, starting on Day 30.
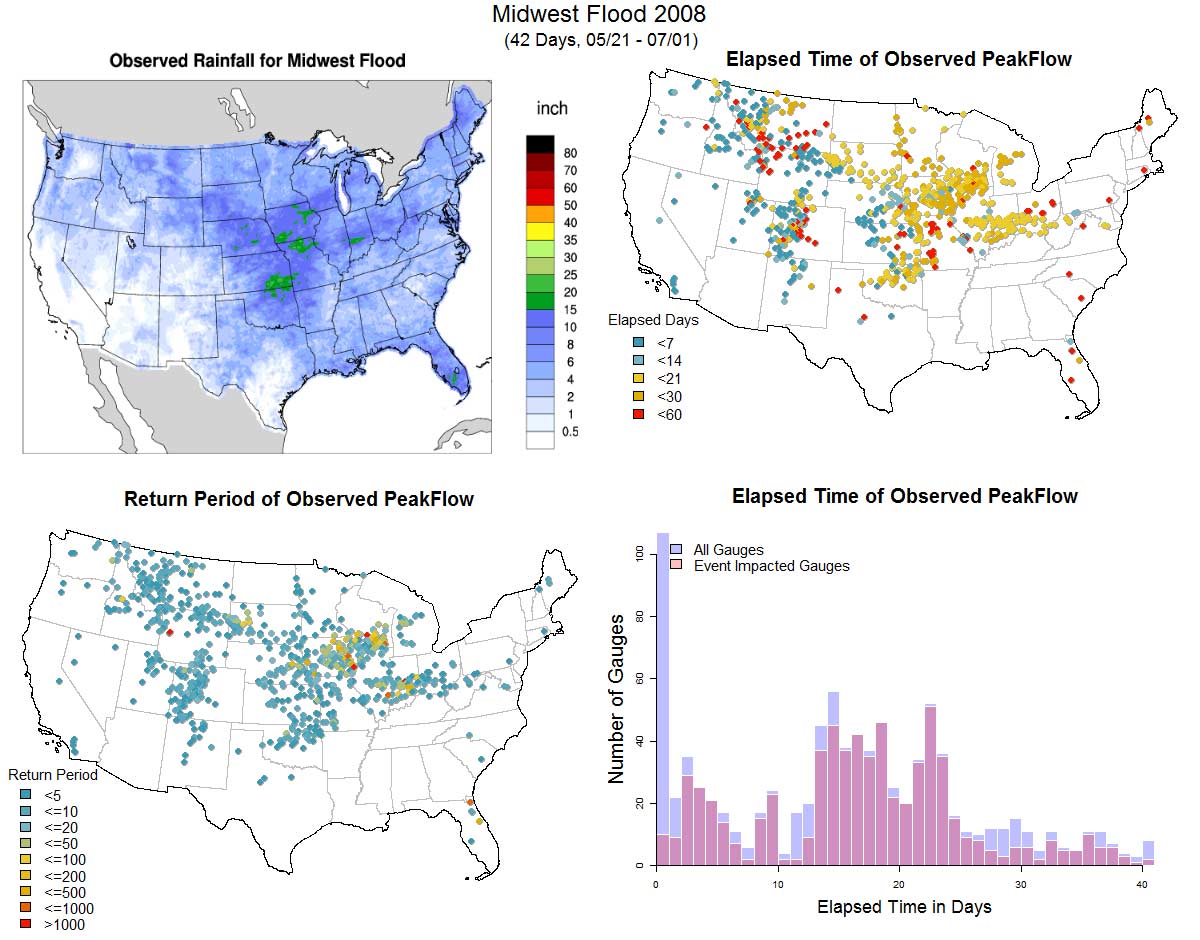
Third, to appreciate the complexities of intertwined rainstorms and consequent longer and larger inland flood events, let’s examine 2008 as an example year. In 2008, numerous rainstorms from January to July led to significant flooding in several states across the Midwest. Significant snowmelt from the previous winter’s above-average snowpack and a streak of rainstorms from January to May saturated the ground to very high levels when the heaviest of rains occurred in June. The resultant Midwest Flood event lasted for roughly 42 days, from May 21 to July 1, and caused substantial flooding and damage in Illinois, Indiana, Iowa, Kansas, Michigan, Minnesota, Missouri, Nebraska, Oklahoma, South Dakota, and Wisconsin. The observed rainfall and riverine peak flood instances for this event are shown in Figure 3. In this figure, the top-left panel shows the footprint of observed total rainfall; the top-right panel shows the elapsed time in days (from the start of the event, i.e., May 21), of the peak flows observed at the USGS river gauging locations; the bottom-left panel shows the return period of these peak flows; and the bottom-right panel shows the histogram of the elapsed time shown in the top-right panel. There are two histograms in the bottom-right panel—blue represents flooding throughout the country, whereas light purple represents only those river segments that are within the designated extent (i.e., only the Midwest region) of this flood event. The peak flow instances in this figure meet or exceed the 2-year return period at the unit catchment level. The bottom-right panel of this figure shows flooding activity throughout this 42-day period. Another important element to note is that while there was significant flooding in the Midwestern region during this time, there were several instances of flooding during the same time period in many other U.S. states, including in the Northeast, Mid-Atlantic, Southeast, and West, which were under-reported for the most part.
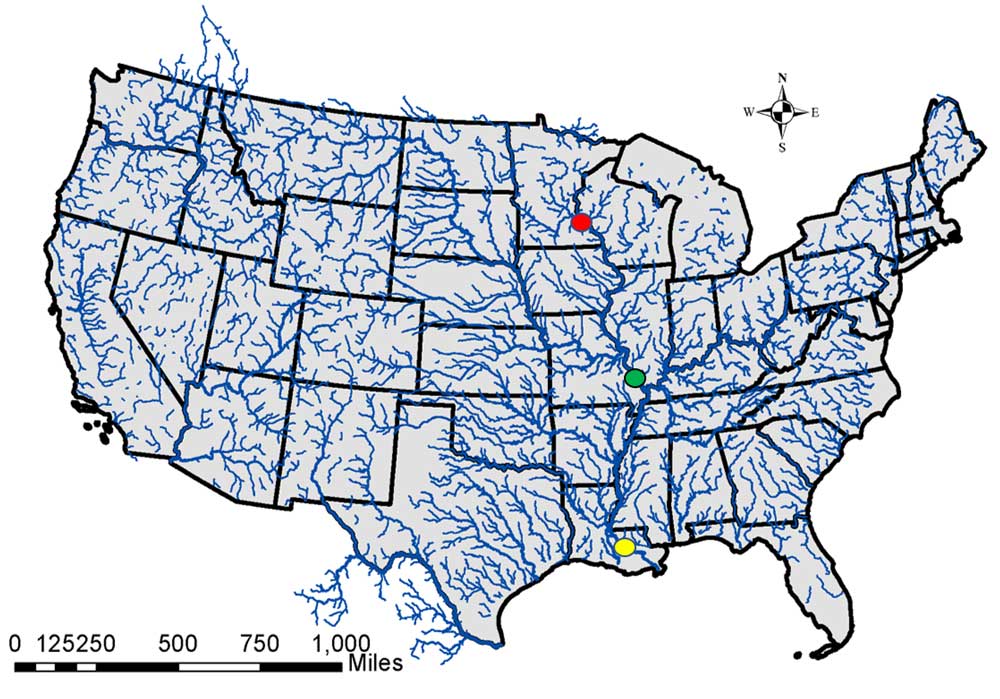
Several large watersheds and long rivers in the United States also make flood events last much longer. At times, it takes several weeks for flood waves to travel far downstream from where the significant floods originated. As it propagates downstream, the flood volume grows as tributaries join the main river. An example of this long flood travel time is illustrated in Figure 4, showing water stage hydrographs at three river gauging stations along the Mississippi River during a 2011 flood event: Prescott, Wisconsin, on April 13; Thebes, Illinois, on May 2; and Baton Rouge, Louisiana, on May 18. The flood wave traveled about 2,500 km (~1,550 miles) down the Mississippi River during this 36-day period. Events like the 2008 Midwest flood and this 2011 flood suggest that inland floods, unlike hurricane events, can last for much longer than 1 week. These factors have been considered in the AIR model’s event definition algorithm to reflect the inherent spatio-temporal continuity of flooding instances and to create longer inland flood events.
AIR’s Event Definition Approach
Important guiding principles followed in AIR’s U.S. inland flood model for defining events include:
- Downstream floods belong to the same event if within a reasonable time
- Hydrological response can have an extended memory of precipitation and therefore events may include multiple meteorological systems that affected a flood event
- A generalized methodology should be formed considering physical limitations
- Sensitivity of event definition parameters should be tested with respect to event duration, frequency, and spatial extent
AIR’s U.S. inland flood model covers about 8.2 million km2 (3.2 million miles2), covering the extent of the contiguous United States, and is represented by more than 345,000 distinct unit catchments. Continuous hydrological modeling at an hourly time interval is performed throughout the model domain to obtain peak flows and peak 24-hour precipitation for each of the unit catchments and for each of the 10,000 years of the stochastic catalog. Peak flows in rivers are used to estimate fluvial or on-floodplain hazard, whereas peak 24-hour precipitation provides the basis for the pluvial or off-floodplain flood risk away from the rivers and in smaller creeks and rivulets. Only those flow and precipitation peaks higher than the respective individual catchment level 5-year return period thresholds are considered for defining flood events; they also constitute the model’s catalog. A schematic of the hydrological modeling framework and thresholding of peak flows and precipitation is shown in Figure 5.
The event definition algorithm uses the peak flow and 24-hour peak precipitation for each year and groups them based on proximity in time and space by applying a series of agglomerative hierarchical clustering analyses (R package: fastcluster). For better control over the vast array of different event structures, these peak flooding instances are grouped in a multistep process, first based on time, and then on space. An initial time grouping of 7 days, reflecting a traditional 168-hours clause, is applied. A maximum spatial threshold of 3,500 km is then applied to reflect the limiting distance an average storm system in the United States can travel within the 168-hour period. The last step is to apply a process of stitching events together as long as they still met the additional spatial or time criteria. This ensures continuity of events outside the application of an arbitrary time or space threshold and to reflect situations similar to the flood wave propagation along larger rivers, for example along the Mississippi River as illustrated in Figure 4.
Validation and Overall Event Statistics
Annual frequency of flood events is closely linked to the time and space criteria employed in defining flood events. An effective way to ensure that modeled event statistics are realistic is to validate them against those obtained from observed data. AIR researchers carried out such validation in multiple ways, including comparing the spatial configuration and timing of different events in any given year, and comparing the overall statistics of event duration, event frequency, and event spatial extent. For this purpose, observed historical data from more than 10,000 USGS river gauging stations for a period of 24 years from 1995 to 2018 was used. The AIR hydrological model was run for this 24-year period to get modeled peak flows throughout the model domain and for each of the 345,000+ unit catchments. AIR’s event definition algorithm was applied in exactly the same way to both sets of peak flows—the modeled peaks and the ones obtained from observed data at about 10,000 gauge locations.
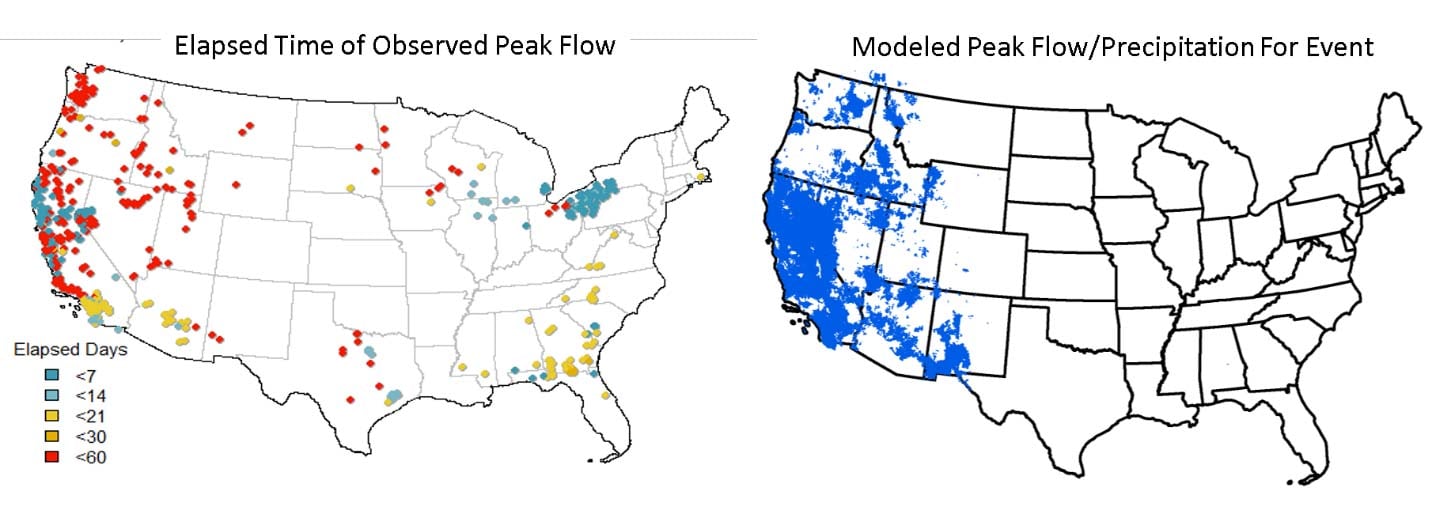
For the first type of comparison, we select a historical event from Figure 2 and compare against a modeled event defined based on AIR’s event definition algorithm for the same event period. For example, the 2017 California Flood event is shown in Figure 6. The left panel of this figure shows the observed flooding instances throughout the country during this 47-day event. If the modeled event that best matches this California Flood event in space and time is searched, an event that spans between January 1 and February 14 is found (right panel of Figure 6) and there is good agreement with the 2017 California Flood which lasted from January 7 to February 22. It is also good to see that the simulated event is not limited to the state boundary of California, and that it captures the behavior of the event within the western United States very well with respect to the spatial distribution of flooded locations.
There is also good agreement when we compare the distribution of flood event frequency, timing, and spatial distributions between observed and modeled at gauged links in Figure 7. Based on such validations, it can be shown that there is good general agreement between characteristics of the historical events and those using AIR’s event definition approach.
When AIR’s event definition is applied to the modeled peak flows and peak 24-hour precipitation across all the 345,000+ unit catchments in the model domain and for all 10,000 years of the stochastic catalog, approximately 45 events per year are generated with an average event duration of 290 hours. The event definition algorithm shows the ability to produce events that are very short (1 day) to very long (2 months), as well as to classify flooded locations into small groupings (a few square kilometers) or large events that span vast portions of the country (>3,000 km2). The event characteristics—duration, frequency, and spatial extent—of the stochastic catalog are shown in Figure 8. It should be noted that AIR’s stochastic flood event catalog contains a wide array of conditions and precipitation not fully captured by the historical data, and therefore there is a wide range of flood events with regard to scale and distribution.
Managing U.S. Flood Risk
AIR’s event definition algorithm satisfies the goal of having a consistent and yet flexible framework to organize flooding instances into sensible groups that realistically reflect characteristics of historical flood events. With AIR’s U.S. flood event algorithm—which is fine-tuned to work well for the United States, with consideration and review of the country’s meteorological patterns, topographical features, and flood characteristics—insurers can assess and manage their risk from all sources of flooding across the contiguous United States with confidence.
