


Managing U.S. Flood Risk: Part III, AIR’s Precipitation-Induced Flood Vulnerability Framework
May 26, 2020
Editor's Note: AIR Currents is featuring a four-part series on modeling and managing U.S. flood risk. Part I focused on the additional capability of managing hurricane-induced flood risk with the updated AIR Hurricane Model for the United States, and Part II discussed the new pluvial component of both the updated U.S. hurricane model and the AIR Inland Flood Model of the United States. Part III discusses AIR’s enhanced view of flood vulnerability through our new precipitation-induced flood vulnerability framework shared by both the updated U.S. inland flood and hurricane models, anticipated for release this summer; in Part IV we will quantify U.S. flood risk from all sources—tropical and non-tropical precipitation and coastal storm surge—for all lines of business as we transition from an insurable ground-up view to an insured gross view of flood risk.
The United States has been affected by extreme precipitation events that inflicted severe flood damage to residential and non-residential buildings. In 2017, Hurricane Harvey—the costliest U.S. natural disaster after Hurricane Katrina in 2005—caused widespread flooding in Texas, impacting buildings located inside and outside the 100-year FEMA flood hazard maps (A and V zones). Recent non-hurricane flooding events, such as the 2016 Louisiana floods, have similarly captured industry attention.
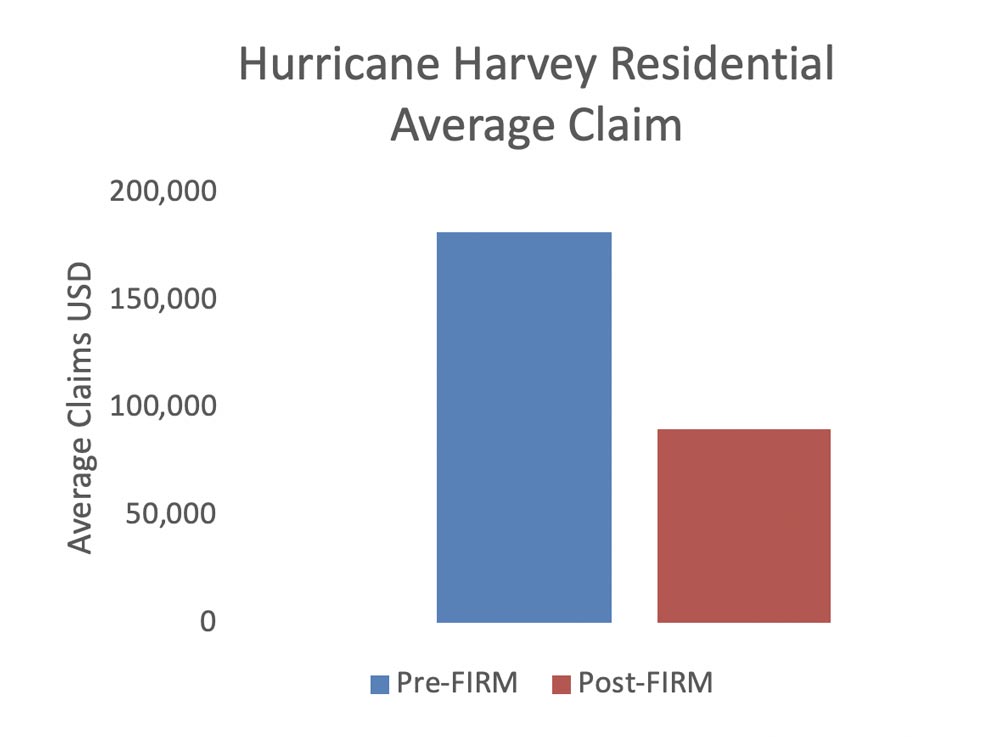
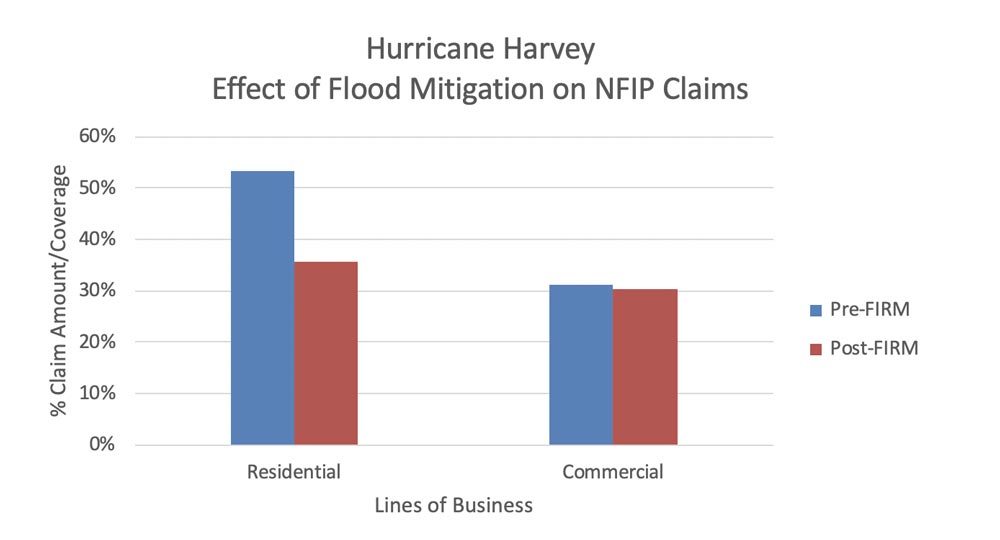
Flood claims data from events such as Hurricane Harvey indicate that there is significant variation in building vulnerability by region and year built in the United States. Data from the National Flood Insurance Program (NFIP) shows that the highest loss-causing residential claims in Texas came from older, slab-on-grade founded buildings built before flood mitigation practices were established. The average claim in the State of Texas for newer single-family homes built inside the FEMA 100-year flood hazard zones were approximately 33% lower than for homes built elsewhere and not employing post-FIRM mitigation practices (Figure 1). Commercial claims for the State of Texas, however, indicate less variation of vulnerability by year, where new and older buildings observed similar failures that resulted in damage of flood barriers and services. Most of the commercial buildings in downtown Houston enacted dry and wet floodproofing flood mitigation practices after Tropical Storm Alisson in 2001.
Many features contribute to a building’s flood vulnerability or resilience and must be considered when determining how much damage water will inflict. Of particular importance is the height of the first floor and the choice of the foundation type employed in the construction of the building. The location of service equipment, which includes mechanical, electrical, and plumbing systems, plays a vital role in the serviceability of the building and can exacerbate the extent of flood damage, depending on the mitigation strategies employed or lack thereof in shielding the building from flood damage. The construction date of a building also informs its flood vulnerability, as it directly points to the design codes that might have been employed in its design and construction; these codes vary both spatially and temporally. AIR’s new precipitation-induced flood vulnerability framework takes these features and many more into consideration to accurately quantify the flood vulnerability of both residential and commercial buildings. The same framework underpins the flood module in the updated AIR Inland Flood Model for the U.S. and the updated AIR Hurricane Model for the U.S., both of which are anticipated for release this summer.
Quantify Flood Losses from All Sources of Precipitation with a Detailed Component-Level Framework
AIR’s high-resolution pluvial and fluvial modeling provides seamless, physically based calculations of flood extents and depths. With these inputs, AIR designed a unified precipitation-induced flood vulnerability framework that functions at the component level to better capture how buildings respond to precipitation-related hazard from non-hurricane and hurricane events.
The vulnerability framework divides each building into key “floodable components” that represent the structure, equipment, and finishes, as well as the location of these components relative to the flood event water levels used in calculating the overall potential losses. Each of these components has underlying component-level flood damage functions, which are then aggregated to yield the building-level damage function based on the proportion of replacement value attributed to them. The component-level damage functions have been developed based on extensive in-house research following numerous damage surveys, available academic literature and access to claims data. Similarly, the component-level cost metrics have been obtained at a high granularity using data from Xactware® 360Value software.
 Navya Vishnu
Engineer I
 Raulina Wojtkiewicz
Senior Engineer and Senior Manager
 Karthik Ramanathan, Ph.D.
Assistant Vice President and Principal Engineer
Edited by Heidi Carrell, CEEM
When the representative building damage function is built with the component-level framework, we explicitly model secondary building features such as first floor height and impact of different foundation types, including the presence of a basement. In addition, other mitigation features are taken into consideration for structures such as engineered commercial and industrial buildings that follow higher standards. For example, if the risk to the structure is mitigated according to regulations, the model accounts for flood protection measures such as presence of a flood wall and for wet floodproofing practices such as protecting the equipment and contents in the floodable parts of the building by moving it to higher ground or by accommodating flood vents in the building. The vulnerability framework is flexible and supports more than 13 secondary risk characteristics, allowing AIR users more than 50 options for different combinations to refine your risk assessment.
Although the benefits of having detailed building attributes cannot be overstated, when secondary risk characteristics are not available, the flood vulnerability calculations incorporate regional data to build damage functions. The secondary characteristics are determined from an exhaustive study that accounts for variation in building code requirements, construction guidelines, and flood management practices by community and flood zone within each state in the United States. The next few sections in this article provide a glimpse of the aforementioned characteristics and the role they play in informing the flood vulnerability of buildings.
Impact of Community-Level Flood Regulations in Flood Vulnerability
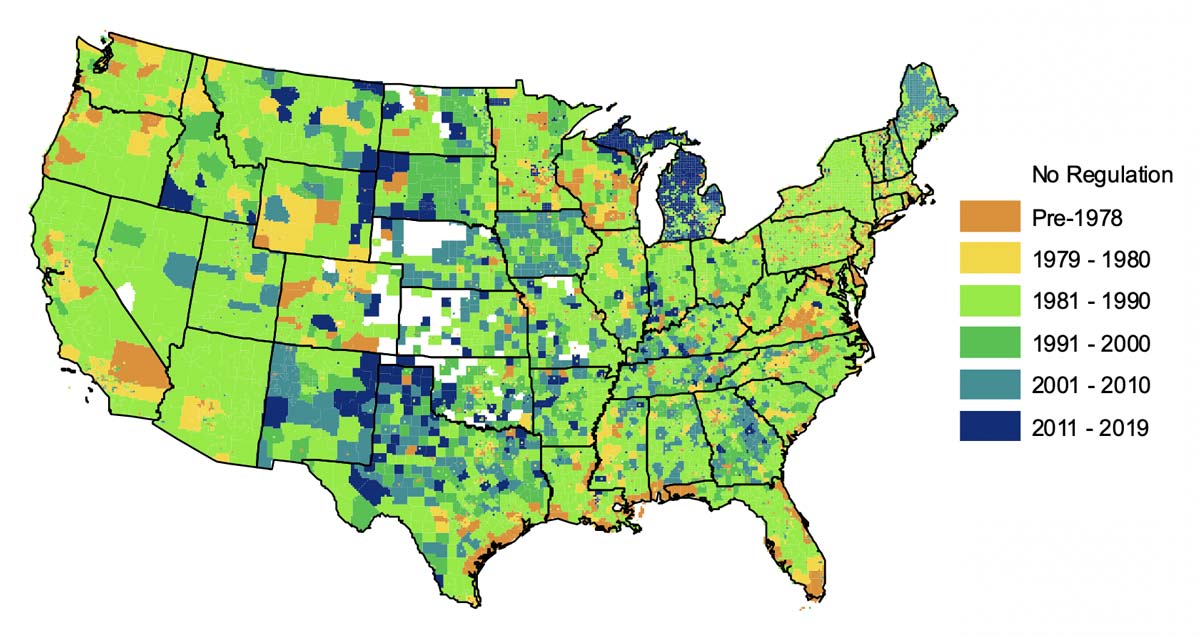
A distinguishing feature of the new vulnerability framework is the ability to capture the temporal and spatial variation by accounting for the year that typical flood management practices were enacted across the country. In the U.S., the adoption and enforcement of building codes and construction practices vary regionally; the years that flood mitigation regulations came into force are incorporated in the model by using a community-level adoption map as shown in Figure 3. Buildings constructed in communities after the enactment of these flood mitigation regulations are typically referred to as Post-FIRM structures. The current building codes such as the ones published by the International Code Council, including the International Building Code (IBC) and the International Residential Code (IRC), and the flood standards they reference, such as the American Society of Civil Engineers (ASCE) Standard 24, all use the National Flood Insurance Program (NFIP) guidelines for construction in special flood hazard areas (SFHAs). These SFHAs are areas within the 100-year FEMA flood-zone, demarcated using FIRMs, and require minimum standards for the elevation of the lowest inhabitable floor, enclosures or openings in the foundation, and protection of mechanical or other service equipment. Indeed, flood mitigation enforcement varies even within a state (as seen in Figure 3) since enrollment in NFIP and following the flood protection guidelines is voluntary for communities living outside the SFHA.
While most of these community-level flood mitigation practices, such as minimum floor elevation or foundation type requirements, target residential buildings, the flood mitigation practices that help commercial and non-residential buildings include protection of utilities and service equipment, wet floodproofing techniques, and construction of flood protection walls or levees.
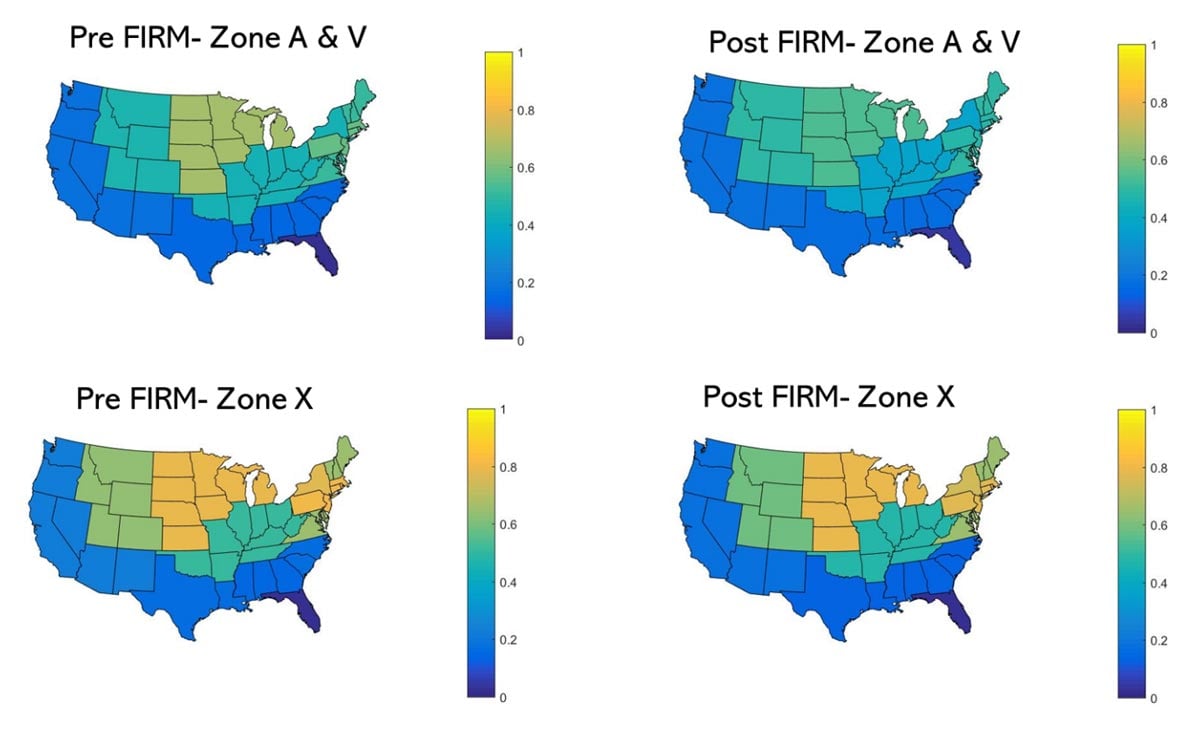
Capturing Regional Construction Practices by FEMA Flood Zone
One of the most impactful changes from FIRM adoption is in the difference in presence of basements between SFHAs (or mainly FEMA zones A and V), where enforcement is high, and outside SFHAs (Flood Zone X or other alphabetized zones), as shown in Figure 4. NFIP regulations require Post-FIRM construction in SFHAs to be built with their lowest livable floors located above the FEMA-defined 100-year flood elevation, commonly referred to as the base flood elevation (BFE); the presence of basements is discouraged. This is evident in the SFHAs where, post-FIRM adoption, basement percentages have decreased, while the proportion of buildings with basement in Flood Zone X or other alphabetized zones (outside SFHA) remains unchanged.
AIR’s precipitation-induced flood vulnerability framework accounts for all these regional variations by creating distributions of primary and secondary risk characteristics based on state, flood zone, and year built.
Considerations for Modeling Large Industrial Facilities
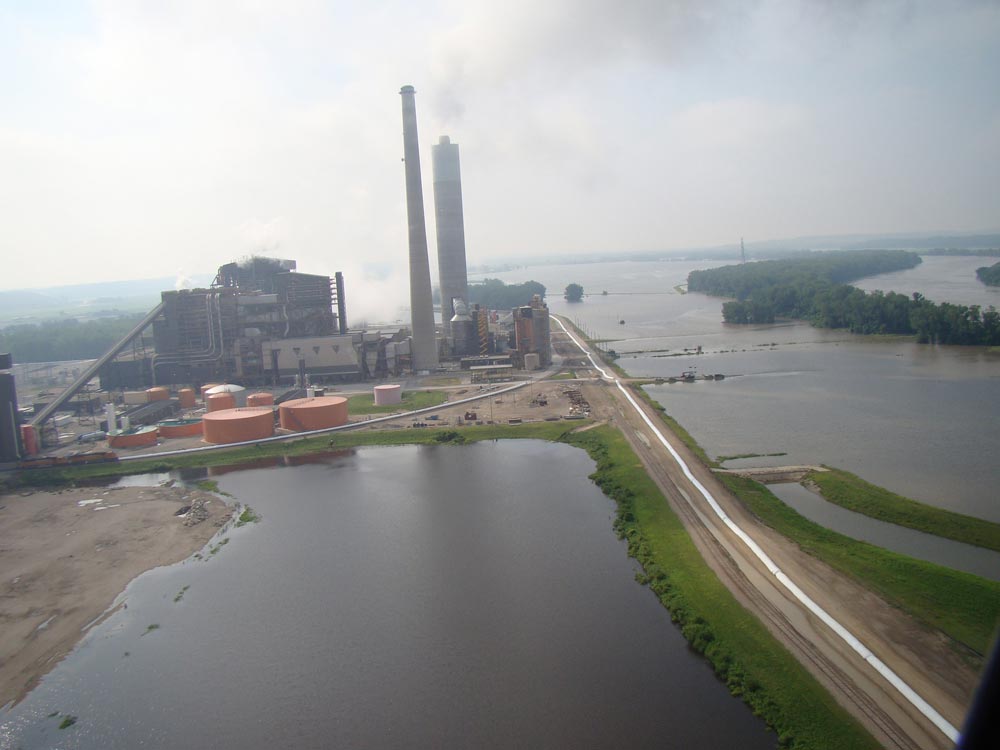
In addition to severe damage to residential and commercial buildings, specialty lines of business are also very vulnerable to flooding. Moving floodwaters, from Hurricane Harvey (2017) in Texas and Hurricane Florence (2018) in North Carolina, collapsed multiple bridges and roads. In addition, severe damage to industrial facilities inadequately protected to higher levels of flooding was also observed and caused very high business interruption losses. AIR models support specialty lines of business, such as marine risks, infrastructure, large industrial facilities, and automobiles.
One of the biggest challenges in modeling specialty lines of business such as large industrial facilities is understanding the level of flood protection to which the structure has been designed and constructed. Typically, structures critical to the resilience of society, including power plants, water and wastewater treatment facilities, and large manufacturing facilities, to mention a few, adapt design requirements well above those required by building codes and other local regulatory agencies. For example, power plants in the U.S. are designed to more stringent requirements that offer flood protection beyond the FEMA-specified 100-year flood design levels. In addition, such facilities have multiple contingency plans in place to mitigate flood damage in real time, including the activation of movable flood walls or gates, and to avoid potential risk of contamination.
To account for the different types of mitigation features, AIR’s new vulnerability framework assigns a minimum custom level of protection based on the facility’s risk category. AIR groups the facilities into two major classes: 1) Facilities with low and moderate contamination potential, such as heavy fabrication and assembly facilities and 2) Facilities with high contamination potential, such as chemical power plants that handle highly toxic substances that, if released, would pose a threat to the public and the environment.
To these two classes we assigned a minimum standard of protection of 100-year flood design levels for both pluvial (precipitation) and fluvial (riverine) hazard. Note that this level of protection mitigates the risk to these facilities from riverine flooding, acting as a custom flood wall or levee. For precipitation-induced flooding, it captures the protection of the drainage system, such as the use of retention ponds, which can absorb the rain that falls in the facility.
While the facility is designed for a specific standard of protection, it may fail at flood levels below that standard, or even withstand floods above the standard. The vulnerability model addresses the possibility that flood defenses for a large industrial facility will fail in a probabilistic framework, using fragility curves that indicate the probability of failure as a function of water depth as compared to the design capacity of the facility (the 100-year flood event).
The AIR model also allows you to override the facility standard of protection by assigning the flood height above the ground surface that the facility has been designed for, which gives you the flexibility to assess the risk at multiple protection levels.
Model Validation Leverages Recent, Extensive Loss Data Sets
Recent events have provided an abundance of claims data for precipitation flood damage across residential, commercial, and industrial lines of business. Access to actual loss data, in addition to AIR damage surveys, offered the model development team ways to validate the response of the built environment against the flood hazard and investigate if model assumptions, such as prevalence of foundation types and first floor height, are captured in AIR’s precipitation-induced flood vulnerability framework.
AIR validates each component of the model to ensure the most robust results. For validating precipitation-induced flooding damage functions, AIR collected vast amounts of data from such sources as the U.S. Federal Emergency Management Administration (FEMA), the Federal Insurance and Mitigation Administration (FIMA), and the U.S. Army Corps of Engineers (USACE).
In addition, the model leverages several loss data sets for model loss validation. Close to USD 70 billion of actual NFIP loss data were used in validating the model, taken from over four decades, from 1978 through 2018. To evaluate non-residential losses, the model relies on more than a decade of private market insured loss data assets from Verisk sister companies Xactware® and PCS®, as well as company claims data. AIR had access to more than USD 14 billion of commercial claims loss data, with more than USD 4 billion at the policy level from 4,200 policies.
Managing U.S. Flood Risk
The updated AIR Inland Flood Model for the United States and the AIR Hurricane Model for the United States, anticipated for release this summer, simulate both tropical and non-tropical precipitation realistically and together offer the industry a unified and comprehensive view of flood risk from all precipitation events never before available to the industry to help you enhance your risk management and resilience strategies and truly own your U.S. flood risk. These state-of-the-art models account for the unique circumstances across the country that contribute to flood risk, providing insurers with a highly detailed, physically based, probabilistic approach for underwriting and managing this complex risk. The heightened capabilities of the new precipitation-induced flood vulnerability framework underscore the importance of having detailed location-level exposure information, such as distance from waterways, type of foundation, first floor elevation, compliance with FEMA guidelines, and year built. Comprehensive and granular data will go a long way toward helping companies assess and manage their flood risk, producing more robust results at the individual and portfolio level.
