


2020’s Hurricane Season: Record-Breaking Throughout
Dec 15, 2020
Editor's Note: The 2020 Atlantic hurricane season exceeded expectations and proved to be extraordinary in several respects but did not inflict losses to match. In this review, AIR Principal Scientist Dr. Eric Uhlhorn evaluates this season's activity.
The year 2020 will be remembered for many things, not least for its highly active North Atlantic hurricane season. As early as December 19, 2019, University College London was forecasting above-average activity in the North Atlantic Basin in 2020, and all of the pre-season forecasts that followed, as well as their updates, expected an active season, but none of them anticipated just how hyperactive it would become. Collectively, the various pre-season forecasts expected 13 to 25 named storms, 7 to 12 hurricanes, and 3 to 6 major hurricanes (Category 3 and higher) to occur, compared to the 30-year (1981-2010) average of 13, 7, and 3 respectively. This year’s tropical cyclones exceeded even those expectations, becoming twice as numerous as the 30-year average and setting an unprecedented stream of records.
For the sixth year in a row, activity began before the official start of the hurricane season on June 1 when Tropical Storm Arthur formed on May 16. Storm development continued about 9 weeks ahead of an average season according to the National Hurricane Center, with each of the sequential storm names being accounted for earlier than ever before. The season’s initial hurricane often does not appear until August (for example, Hurricane Andrew made landfall in South Florida on August 24, 1992), but the first storm to reach hurricane status this year (Hanna) did so on July 25. Both 2018 and 2019 also saw hurricanes form in July.
 Eric Uhlhorn, Ph.D.
Principal Scientist
Edited by Jonathan Kinghorn, CEEM
The article:
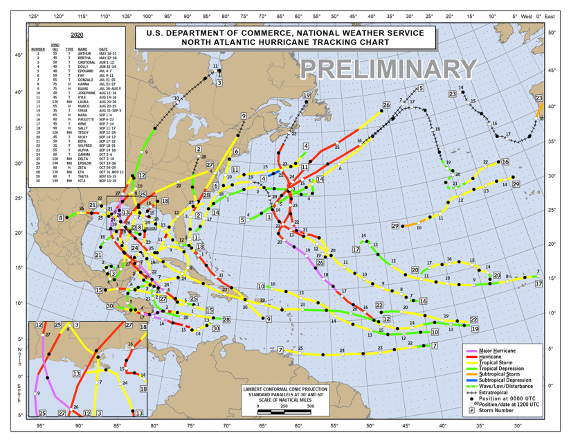
- This hurricane season saw many records set, including 30 named storms developing in the North Atlantic and 12 making landfall in the United States.
- Eight named storms struck the Gulf Coast, five of which made landfall in Louisiana, three of them hurricanes.
- Since 1979 only one other year (1995) has seen as many as 10 rapidly intensifying tropical cyclones.
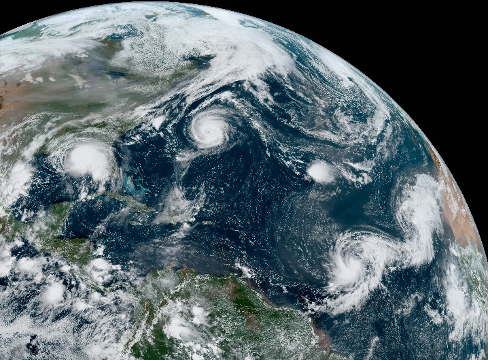
September, the middle of which usually marks the peak of the season, was a spectacularly active month. A total of 10 named storms formed—more than in any September on record. For the first time since August 1893, three named storms formed on the same day when Wilfred, Alpha, and Beta developed within the space of just six hours on September 18. And for only the second time on record, a total of five or more tropical cyclones existed within the basin simultaneously when hurricanes Paulette, Rene, Sally, Teddy, and Tropical Storm Vicky were active on September 14 (six storms were active on September 11, 1971).
Thanks to the early start to storm development this year and the number of systems that formed, the supply of allocated names was exhausted on September 18. Letters of the Greek alphabet were then used as storm names for only the second time since the current naming convention was introduced in 1954. The previous year in which Greek letters were called upon was the extremely active year of 2005.
And as well as starting early, activity continued unusually late into the season with Hurricane Iota, the latest Category 5 storm on record, attaining hurricane status on November 15. By the end of the official season, 30 named storms, 13 hurricanes, and 6 major hurricanes had formed; a record 12 of these named storms struck the U.S., six of which were hurricanes. In the reliable modern record, only 1985 and 2005 have had as many U.S. hurricane landfalls. In addition, the first named storm of the season, Arthur, bypassed the coast of North Carolina within 20 nautical miles of the Outer Banks delivering tropical storm force winds to coastal communities.
Rapid Intensification
This season has seen 10 rapidly intensifying tropical cyclones, which ties it with 1995 for the greatest number experienced since 1979. NOAA defines rapid intensification as an increase in the maximum sustained winds of a tropical cyclone of at least 35 mph in a 24-hour period. The 10 tropical cyclones were hurricanes Hanna, Laura, Sally, Teddy, Delta, Epsilon, Zeta, Eta, and Iota, plus Tropical Storm Gamma. Eight of these storms intensified rapidly in the Caribbean Sea or Gulf of Mexico, six occurred in early October or later—long after the typical seasonal peak—and several intensified rapidly shortly before landfall.
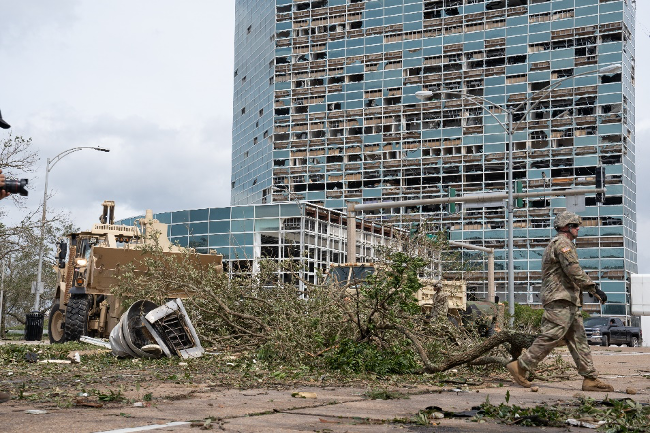
The most damaging hurricane to strike Louisiana was Laura, which intensified rapidly from Category 1 on August 26 to make landfall the next day in the southwestern part of the state as a high-end Category 4. hurricane. Its maximum sustained wind speed of 150 mph at landfall made it the strongest hurricane to hit the state since the Last Island Hurricane of 1856. Laura inflicted considerable wind damage and caused a fire at a chemical plant, but it moved through quickly, which limited the damage that could be done by its winds and precipitation. Storm surge was lower than anticipated and it didn’t penetrate far inland; densely populated areas such as Houston and New Orleans were not seriously impacted.
In only 1½ hours on September 14 Hurricane Sally intensified rapidly from a 65 mph (105 km/h) tropical storm to a 90 mph (140 km/h) Category 1 hurricane. It developed further into a Category 2 storm, weakened, and then re-intensified as it approached the coast. Sally made landfall the following day near Gulf Shores, Alabama, as a Category 2 storm with winds of 105 mph (165 km/h). Widespread wind damage, storm surge, and flooding occurred along the coast between Mobile, Alabama, and Pensacola, Florida, where more than 2 feet of rainfall was recorded.
As it approached the Caribbean Sea, Hurricane Delta grew rapidly in only 30 hours or so from a tropical depression to become a Category 4 hurricane (and the strongest Greek letter storm to-date) on October 6. Fueled by extremely warm ocean water temperatures, low wind shear, and sufficiently moist air above, this was the most rapid intensification recorded in 2020. After striking the tip of the Yucatan Peninsula on October 7 as a Category 2 hurricane, it weakened and then re-intensified from Category 1 to 3 as it moved northward across the Gulf of Mexico. Delta made its U.S. landfall near Creole, Louisiana, on October 9 as a Category 2 hurricane, a mere 12 miles from the location where Laura had struck six weeks prior. Much of the southeastern United States experienced heavy rain, strong winds, storm surge, and tornadoes from Delta.
Eta intensified from a tropical storm to Category 4 within 18 hours on November 2 to become the third most intense November Atlantic hurricane on record. The second most intense November hurricane was Iota just two weeks later. Iota intensified explosively just prior to making landfall in Nicaragua on November 17 as a Category 4 storm with maximum sustained winds just below Category 5 status and even stronger than Delta. The third most intense November Atlantic hurricane on record was the Cuba hurricane of 1932.
Inland Hurricane Risk
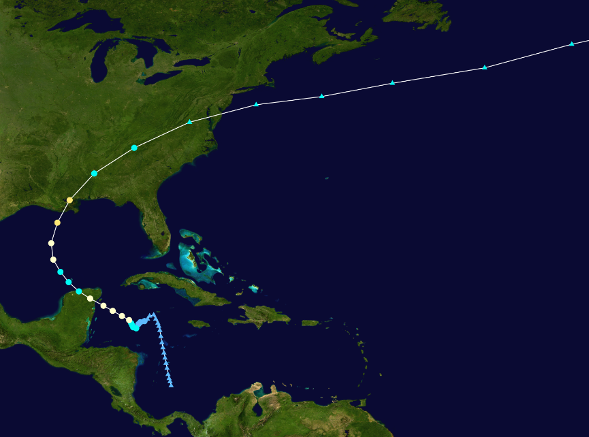
Hurricane Isaias made landfall in North Carolina on August 4 and tracked northeastward along the East Coast, spawning tornadoes and inflicting widespread wind damage as it passed through the Mid-Atlantic states and New England before transitioning to an extratropical cyclone as it moved into Canada.
Later in the season Hurricane Zeta made landfall in Cocodrie, Louisiana, on October 27, decayed into a tropical storm over central Alabama, transitioned into a post-tropical cyclone over Virginia, and its remnants crossed the New Jersey coast southwest of Cape May to return to the North Atlantic 24 hours after making its U.S. landfall. Zeta’s forward motion increased to 25 mph at landfall and accelerated as it traveled across the country. It had a relatively narrow band of wind damage, but its rapid forward motion enabled it to penetrate deeply, leaving a swath of destruction across Louisiana, Mississippi, Alabama, northern Georgia, upstate South Carolina, and North Carolina.
Ordinarily, once hurricanes move inland they lose the heat energy that fuels their development over the warm ocean waters and they weaken quickly into tropical storms or tropical depressions. Some tropical cyclones that make landfall in the United States, particularly those that strike farther north, do manage to retain hurricane-force winds as they track over land due to their forward speed and larger radius of maximum winds. Hurricane risk in the United States reaches as far inland as Tennessee and Kentucky, and as far north as the Great Lakes area.
Gulf Coast Hit Repeatedly
A salient feature of this season was the number of tropical cyclones that struck the Gulf Coast in general, and Louisiana in particular. Of the 12 named storms that made landfall in the U.S., eight hit the Gulf Coast; of these, three hurricanes—Laura, Delta, and Zeta—plus tropical storms Cristobal and Marco struck Louisiana’s almost 400 miles of coastline. It could have been even worse for the Pelican State because Sally and Beta had forecast tracks that included Louisiana but made landfall just across the state lines of Texas and Alabama respectively, missing Louisiana only narrowly.
This was the first time since records began in 1851 that five storms have hit Louisiana in a single season, but it is not unusual for the state to experience extensive hurricane activity. Between 1851 and 2004, of the 273 hurricanes that made landfall on the American Atlantic Coast 49 struck the state. Louisiana’s location makes it a prime target for landfalling hurricanes and in an active season in the Gulf it will likely experience more impact from hurricanes. And 2020 has been an unusually active season in the Gulf with conditions favorable for hurricane activity. For the first time since 1933, for example, there were two systems active in the Gulf simultaneously (Marco and Laura in late August).
Climate Signals and Climate Change
Several elements are essential for tropical cyclone development and intensification, the most important of which are elevated sea surface temperatures, weak vertical wind shear, atmospheric instability, and high moisture levels in the atmosphere.
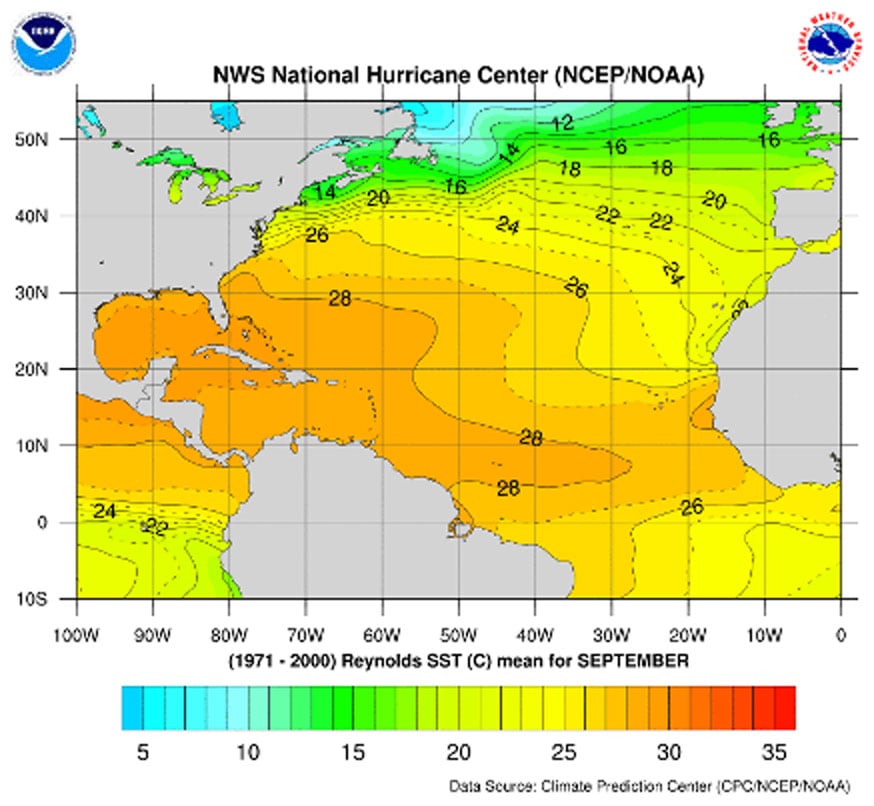
Following a transition to El Niño-Southern Oscillation (ENSO)-neutral conditions, in August-September 2020, a La Niña event developed in the tropical Pacific. This Pacific Ocean cooling led to lower Atlantic basin wind shear, supportive of enhanced TC formation. The Atlantic Multidecadal Oscillation (AMO) Index, a measure of the anomalous warmth of the Atlantic Ocean, correlates strongly with hurricane activity. It has remained in a warm phase since the mid-1990s. Sea surface temperatures in the Atlantic, Caribbean, and Gulf of Mexico were much warmer than the long-term (1981-2010) average all season; a greater number of severe hurricanes tend to form during the AMO’s warm phases than in its cool phases. In June and July the Madden-Julian Oscillation (MJO), which NOAA describes as “an eastward moving disturbance of clouds, rainfall, winds, and pressure,” became very favorable for Atlantic tropical activity. And this year has seen a persistent and strong negative phase of the North Atlantic Oscillation (NAO). The NAO reflects differences in surface sea-level pressure and impacts the intensity and location of the North Atlantic jet stream and storm tracks, resulting in changes in temperature and precipitation patterns. During negative phases of the NAO, Atlantic hurricanes are more likely to make landfall in the Gulf of Mexico rather than the U.S. East Coast, a feature of this year’s activity.
But there were also factors inhibiting hurricane development in 2020. Many of the hurricanes that impact the United States form in an area of the Atlantic known as the Main Development Region (MDR), as tropical waves emanating from Africa encounter tropical waters. For various reasons, this year tropical waves had a hard time intensifying in the MDR and most of the season’s hurricanes achieved this status beyond it. In addition, a massive Saharan Air Layer (SAL) developed in June, suppressing hurricane activity for several weeks.
It is generally expected that any effects of climate change would manifest themselves first in basin-wide activity, where the sample sizes are the largest and statistically robust signals would therefore be more evident. Science has not yet clearly identified exactly how anthropogenic change will impact tropical cyclone activity. Most modeling studies under projections of climate change have predicted a future with fewer total events but a higher proportion of the most extreme events. A small minority of models, however, have challenged that somewhat conventional outcome with predictions of increases in tropical cyclone frequency across the spectrum of event intensities. (All studies are subject to various uncertainties.)
Of course, the statistics of landfall activity are much more pertinent to property and casualty risk than basin-wide activity. Because of the small sample sizes of landfalling storms, any impact of climate change—already a gray area for influences on basin-wide activity—will be even more difficult to detect in the statistics of landfall. The recent historical record is simply too short to make statistically robust conclusions about the direction of these potential trends, especially when compounded by significant multidecadal variability (e.g., the AMO). And, while confidence is low from a wind-impact side, there is higher confidence that climate change will continue to increase precipitation because of warmer conditions and cause higher storm surge levels from continued sea level rise. Nevertheless, AIR continues to monitor the mechanisms underlying expected changes in tropical cyclone formation and evolution across all sub-perils, as well as changes in statistics with each additional season’s worth of data.
Uncertainty and Year-to-Year Variability
Despite the record-breaking number of storms that formed and hurricanes that made U.S. landfall, in terms of risk and loss 2020 is less significant in comparison to other active seasons, such as 2005, which were dominated by intense storms. Another measure of a season’s severity is its accumulated cyclone energy (ACE) index. The mean value of this index from 1981 to 2010 is 105.6 and the median value is 92.4. This season’s ACE score, however, stands at 180.1, most of which was accumulated in the latter half of the season when the strongest storms were experienced. This score is 75% above the long-term mean and at the upper end of pre-season forecasts; it places 2020 in the extremely active season category established by NOAA. Even so, the most active season on record—2005—accumulated a whopping score of 250.
While many of 2020’s U.S. landfalling storm systems were quick-hitting and/or comparatively weak, there were damaging storms, particularly Laura, Sally, Isaias, Delta, and Zeta. In 2005 four major hurricanes made landfall in the U.S., but in 2020 only one—Hurricane Laura—had major hurricane intensity at the time of its landfall (although Hurricane Zeta was just shy of major hurricane status when it came ashore). To put Laura in context, more than half (53%) of the years since 1900 have seen as many or more major landfalling storms in the U.S. Even if evidence eventually leads hurricane scientists to upgrade Zeta’s landfall to Category 3, a season with two major landfalls is also not all that rare (23% of historical years since 1900 meet this criterion). In 2020 there were three more named storms than in 2005, but the earlier season had two more hurricanes and one more major hurricane. And while 2020 saw more U.S. landfalls than 2005 (11 vs. 7), they struck less populated locations and most were less intense than 2005’s storms.
Even record-breaking levels of activity in the North Atlantic Basin do not necessarily correspond to major losses in the United States. In any given season there is no strong correlation between the number of tropical cyclones that form in the North Atlantic and U.S. landfalls. The 2010 season, for example, had the third highest number of named storms since 1851 (19) and the second highest number of hurricanes (12) but not one of those hurricanes struck the U.S. and only one tropical storm did so. And in some years, all it takes is one devastating storm bypassing or making landfall in a location with significant exposure for record losses to be experienced—Hurricane Sandy in 2012 for example.
A feature of this year’s season was the number of sequential events experienced—storms making landfall close in time and/or space to a previous event. Hurricanes Laura and Delta, for example, made landfall in Louisiana just 12 miles and six weeks apart. And Hurricanes Eta and Iota struck Nicaragua just 15 miles and two weeks apart. When two storms strike so close together damage from the second storm, even if it is weaker, will be exaggerated because it impacts as yet unrepaired damage from the first. The 2020 hurricane season demonstrated yet again the uncertainty and year-to-year variability in hurricane activity and the importance of considering multiple long-term views of risk.
AIR Models Account for “the Unexpected”
While this year’s hurricane season broke many records, the storms that occurred were accounted for in the stochastic catalog of the AIR Hurricane Model for the United States. If it can happen, it will happen at some point, and using a probabilistic model that has incorporated a complete range of physically possible storms can prepare you for that eventuality. In addition, AIR has conducted damage surveys after major storms and incorporated lessons learned into the damage functions of our model. Surveys following significant hurricanes in the past confirmed what we know about the kind of damage that hurricane winds and flooding can cause.
In terms of the number of storms, although this year was above average it could be prepared for with our probabilistic model. The potential landfall activity of 2020 still reflects the inherent uncertainty of losses in a given year, which our model accounts for. Insurers can leverage the forward-looking power of catastrophe modeling to not only accurately price hurricane risk, but also design incentives to strengthen the resilience of homes and businesses. Catastrophe models allow users to identify key risks and evaluate the efficacy of different risk mitigation strategies.
