


Modeling Fundamentals: Why Does AIR Conduct Post-Event Damage Surveys?
Mar 27, 2019
Editor's Note: This article focuses primarily on damage surveys conducted in the aftermath of U.S. hurricanes and addresses how and why we conduct them. As we update our U.S. hurricane model—a tool that helps quantify the risk—we uncover more questions that are typically answered only after studying another event.
AIR has a long and proud history of sending out engineering teams to conduct damage surveys in the wake of hurricane landfalls. Because hurricanes are infrequent, data are relatively scarce—particularly for older storms—so the main objective of these surveys is to gain knowledge and answer the ever-growing list of questions about these typically destructive natural catastrophes and the built environment’s response. And because no two hurricanes are alike, each survey has unique objectives ranging from building performance evaluations and footprint validation to modeling assumption confirmation and evaluation of the secondary features of the building stock. Many surveys are joint collaborations with members who are from various research institutions, or are industry professionals, claims adjusters, insurers, or contractors. These collaborations provide a broader perspective of each event and help us consider variables we may not have before.
The primary objective of all post-event damage surveys AIR conducts is to gain as much knowledge as possible from each event and use our findings to continuously improve our catastrophe models. In this article, we will discuss how we prepare for a survey; what the goals of our surveys are and what we aim to learn; with whom we collaborate and what each partner brings to the table; and some findings and insights from recent damage surveys.
Preparing for a Damage Survey
When preparing for a damage survey, we have to understand what aspect is unique about the event to most effectively learn from it and be able to apply what was learned to enhancements to our catastrophe models. For example: Sandy (2012) gave an excellent opportunity to study storm surge in a densely populated metropolitan area (Figure 1); Harvey (2017) demonstrated the destructive inland flooding that can accompany events that have stalled inland yet are close enough to the coast to draw in moisture from the ocean (Figure 2); and Michael (2018) gave us the first opportunity to study a design wind speed event. This last was of particular interest because major building code reforms were implemented in Florida after Hurricane Andrew in 1992 and the Florida Building Code was adopted in 2002 and has been continuously updated ever since.
 Sarah Bobby, Ph.D.
Senior Engineer
 Tim Johnson, Ph.D.
Senior Engineer
 Karthik Ramanathan, Ph.D.
Assistant Vice President, Principal Engineer
Edited by Sara Gambrill, CEEM
When we send a damage survey team out to study an event, we aim to have the team on the ground as soon as possible. We are fully aware, however, that the most important consideration after a natural catastrophe is getting the lives of people affected back to normal and showing the proper respect to not only the people who have been impacted but also their property. The efforts of cleanup crews who re-open roads, tarp roofs, and clear away debris to restore streets, neighborhoods, and towns to their pre-storm state are the top priority. Because the cleanup crews’ response is swift and what they clear away enriches our understanding of a hurricane’s impact, we know we have only a brief window during which to conduct our survey, so we isolate areas of interest fairly quickly—in part due to media coverage and in part due to our own research—so that we do not hamper the cleanup crews’ efforts in any way. As an event is forming and shifting closer to land, the research teams at AIR begin monitoring the event. Using preliminary modeled wind and surge footprints for the event, which are released to clients as part of an ALERTTM posting, in conjunction with the media’s damage reports helps us home in on locations worthy of study. Thus we can validate both the hazard modeling (intensity and extent) as well as the damage caused by different wind speeds or surge depths in affected areas. Damage surveys act as a natural laboratory to test the efficacy of our modeling assumptions, challenging them at times and validating them at others.
What Information Do We Leverage from Damage Surveys?
The goal for each damage survey of a U.S. hurricane differs based on the characteristics of the event and where landfall occurs, but we discuss some of the common goals in this section.
Hazard Footprint and Intensity Validation
When a storm is brewing in the Atlantic basin, we keep a keen eye on when, where, and how intense a storm will likely make impact. Some of the most important questions that need to be answered involve the hazard extent and intensity:
- How far do the damaging winds and storm surge extend?
- Is the damage consistent with the modeled wind speeds and/or surge depths?
- Are there anomalies not captured in the hazard footprints that can be explained?
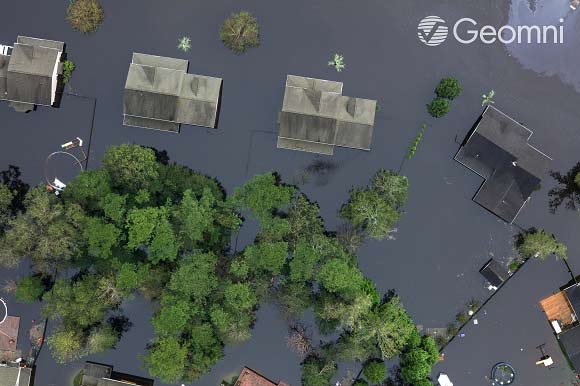
Because media attention tends to focus on the hardest-hit areas, it can be difficult to gauge the full extent of the storm and the impact to communities farther away from the spotlight without being on the ground. Our survey teams gather information concerning the extents of the damaging wind or surge field by intelligent location selection. Pre-survey evaluations using satellite imagery, media and social media reports, and aerial imagery from our sister company, Geomni (see Figure 4) can help narrow down the scope of potential survey sites.
One of the objectives of the damage survey conducted after Matthew (2016), for example, was to comprehend the extent and depth of the storm surge experienced along the South Carolina coast. While news reports focused on the areas around and between Savannah and Charleston, other areas along the coast also saw storm surge. To gather more comprehensive information about Matthew’s surge depth and extent, we traveled first to areas we knew had been affected to take surge measurements. But then we continued inland, often at the direction of local residents, taking measurements as we went until we stopped seeing surge markers. In this way we were able to validate both the surge depth at various locations and the footprint extent.
Understanding the Built Environment
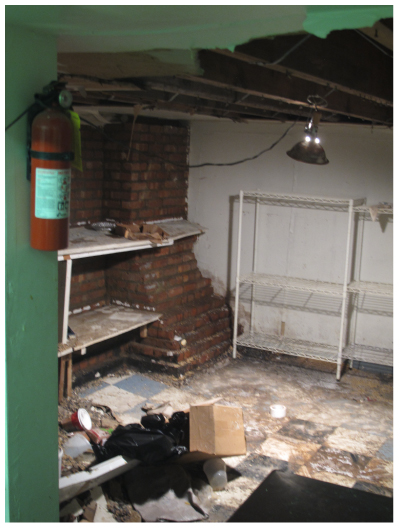
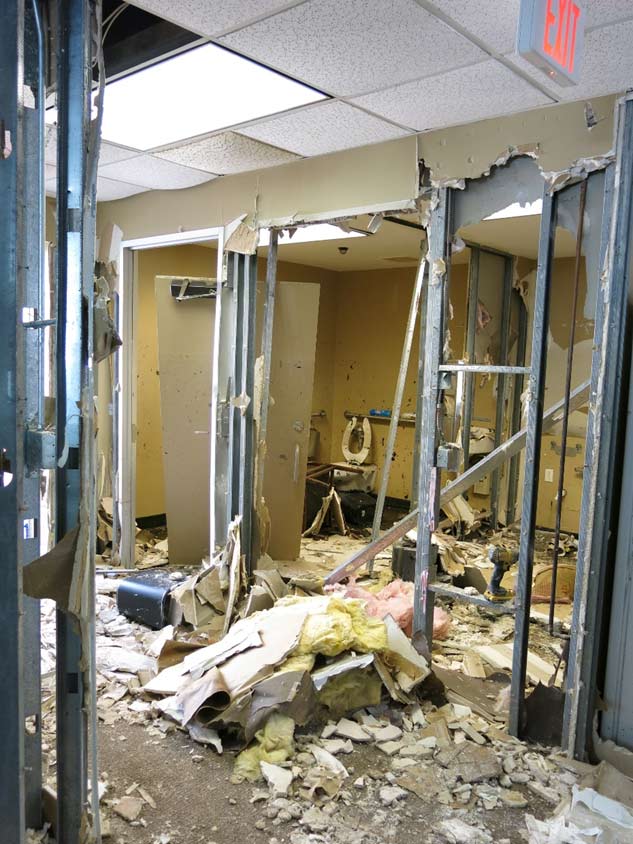
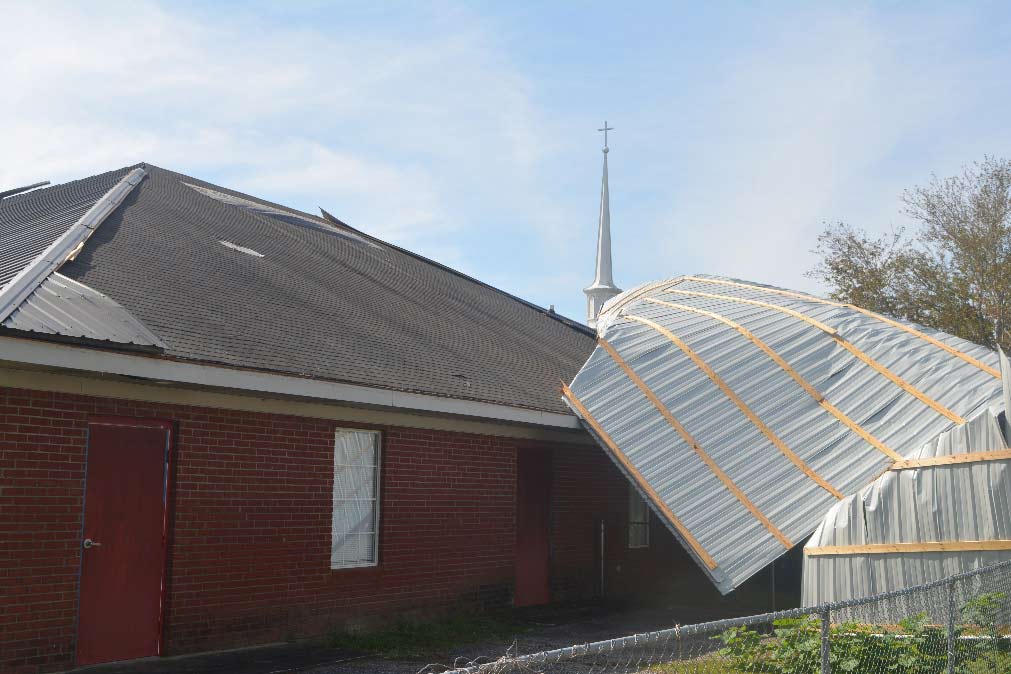
When conducting surveys, we keep an eye out for regional trends that may or may not be captured in our models. Secondary risk characteristics such as roof shape, roof cover type, opening protection type, and wall cover type can vary depending on the region. We can better recognize regional construction trends as well as installation practices after conducting damage surveys. For example, standing seam metal roofs have become increasingly popular, but how strong they are depends on the integrity of the fasteners. There are other trends a survey could reveal, such as re-roofing practices. During our Michael (2018) surveys, there were numerous observations of a metal roof having been overlaid onto an existing roof cover of an older home (see Figures 5 and 6). While this is allowed by the building code for existing structures under certain conditions, the execution may have been incorrect.
Building Performance and Modeling Assumptions
Significant research goes into building catastrophe models from both the hazard and engineering sides to develop the most up-to-date and comprehensive view of risk. Finding the engineering response to a meteorological hazard requires an understanding of both meteorology and engineering. Since it is impractical to model every possible configuration of a building or asset, it becomes important to make reasonable assumptions. Engineers group and classify the built environment based on the assumption that buildings constructed in a similar way under the same codes will behave in a similar way. By isolating the features that drive vulnerability, the building stock can be divided into vulnerability regions that reflect the building code adopted both regionally and temporally, as well as the design requirements and the necessary building features associated with those requirements. It is also important to note that there is significant variability in the response of similar risks under the same hazard, so there is usually a response distribution associated with each group.
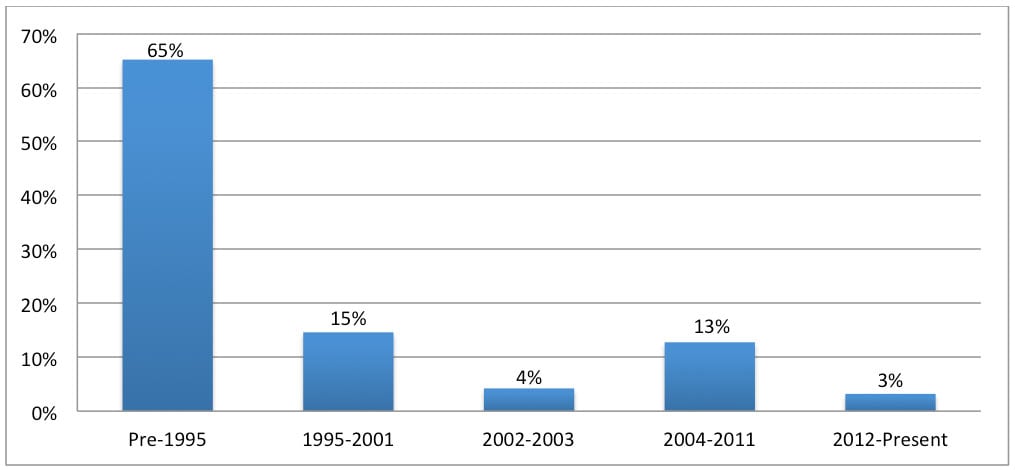
In many cases, the hurricanes are unprecedented in some way, for example, the impacted regions may never have experienced an event of that type and strength and only theoretical simulations were available to quantify their impact. Classifying the building stock for hurricane-prone states offers a theoretical expectation of how the building stock will perform in the event of a future hurricane (Figure 7). An actual hurricane tests how the model performs and helps determine if the assumptions made are valid. A damage survey helps reconcile model expectations with ground truth.
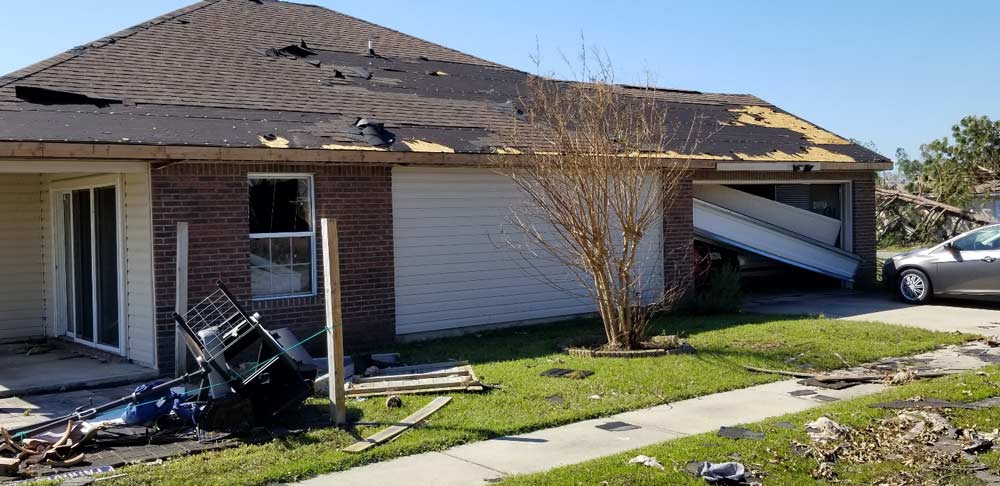
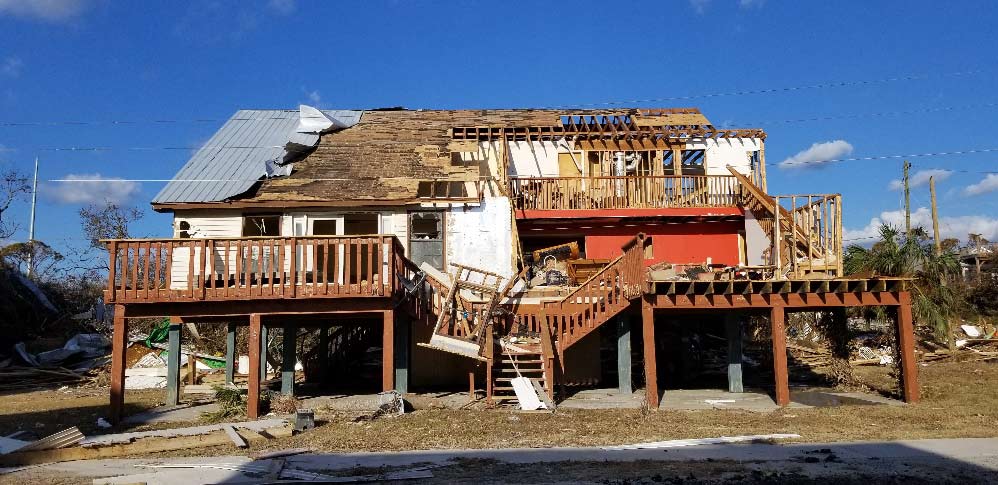
The enforcement of building codes is another important factor in determining vulnerability. Consistent failure modes or poor construction practices can be verified in the field. The requirements for opening protection or lack thereof can be validated as well. Michael (2018) is a good example of a hurricane that struck a region that had reduced the window protection requirement per the building code and suffered considerably. A survey following Florence (2018), reinforced our understanding of the window protection requirements in North Carolina, which differ from those of bordering states. Harvey (2017) taught us more about the variation in construction quality and how this can impact structural vulnerability.
Evaluating the performance for less common exposures, such as large industrial facilities, hospitals, or even high-rise buildings, gives us additional data points that are otherwise hard to come by. Very often, we may only see a handful, if any, of these risk types in an affected region, and many storms may not impact them at all. A few data points alone may not shed too much light on the exposure, but benchmarking those risks against other buildings in an area where there is substantial data helps inform the relative performance of a building class with respect to more common exposures. Maria (2017) helped us glean some insight with respect to performance of large industrial facilities.
Building stock in a given state represents the evolution of construction practices over the last 100 years or more at various points in time. The checkerboard of buildings illustrates the implementation of several building codes, construction, occupancy, and height groups, and there is an expected performance level associated with each. Most events may not have catastrophic wind intensities but may have significant rainfall. And building envelopes may appear intact but have considerable interior damage. Validating all aspects of the damage mechanisms at all intensities allows us to corroborate signals detected in claims and shed light on anomalies that might not be visible in engineered simulations. Very rarely do we see a design level event that allows us to evaluate the performance of building stock across many wind speeds and time bands and multiple damage states, but Michael was such a one.
Gaining Important Insights Through Collaborations
Collaborating with other researchers or industry professionals on a damage survey is mutually beneficial because each discipline brings a unique perspective. As catastrophe modelers, we aim to show the potential loss associated with an event; research institutions may be more interested in new mitigation efforts or very focused components; and brokers and insurers may be interested in gaining insights into the risk they write and parameters they look for to reduce loss potential. In some cases, collaborators want to survey a very specific line of business. For example, we found that, following Hurricane Matthew, manufactured home performance was of considerable interest to our damage survey collaborators.
Insurance Institute for Business and Home Safety (IBHS)
We conducted a damage survey in collaboration with IBHS following Florence in North Carolina. This collaboration helped us in two ways. First we gained insight into what aspects IBHS is interested in, such as the performance of the FORTIFIED program and some of the challenges they may face—for example, reconciling lab wind ratings of some products with actual performance in the field. Second, we gained more understanding of the FORTIFIED Program and how we can better characterize structures certified under that program in our models. It is difficult to encourage resilience in communities, such as the adoption of the FORTIFIED program, if the end-users (homeowners) are not incentivized. By incorporating the functionality and appropriate loss adjustments gained by FORTIFIED, a catastrophe model can quantify the impact of adopting the program, which allows insurers to appropriately price the risk and pass savings on to the homeowners. Ultimately, this kind of collaboration helps encourage more resilient buildings.
Insurance adjusters
AIR conducted damage surveys with insurance adjusters during the 2017 and 2018 hurricane seasons, which was educational for several reasons. First, we gained access to the interior of structures, which is uncommon during a typical damage survey, unless a building is public. This access allowed us to relate the damage we saw from the street to the damage observed in the interior of the structure and get a more complete picture of the losses we should expect. Furthermore, since the structures were virtually untouched at that point, we also gained a better idea of the level of contents damage associated with structural damage. Finally, since we were riding along with adjusters we were able to gain valuable insights from the people involved in the initial damage estimates. We acquired a better understanding of what is cleaned, what and how much is replaced, and insights into what policies will and will not cover. For example, if a ceiling is water damaged, how much of the drywall is replaced below the damaged ceiling? Knowing the answer to this is valuable to us because we are better able to understand the thought process behind the repair value.
Academic Research Institutions
AIR wind engineers are very often alumni of universities with strong research focused on hurricane risk. The wind engineering community is small compared to other disciplines. Collaborating with previous advisors and research groups allows us to maintain a solid connection to the latest academic initiatives as well as meet new members of the community. Joining larger groups increases the boots on the ground, which helps increase data points when crowdsourcing or canvasing an area. Collaborating can also often help us gain access to areas that might otherwise be closed to the general public in the immediate aftermath of a storm. In addition, these collaborations give us deeper insight into the research being conducted at universities and allow us to begin anticipating how we may incorporate new findings in our models. Following Michael and Irma, AIR engineers conducted surveys with members of the University of Florida’s Hurricane Research Center and the Structural Extreme Event Reconnaissance Network (StEER).
Surveys Are an Impetus for Model Enhancements
Natural disasters serve as a litmus test for building code effectiveness and often act as catalysts for significant code overhauls. In a similar fashion, damage surveys serve as an impetus for catastrophe model enhancements, as they provide insights gleaned from the field. There are many examples from the past 15 years when findings from our damage surveys led to U.S. hurricane model enhancements, but the following are just a few. The 2004-2005 hurricane season in Florida provided a treasure trove of granular data on the vulnerability of commercial lines. It also provided the perfect natural setting to test the impact of the building codes introduced in the post-Andrew and International Codes era, particularly the first edition of the Florida Building Code. After Hurricane Sandy unleashed its fury on dense commercial areas of Manhattan and brought to the forefront the complex nature of surge damage to these building assets, we applied our findings to build storm surge damage functions for the U.S. hurricane model that reflect a component-level framework for buildings and contents that integrates primary and secondary building features. We also were able to grasp the long tail that events of this type have on the business interruption losses to commercial lines of business. Findings after hurricanes Harvey and Florence served to enhance our understanding of the damage precipitation-induced flooding associated with hurricanes can cause, and we anticipate that our U.S. hurricane model will be updated to include precipitation-induced flooding in the summer of 2020.
Promoting Resilience
When conducting surveys, one element that is difficult to quantify as a metric is the impact on the people we encounter. Some are homeowners who have lost everything yet are grateful to be alive; others consider themselves fortunate to have fared better than expected. We encounter some who do not have insurance because they could not afford it or did not really understand the risk. The lesson for us is that hurricane risk involves people and their lives. While we aim to make models that reflect the risk, we can promote resilience and use the models to highlight the insurance gap. Being on the ground after an event reminds us why we do what we do.
