


Managing Central European Flood Risk: A Look Back at the 2010 Poland Flood
Jul 23, 2019
Editor's Note: AIR has released our updated Central European Inland Flood Model, which now includes Poland in its domain. This article examines the 2010 Poland Flood from a meteorological and loss perspective, and discusses how to manage flood risk in Central Europe probabilistically.
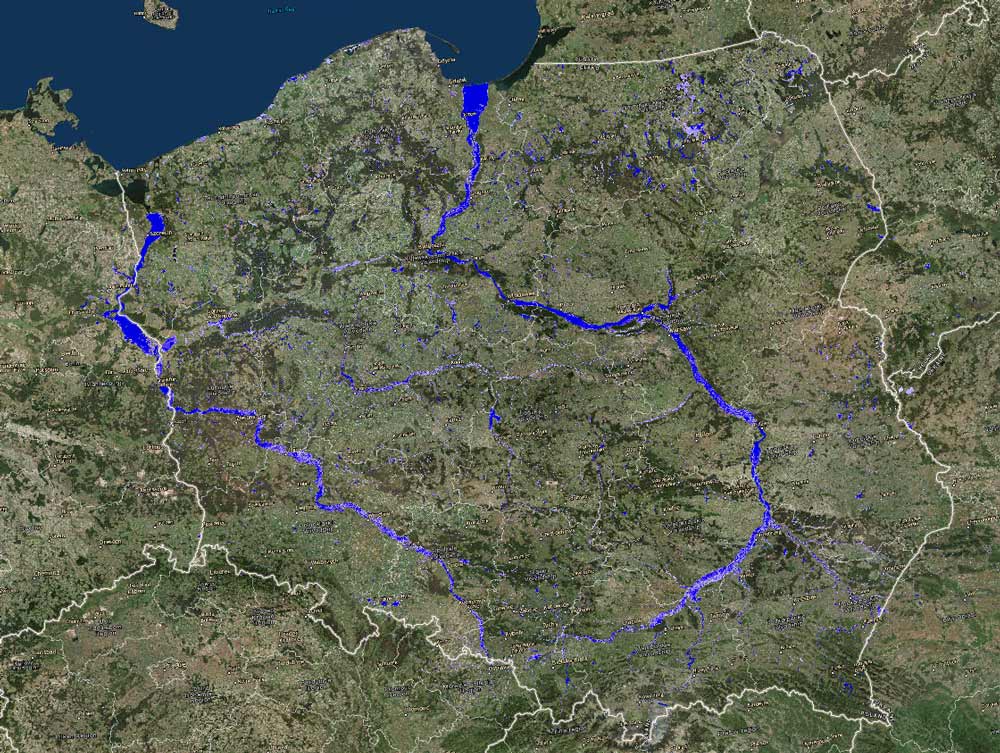
Flooding is by far the costliest natural hazard in Poland, representing nearly three quarters of modeled annual average insured loss when considered alongside loss from extratropical cyclones, severe thunderstorms, and earthquakes (Figure 1). In May and June of 2010, the country’s flood risk became evident as more than 0.8% of Poland’s entire geographical area was inundated by severe flooding on the Vistula and Oder rivers. With the newly expanded domain of the AIR Inland Flood Model for Central Europe, which now covers Poland, we can take a closer look at the 2010 flood, review the meteorological factors that led up to this event, study its impacts, and evaluate it within the context of the model’s 10,000-year stochastic flood events catalog.
How the 2010 Flood Unfolded
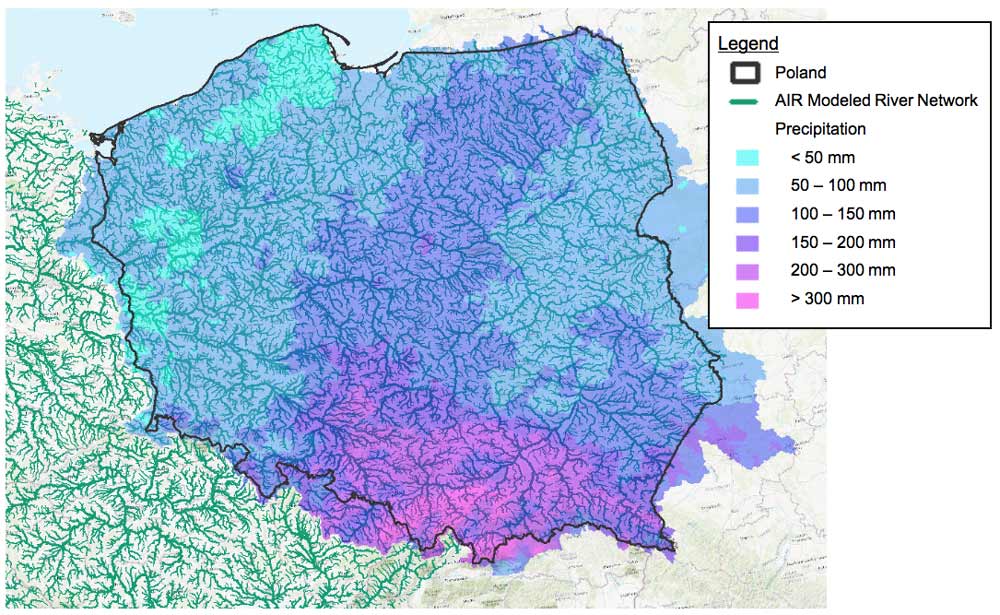
In the spring of 2010, two distinct and intense periods of rain resulted in severe flooding in Central Europe, heavily affecting Poland, as well as the Czech Republic, Slovakia, Hungary, Croatia, Bosnia and Herzegovina, Bulgaria, and Germany. The two periods of rain occurred between May 15 and 17 and June 2 and 4. The first period of rain was characterized by heavy and persistent rainfall in southern Poland from an upper-level low that moved very slowly through southeastern Europe and transported warm air northward from North Africa and the eastern Mediterranean. The air mass underwent strong cyclogenesis over the Adriatic (Bissolli et al., 2011), then further intensified when it collided with a subtropical air mass over the area. The surface low, named Yolanda by the Free University of Berlin, proceeded to drop precipitation amounts of up to 320 mm in Poland during the following three-day period. Orographic effects—produced from moist air that lifts over a mountain, which cools as it rises and forms clouds on the upwind side of a mountain ridge—played a major role in steering precipitation patterns from this system. These effects resulted in particularly high rainfall intensities on the north side of the Carpathian and Sudeten mountains, as northerly surface winds on the western side of the low resulted in uplift, causing heavy precipitation in these areas (Bissolli et al., 2011).
On June 2, an upper-level low pressure system brought heavy precipitation over southern Germany, also largely induced by orographic effects on the north side of the Alps. This system had become separated from a larger one over Northern Europe, then moved southward across the North Sea toward Central Europe, bringing further rainfall to the headwaters of the Vistula and Oder rivers. Areas in the foothills of the Alps in Germany experienced precipitation of up to 200 mm, and areas in southern Poland received up to 150 mm over 48 hours.
 Margot Doucet
Risk Consultant
Edited by Sara Gambrill, CEEM
Vb-Type Systems—A Common Culprit
The low named Yolanda, which brought the first and most significant amounts of precipitation to Poland, followed a track consistent with cyclones of the Vb (pronounced "five-b") type. Cyclones known as Vb cyclones are systems that move on a track from the Mediterranean region toward Central Europe, carrying a lot of moisture. These types of systems, related to summer season events, were also associated with devastating flooding in Central Europe in August of 2005 as well as August of 2002 and previous Oder flooding in 1997 (Nissen et al., 2013). Similar weather patterns were also associated with flooding in May and June of 2013 in Central Europe.
Extensive Flooding in the Vistula and Oder River Basins
On the Vistula River, water levels from the flood of 1997 were exceeded in some areas. In Krakow, water levels peaked at just under 10 meters, exceeding values observed over the past 40 years. Meanwhile in Warsaw, water levels peaked at 7.8 meters, representing the highest levels recorded since 1947, but just under a height warranting a “highly critical” designation from Poland’s Institute of Meteorology and Water Management. On the Oder River, high water levels peaked at values slightly below those seen in the summer of 1997.
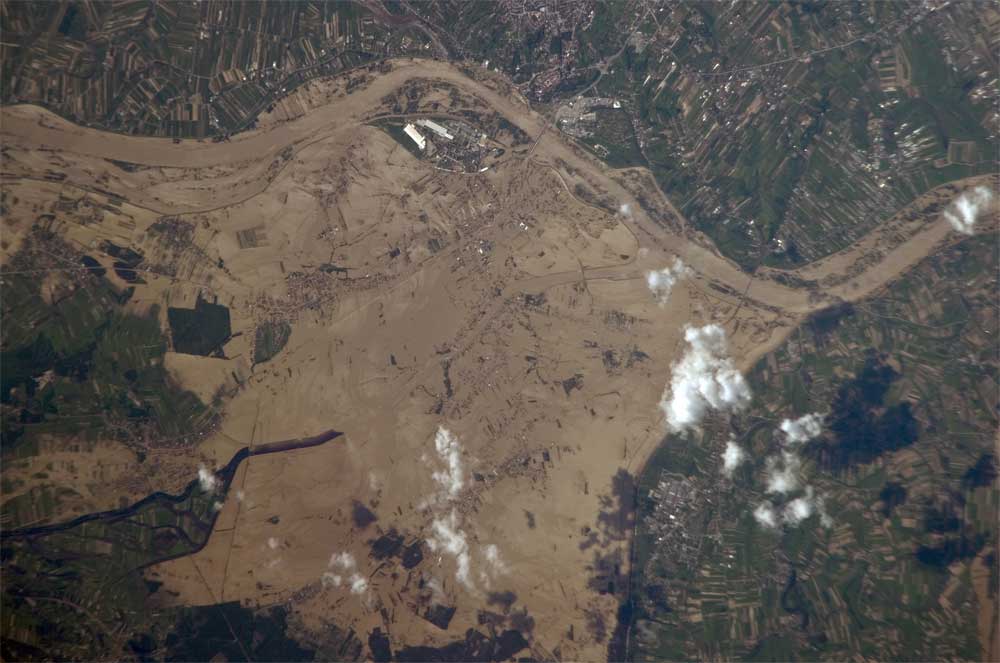
The timing of peak flow rates along the Oder spanned from May 18 in the headwaters to June 1, two weeks later, at the river’s mouth on the border with Germany (Bissolli et al., 2011). In Germany, on the western bank of the Oder, several hundred square kilometers of agricultural fields were flooded in Brandenburg’s Oderbruch region. In total, nearly 2,000 km2 were flooded in Poland, representing 0.8% of Poland’s total geographical area (Widla-Domaradzki et al., 2014).
Incurred Damage
As a result of dike-building following the 1997 flood, damage resulting from the 2010 flood in Poland was not as extensive as it could have been. For example, flood defenses had significantly improved since 1997 in central parts of Warsaw—and Frankfurt on the Oder in Germany—which were spared from extensive flooding. Nevertheless, the flooding led to 19 fatalities, affected more than 100,000 people, and caused economic losses reported to be between PLN 10 and 12 billion (EUR 2.5 to 3.0 billion), representing circa 1% of Poland’s total Gross Domestic Product (GDP). In particular, large areas northwest of Warsaw were flooded, including an area of roughly 80 km2 containing 24 communities. One of the most critically affected areas was the residential area of Kozanów, near Warsaw, which experienced multiple failures of flood defense systems; several new high-rise buildings were submerged in up to 1.5 meters of water. In rural areas, tens of thousands of people were evacuated. In terms of insured losses, there were 270,000-plus claims filed, which totaled more than PLN 1.7 billion (EUR 400 million) in payouts.
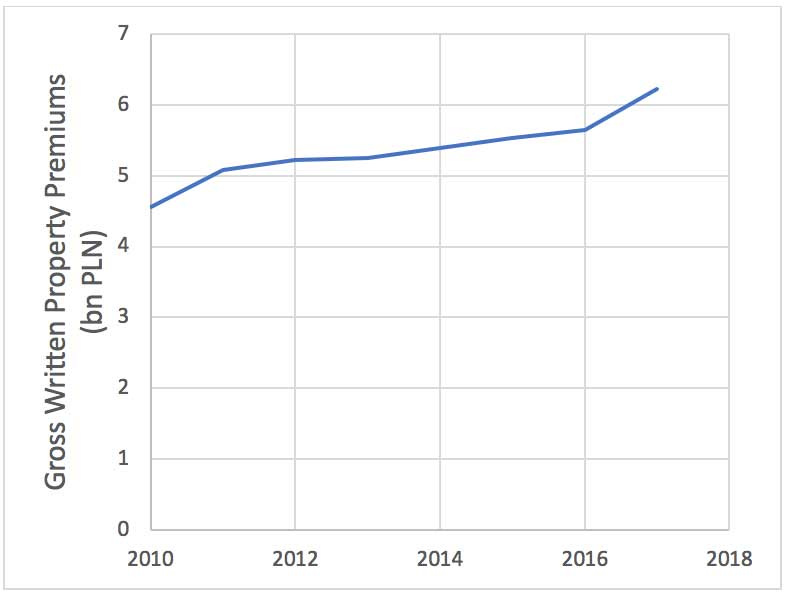
Between 2010 and 2017, the last year for which reporting statistics are available, total reported property premiums in Poland increased by 36%. This indicates a continuing trend of increasing property insurance take-up rates in Poland, reported to have tripled for residential dwellings since 1996 (Pollner, 2012).
A Present-Day Scenario
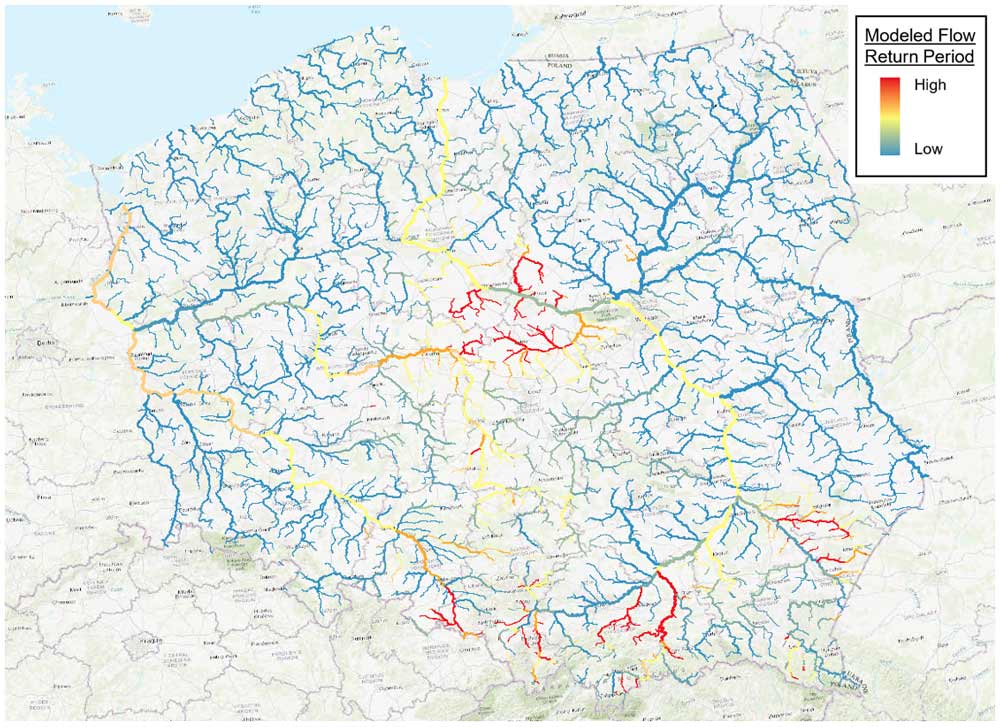
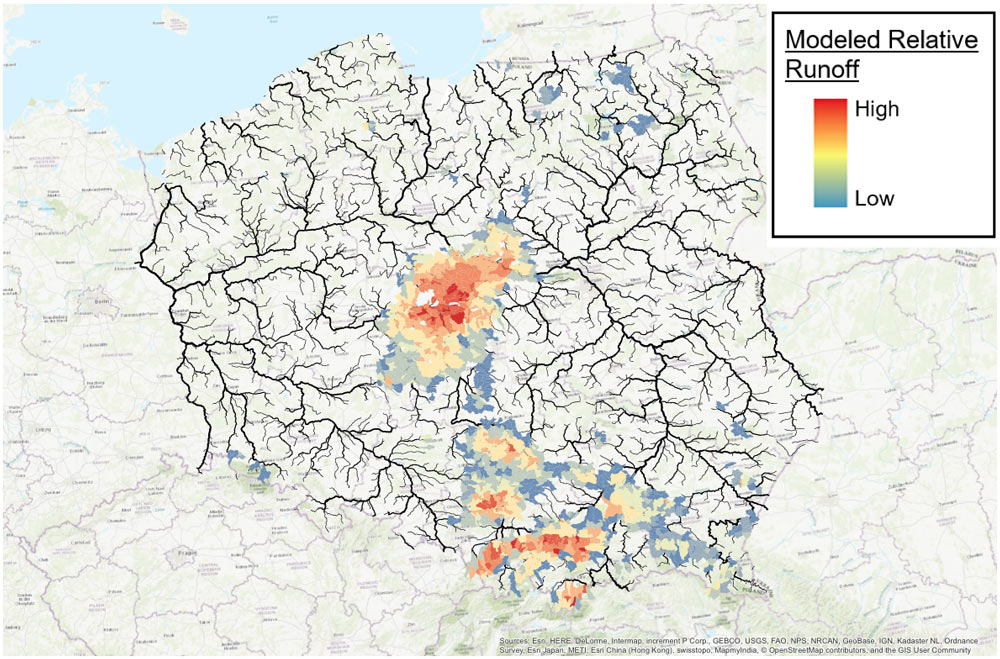
Estimating the losses and associated exceedance probabilities of historical events under today's conditions is an essential tool in risk management. In addition to supporting probabilistic loss analyses, the AIR Inland Flood Model for Central Europe includes a historical catalog of significant flood events. To model the present-day impact of a recurrence of the 2010 event, the AIR model captures the event's hazard both on and off the floodplain.
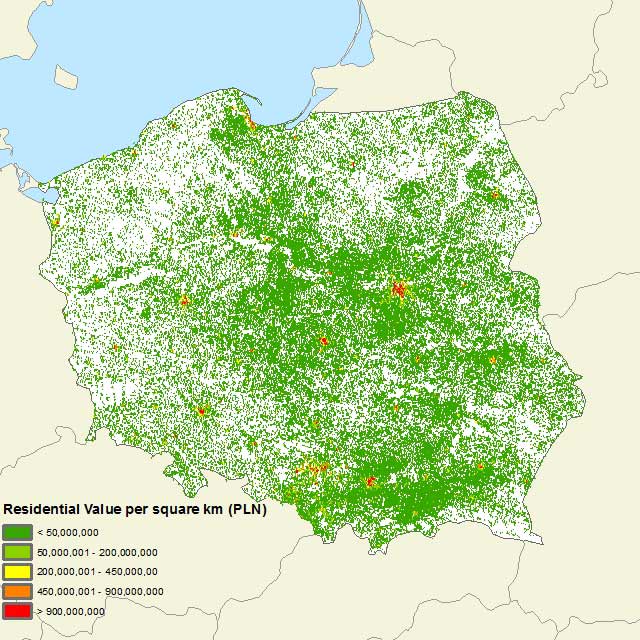
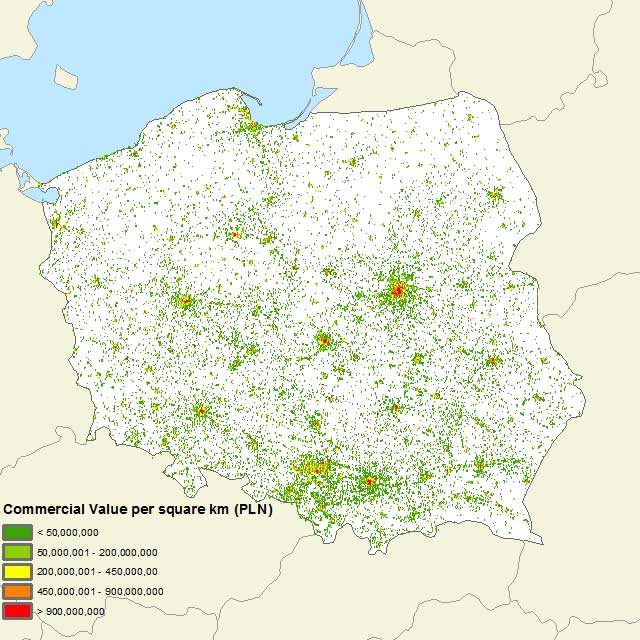
Using damage functions that capture the vulnerability of the local building stock, the model then calculates damage based on AIR's industry exposure database (IED), a comprehensive database containing the latest information on risk counts and replacement values for insurable risks in the residential, commercial, industrial, auto, and agricultural lines of business representing Poland’s insurable risks, including building characteristics and construction costs at a resolution of 90 meters.
Gross loss estimates were calculated using standard industry policy conditions currently found in Poland, with flood protection levels from 2010 given by the event’s observed footprint. Figure 8 shows the modeled gross insured loss footprints of the event at the CRESTA level.
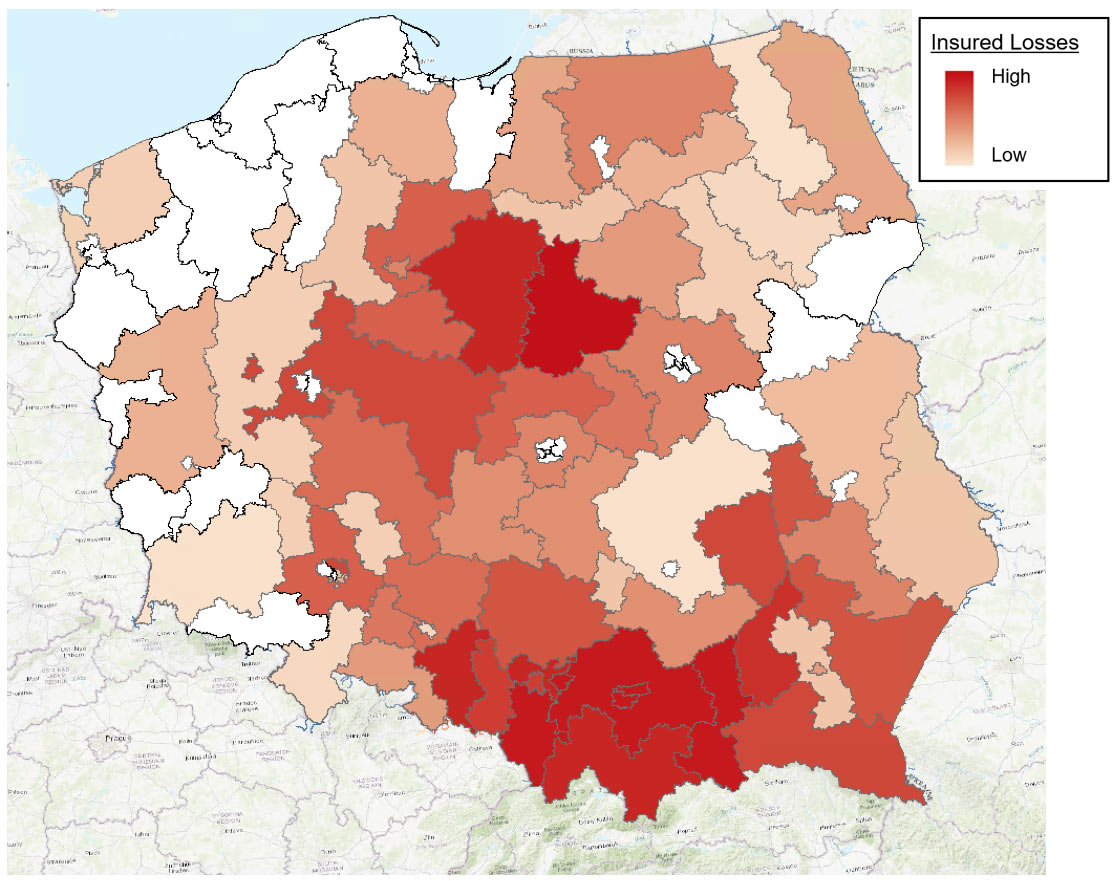
The 2010 flood event is not exceptional in terms of its frequency and insured losses. The recurrence interval is 25 years on an annual occurrence basis, according to the AIR model. Risk managers need to prepare for far more damaging floods in Poland and throughout Central Europe.
Managing Central European Flood Risk
Evaluating flood risk is a challenging task because the risk at a given location depends on many variables, including the continually changing characteristics of insured properties, such as new construction materials and building design practices, as well as understanding the severity, frequency, and location of potential flooding. A probabilistic approach is the only method that can account for all the complex variables associated with flood risk.
The AIR Inland Flood Model for Central Europe captures the complexities inherent in the flood generation process, such as the space-time patterns and correlations of rainfall input, snowmelt, antecedent soil conditions, the effects of a highly variable climate, topography, soil type, lakes, and reservoirs, as well as the effects of man-made flood defenses on flood risk. In addition to supporting user-defined custom flood defenses (in terms of both height and return period), users can take advantage of newly supported detailed risk characteristics, including floor of interest, presence of basement, first floor height, and custom elevation to complement the AIR model with their own view of Central European flood risk. The 10,000-year stochastic catalog contains 123,000 events that impact Austria, Czech Republic, Germany, Poland, and Switzerland. Stochastic events are congruent across all five countries and consistently conform to the 504 hours clause.
Precipitation events such as the flooding in the spring of 2010 in Poland are reconstructed in the AIR Inland Flood Model for Central Europe through the coupling of a Global Circulation Model (GCM) and Numerical Weather Prediction (NWP) model, which provides the framework necessary to generate realistic yet unobserved precipitation events. In addition to the stochastic catalog, the model provides historical events, including the 2010 flooding in Poland and six others (1997, 2001, 2002, 2005, 2007, and 2013).
Responsible risk management includes preparing for a wide range of loss scenarios. Using model scenarios to probe a portfolio's strengths and weaknesses will help companies prepare effectively before the next flood impacts Central Europe.
References
Bissolli, P., Friedrich, K., Rapp, J. and Ziese, M. (2011). Flooding in eastern central Europe in May 2010 – reasons, evolution and climatological assessment. Weather. Vol. 66, No. 6.
IMGW. (2010). Flooding in Poland – May/June 2010.
Nissen, K., Ulbrich, U. and Leckebusch, G. (2013). Vb cyclones and associated rainfall extremes over Central Europe under present day and climate change conditions. Meteorologische Zeitschrift, Vol. 22, No. 6, 649-660.
PIU – Polish Chamber of Insurance. (2011). Annual Report 2010.
Pollner, J.(2012). Financial and Fiscal Instruments for Catastrophe Risk Management: Addressing the Losses from Flood Hazards in Central Europe. World Bank Studies.
Widla-Domaradzki, L., Budzewski, M and Andruszkiewicz, O. (2014). Evaluation of the civil protection Mechanism Case study report - Floods in Poland 2010. Prepared by ICF International for the European Comission.
