


Earthquake Risk in New Zealand: A Major Model Update
Feb 21, 2019
Editor's Note: AIR plans to release a substantially updated earthquake model for New Zealand this summer (winter in the Southern Hemisphere). This article provides an overview of the enhancements to the hazard module, including a discussion on the innovative methodology and highest quality data used to enhance our ability to quantify seismic risk across New Zealand and how AIR models the newly added sub-perils of tsunami, landslide, liquefaction, and fire-following. (All magnitudes in this article are expressed in moment magnitude.)
Since the occurrence of the 2011 M9.0 Tohoku, Japan, earthquake, New Zealand experienced two significant and unprecedented earthquakes in the past decade, necessitating a reassessment of seismic risk in the country. The critical lessons learned from the September 2010 M 7.0 Darfield earthquake—and its major aftershock, the February 2011 M6.2 Christchurch earthquake—and the November 2016 M7.8 Kaikoura earthquake, as well as worldwide earthquakes such as the 2011 M9.0 Tohoku, Japan, earthquake, have served to inform AIR’s views of seismic risk in New Zealand. These lessons include newly gained insights into seismic hazard sources; multi-fault ruptures; the impact on short-, medium-, and long-term seismicity in an area that has just experienced an earthquake; trans-ocean basin tsunami risk; and liquefaction and landslide risk. AIR’s substantial update to the New Zealand earthquake model, scheduled for release this summer (winter in the Southern Hemisphere), incorporates innovative methodologies and the highest quality data available for the most comprehensive view of New Zealand earthquake risk. This article provides an overview of what informs AIR’s understanding of New Zealand’s seismic risk, the model’s enhancements to the shake component, as well as the four new modules included in the update for the following sub-perils: tsunami, landslide, liquefaction, and fire-following.
Modeling Time-Dependence and Multi-Fault Ruptures Critical to Understanding New Zealand Seismic Risk
Since the occurrence of the 2011 M9.0 Tohoku, Japan, earthquake, seismic risk in many subduction zones that have not experienced any megathrust earthquakes have required reassessment. While large earthquakes in the subduction zones of New Zealand are common, almost all the large subduction zone earthquakes there have occurred in the south, along the Puysegur subduction zone. The subduction zone in northern New Zealand, including the Hikurangi subduction zone and its northern extension in the Kermadec Trench, has not experienced any megathrust earthquakes (Mw > 8) in the known history. Seismologists have wondered if the lack of megathrust earthquakes in the Hikurangi Trench is due to aseismic deformation along the plate interface or because of the short historical record in the region. Recent paleoseismological studies have provided new evidence for megathrust earthquakes in the Hikurangi subduction zone in the recent geological history. Kinematic modeling of recent GPS data has provided additional information that can be used to constrain the location(s) of rapid seismic energy accumulation or aseismic deformation and the size of a potential megathrust earthquake in the subduction zone.
The latest national seismic hazard map released in 2012 was mainly based on data accumulated before the 2010–2011 Canterbury Earthquake Sequence and, obviously, before the 2016 Kaikoura earthquake. The fault source model used for developing the 2012 national seismic hazard map is primarily a characteristic earthquake model for a single rupture scenario for each of the mapped fault segments. But the 2010–2011 Canterbury Earthquake Sequence and the 2016 Kaikoura earthquake, a multi-fault rupture, not only changed the stress status of faults that ruptured during these earthquakes, but also changed the stress status of many other active faults in the region and thus the regional seismicity.
 Wenzheng Yang, Ph.D.
Senior Scientist, Research
 Andrew O’Donnell, CEEM
Senior Engineer, Research
Edited by Heidi Carrell, CEEM
The article:
• The updated AIR Earthquake Model for New Zealand incorporates the latest scientific research after the 2010–2011 Canterbury Earthquake Sequence, the 2016 Kaikoura earthquake, and worldwide earthquakes to provide the most current and comprehensive view of earthquake risk.
• The AIR model captures the time-dependency of future earthquakes that could impact New Zealand, accounting for the historical recurrence interval of earthquakes on known faults and the time since the last major rupture
• AIR’s unique view of seismicity includes large multi-segment rupture scenarios to simulate events similar to the complex rupture that was observed during the Kaikoura earthquake.
• Tsunami poses risk to New Zealand’s low-lying coastal exposure, and AIR’s is the first model to cover trans-ocean basin tsunami risk from distant earthquakes such as those off the western coast of South America
• The AIR model incorporates detailed soil data that inform site amplification from shaking, as well as risk from liquefaction and earthquake-triggered landslides
The Importance of Time-Dependent Modeling after Recent Quakes
The occurrence of large earthquakes on faults is inherently time-dependent, considering the complex dynamics of regional/local strain accumulation and subsequent release by earthquakes of different magnitudes on different faults. For this reason, AIR considered the most recent studies on prehistorical ruptures of crustal faults and paleoseismic records for the Hikurangi subduction zone in New Zealand, as well as the impacts from the 2016 Kaikoura earthquake, and developed a time-dependent view of rupture probabilities on active faults and subduction zones. The model captures the time-dependent nature of regional earthquake potential, considering the time-dependent rupture probability (TDRP) of all fault sources and regional background seismicity. The 2016 Kaikoura earthquake also demonstrated the importance of modeling the possibility of complex multi-fault ruptures that could produce earthquakes larger than one would expect based on the smaller rupture dimensions of single fault segments.
Modeling Multi-Segment Ruptures after Kaikoura
The 2016 M7.8 Kaikoura earthquake was the result of multiple cascading ruptures on several known and unknown faults at the southern margin of the Marlborough shear zone. The complexity of this earthquake’s rupture is highly unusual, given that the multiple faults involved in the rupture were not interconnected at the surface. Some scientists believe that this earthquake included ruptures on both shallow crustal faults and part of the deeper subduction zone fault. As a result of rupturing a large number of unconnected (widely spatially separated) fault segments at one time, the Kaikoura earthquake is considered one of the most complex ruptures ever. AIR’s unique view of seismicity considers large multi-segment rupture scenarios to capture similar complex and extreme events.
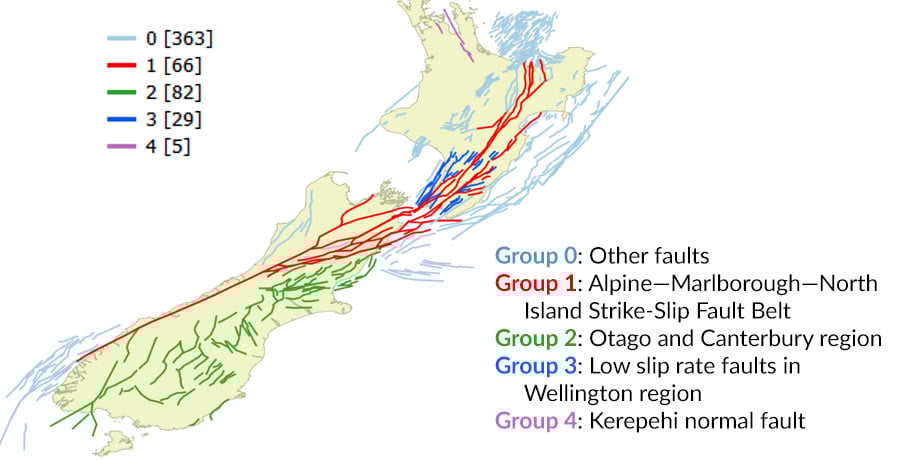
To develop our unique view of risk, AIR adapted the UCERF3 framework that determines potential multi-fault/segment rupture (MSR) scenarios based on various criteria such as fault spacing, orientation, and fault interaction (rupture triggering). AIR applied this methodology to process four groups of active faults categorized by fault features in New Zealand and prepared more than 1,000 possible MSR scenarios for generating our stochastic catalog (see Figure 1). This allows the model to capture complex rupture scenarios that would not be captured by traditional fault segmentation models.
Transient Elevated Localized Seismicity after the Canterbury Earthquake Sequence
On September 4, 2010, an M 7.0 earthquake struck 45 km (28 miles) west of Christchurch; dubbed the Darfield earthquake, it was the first in a more than year-long series of quakes that impacted the Canterbury region. The most damaging event in nearly 70 years, it occurred on previously unknown faults. Nearly six months later, in February 2011, an M 6.2 earthquake ruptured just 6 km (3 miles) from the city, causing even more violent shaking, devastating the central business district.
Promoted by the stress perturbation of the mainshock, aftershocks like this typically occur close to the mainshock rupture. Large earthquakes can also trigger damaging earthquakes on faults many kilometers away; however, not all mainshocks will trigger these subsequent quakes in a short period of time.
Seismic activity in the Canterbury region has been very high since the Darfield earthquake and after nine years it is still higher than it was before the Darfield earthquake struck. The Canterbury Earthquake Sequence underscores the importance of capturing the impact of change in the short-term and medium-term seismicity rate in areas that have been recently impacted by an earthquake when performing seismic risk analysis. The new AIR model includes time-dependent rupture forecasts for all faults, showing potential heightened risk in areas of major earthquake activity, from short-term aftershocks to medium-term elevated risk in areas such as Christchurch. The updated model includes a transient elevated localized seismicity option for users to see loss results both with or without the effect of this transient increase in seismicity.
Significant Updates to Ground Motion Simulation
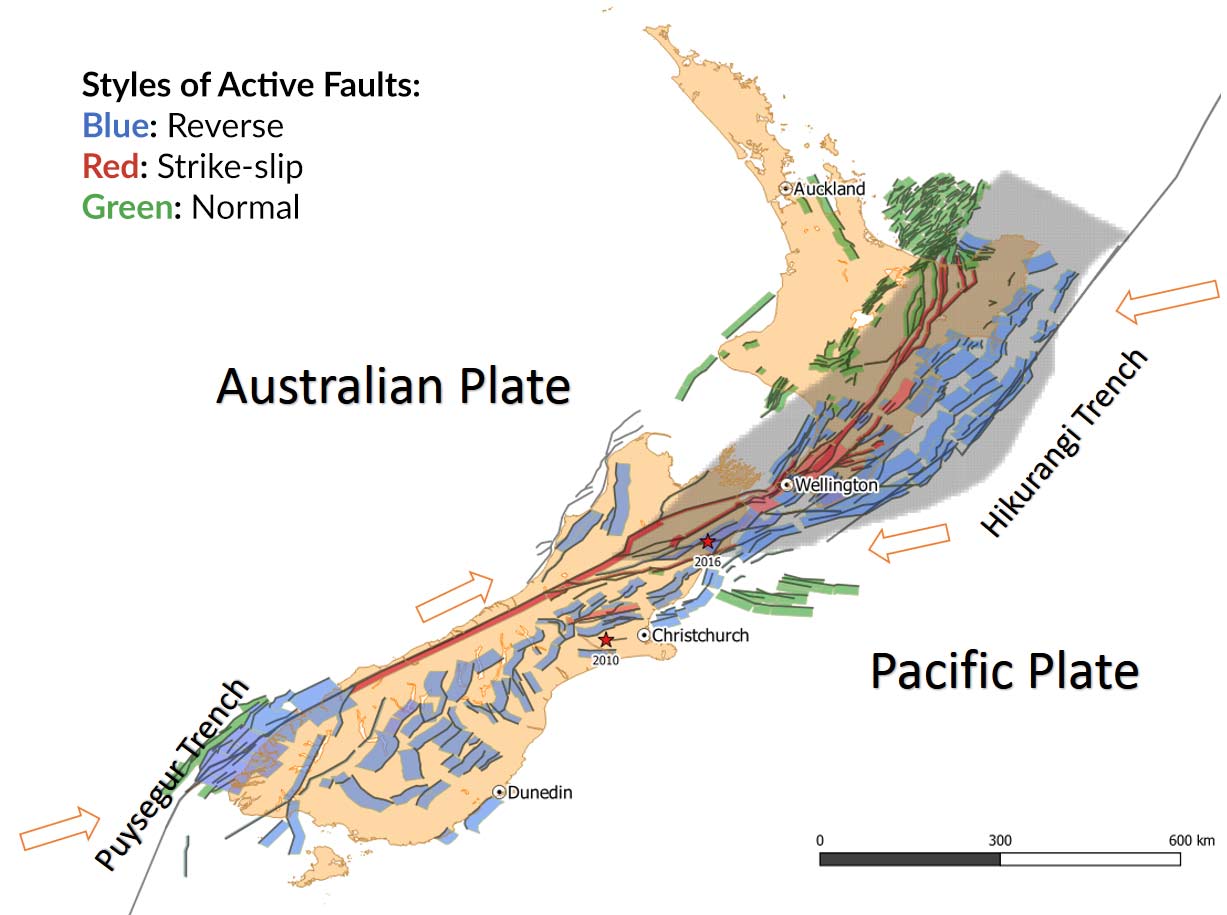
New Zealand has many types of faults and earthquake sources: subduction zone earthquakes in the Hikurangi and Puysegur trenches, shallow strike-slip and thrust earthquakes in the collision zone, and normal faulting earthquakes and volcanism in the back arc in North Island and northeast offshore (Figure 2). These different types of earthquakes can produce ground motion waves with different characteristics, so they require different ground motion models.
The highly oblique convergence between the two plates has led to the development of large-scale strike-slip faults in the collision zone such as the Alpine fault cutting across the South Island, and the Marlborough shear zone in the northern South Island. The oblique convergence has also led to the development of significant strike-slip faulting within the overriding plate of the subduction zone in the north due to strain/slip partitioning, a process widely observed in oblique convergent plate boundary zones worldwide. These faults pose significant earthquake risk as they are located on land and close to population centers. It is one of the main reasons for the country’s high earthquake risk.
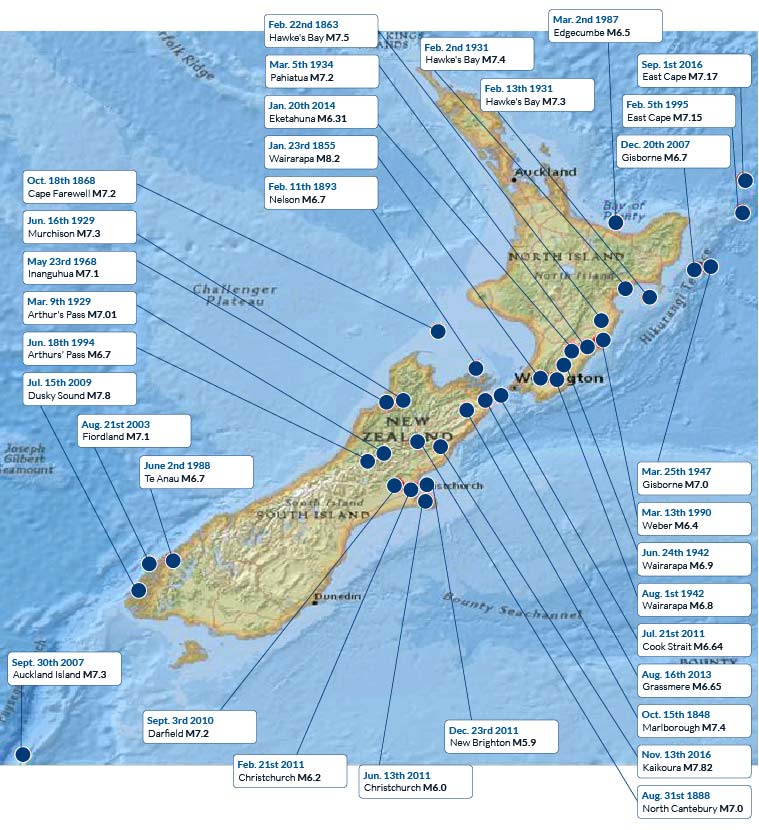
At least 20 earthquakes with magnitudes larger than 7.0 have occurred in New Zealand since about 1850, equivalent to more than once per decade (see Figure 3). The 1855 M8.2 Wairarapa earthquake, near the capital city of Wellington, was the strongest ever recorded in New Zealand, and significantly changed the coastline of the southern tip of North Island. The other notable New Zealand earthquake during the last century was 1931 M7.4 Hawke’s Bay, which was the deadliest in the country’s history.
Ground Shaking Calculations Account for Complexity
The ground shaking intensity in the updated AIR Earthquake Model for New Zealand accounts for the complex variation in regional tectonic settings and incorporates both local and global ground motion prediction equations (GMPEs) to account for the impact of epistemic uncertainty for ground motion modeling. The set of GMPEs used for each type of earthquake is selected based on detailed analysis of strong motion data from recent earthquakes to determine the goodness of fit for each GMPE relative to ground motion observations. The selected GMPEs and their associated weights were peer-reviewed by local seismologists to ensure that AIR’s ground motion model incorporated the latest scientific research relevant to modeling ground motion attenuation in New Zealand and to ensure that the model is consistent with the consensus of local scientists.
Capturing Local Site Effects with Updated Soil Maps
Besides understanding the complex seismicity of New Zealand, modeling the resulting ground motion must also explicitly account for the local site effects due to soft soil at shallow depth. An extremely high peak ground acceleration (PGA) was measured during the February 2011, M6.2 earthquake that struck Christchurch: 1.0g, which is more than double the 0.4g measured in the 2010 M7.0 mainshock. While in part due to proximity to the epicenter and complex rupture process, the more violent ground shaking in the aftershock was augmented by soft soils that underlie much of the city and its suburbs. Later, in 2016, the M7.8 Kaikoura earthquake produced seismic waves that traveled as far as Wellington, where soft soil deposits amplified shaking for longer period ground motions, resulting in disproportionately high damage for mid-rise and high-rise buildings.
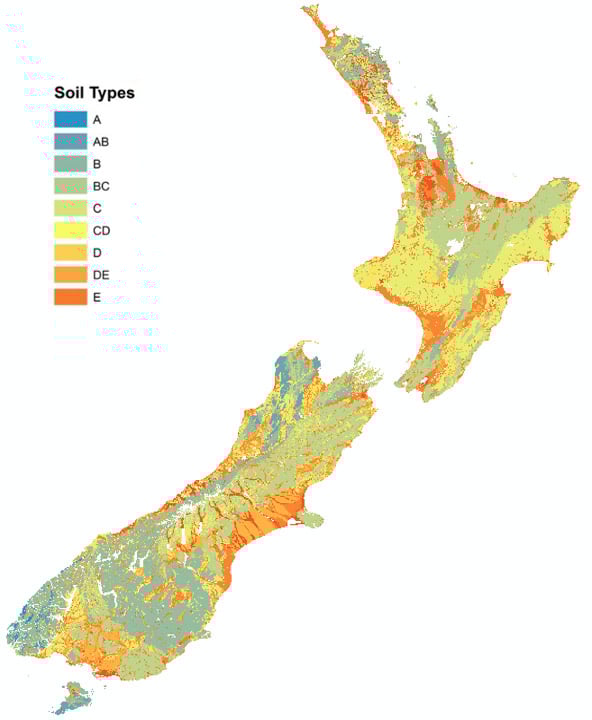
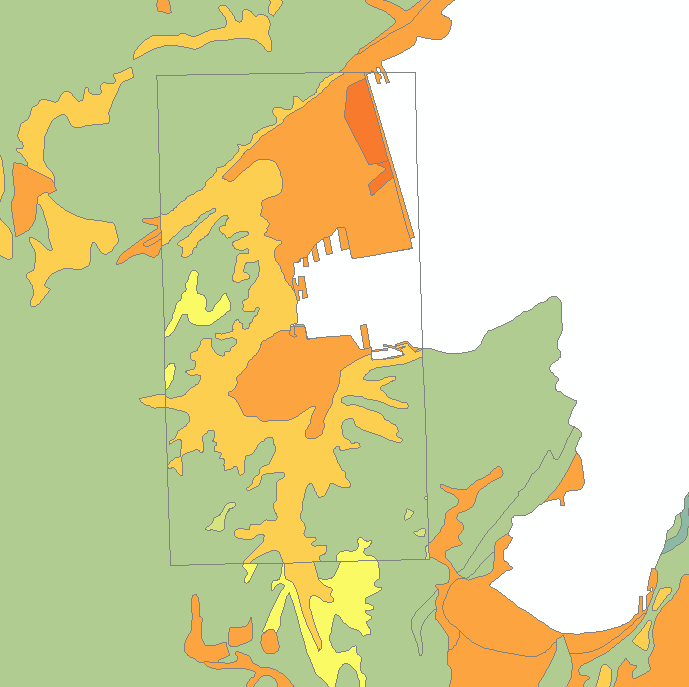
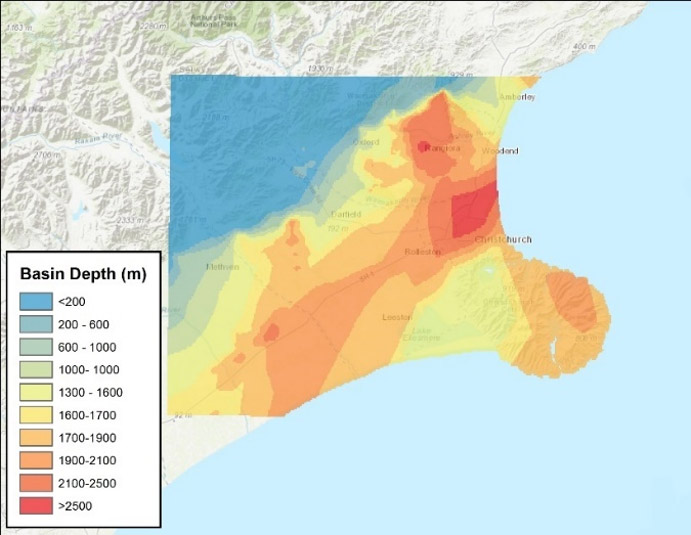
The maps for soil conditions at every location in New Zealand have been updated to incorporate the latest available data, including geological data, topographical data, and geotechnical data, with a resolution of 250 meters countrywide (Figure 4), and an even higher resolution of 25 to 50 meters in cities (Figure 5), to help pinpoint areas of potentially higher risk due to site amplification. The impact of sedimentary basins is explicitly captured for the Christchurch area using NGA-West2 GMPEs along with the latest 3D geological model for the Christchurch Basin (Figure 6).
Another important lesson AIR has learned from recent New Zealand and worldwide earthquakes is the significant impact of secondary hazards—including tsunami, landslide, and liquefaction—on loss. The updated AIR Earthquake Model for New Zealand includes modules for these sub-perils and more.
Newly Added Sub-Perils
Unique View of Tsunami Risk Accounts for Local/Regional and Trans-Ocean Basin Sources
A thorough review of historical tsunami records indicate that New Zealand is not only vulnerable to local and regional tsunamis but also to tsunami waves from distant trans-ocean basin earthquakes. While these events do not result in any ground shaking in New Zealand, they have the potential to significantly impact the coastal exposure of New Zealand, resulting in considerable losses. The country has experienced several tsunamis during the past 150 years, with some of the most significant ones resulting from large, distant earthquakes, such as those offshore Chile and Peru. Risk also exists from local sources: In 2012, the national seismic hazard model for New Zealand was updated to include scenarios as large as an M9.0 on the Hikurangi subduction zone based on the result of kinematic modeling and lessons the scientific community learned from the 2010 Tohoku earthquake in the Japan Trench.
AIR has developed the first probabilistic trans-ocean basin tsunami model, which includes not just local and regional events but also large far-field tsunamigenic earthquakes that can occur as far away as South America. AIR’s tsunami model uniquely simulates the origin, propagation, and runup of tsunamis to capture the risk to New Zealand’s dense coastal and marine exposure(s).
Landslide Module Considers Seasonal and Regional Conditions
While the risk due to tsunami mainly affects the coast, earthquake-triggered landslides pose a high risk across this mountainous country. Tens of thousands of landslides followed the 2016 M7.8 Kaikoura earthquake affecting the greater north Canterbury region. A major geological hazard frequently triggered by strong ground motion, landslides can cause destruction of buildings, roads, power lines, pipelines, and other exposures, as they did after Kaikoura. Larger cities built into hillsides, such as Wellington, face high landslide risk, should a significant quake strike the area. Newly supported in the AIR New Zealand earthquake model is a landslide module that incorporates slope steepness, as well as surficial, geology, and precipitation data at a 90-meter resolution to identify areas that could experience earthquake-triggered landslides.
Liquefication Module Provides Countrywide High-Resolution Coverage
Liquefaction occurs when loose, saturated soils lose strength and act as a viscous fluid due to intense shaking during an earthquake. Because so much of the City of Christchurch and surrounding suburbs were built on loose sand and silt deposits, there was an unprecedented amount of damage from liquefaction following the February 2011 M6.2 earthquake. Loose soils behaved like quicksand, causing structures to suddenly sink, tilt, or even topple. Cars sank, roads were impassable, buried utility lines and pipes shifted and broke, and earth structures and walls lost stability or collapsed entirely.
The AIR model provides countrywide coverage for liquefaction at 90-meter resolution. In major metropolitan areas, including Auckland, Wellington, Christchurch, and Napier-Hastings, liquefaction is modeled at 30-meter resolution. AIR has incorporated extensive local liquefaction and site-specific studies, damage surveys and claims data from recent New Zealand earthquakes, as well as lessons learned in the U.S. and Japan, to achieve a comprehensive picture of the country’s liquefaction risk.
Realistic Fire-Following Module Captures Ignition and Spread
The Hawke’s Bay (Napier) M7.4 earthquake in 1931 was New Zealand's deadliest natural disaster. After shaking destroyed a significant portion of buildings in the city, a conflagration destroyed the remainder of Napier’s business district. The severe shaking damage to the water mains in Napier made firefighting efforts virtually impossible. Fire-following earthquakes continue to pose a significant risk to cities. The fire-following module leverages the latest approach to modeling fire ignition and spread on individual city blocks, and accounts for the possibility of alternative water resources being used for fire suppression, to create a realistic view of the fire-following earthquake risk.
Managing New Zealand Earthquake Risk
The updated AIR Earthquake Model for New Zealand incorporates the latest scientific findings for earthquakes—including the Canterbury Earthquake Sequence and the more recent Kaikoura earthquake—and reflects the most up-to-date understanding of New Zealand’s seismic hazard. The latest geotechnical data and innovative methodologies were used in the development of the AIR Earthquake Model for New Zealand to ensure the most robust results possible, which have been extensively validated and peer-reviewed by local experts. With the newly added sub-perils, the upcoming AIR New Zealand earthquake model provides a more detailed and accurate view of the risk associated with the numerous impacts from earthquakes.
