


The 2018 Hurricane Season—Another One for the Record Books
Dec 19, 2018
Editor's Note: In this article, AIR Principal Scientist Dr. Eric Uhlhorn discusses this year’s notable Atlantic storms and records set this season, along with developments in forecasting and the value of modeling this peril probabilistically.
Although this year’s Atlantic hurricane season did not approach the record activity levels of 2017, and 2018 got off to a slow start, in September it became clear there would be no return to the “U.S. hurricane drought.” In fact, this year set some records of its own: Michael marked the third Category 4 hurricane to have made continental U.S. landfall in the past two years, after Harvey and Irma; five Atlantic named storms developed between September 1 and 12 to tie with the 1988 hurricane season for most Atlantic named storms on record between those dates; and seven of the Atlantic named storms that formed in 2018 were classified as subtropical at some point during their lifetime, surpassing the record of five in a single season set in 1969. In addition, both Florence and Michael set their own records, which will be discussed in their respective sections.
Overview
From June to August, cooler waters across the eastern Atlantic and strong wind shear over the Caribbean Sea inhibited storm development. However, as warming waters and more favorable atmospheric conditions prevailed in the Main Development Region (MDR) in September, hurricane activity geared up.
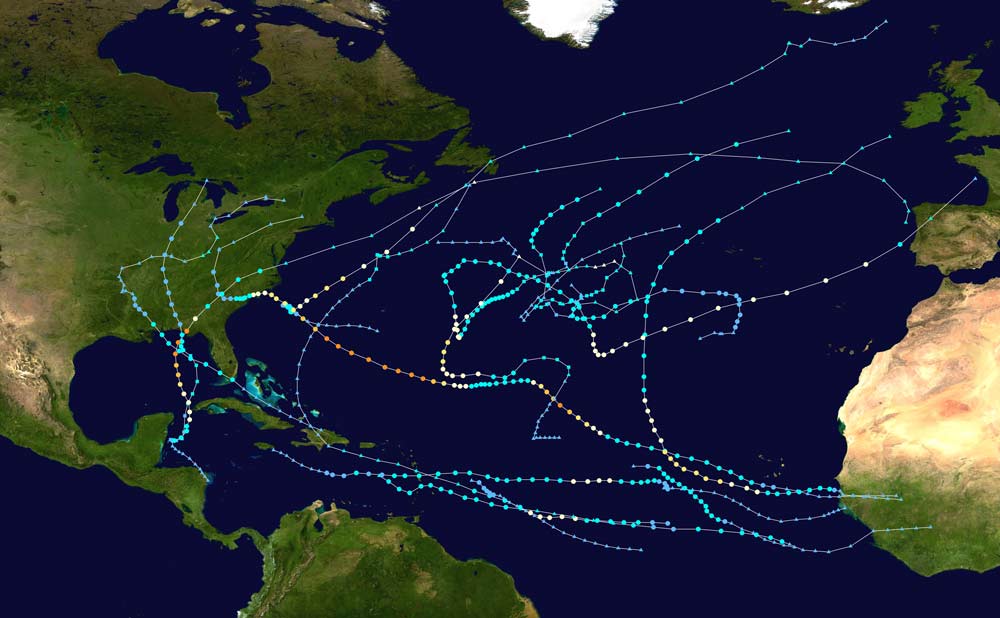
This year’s Atlantic hurricane season activity was deemed slightly above average: in all, there were 15 named storms that formed, with eight reaching hurricane strength, and two becoming major hurricanes (Category 3 and higher on the Saffir-Simpson Scale). As measured by Accumulated Cyclone Energy (ACE)—the energy of a storm, and cumulatively, of a season—2018 was solidly above normal at 128.9. Granted, this was not nearly as high as the 2017 Atlantic ACE of 226, which was more than double the median ACE of 103.
Although only two hurricanes made landfall in 2018, they each set new records: Florence developed into a massive lumbering storm that dumped record levels of precipitation, causing unprecedented flooding in the Carolinas, while Michael devastated the Florida Panhandle as the most powerful landfalling hurricane on record in that region. Both hurricanes caused billions of dollars in insured losses.
 Eric Uhlhorn, Ph.D.
Manager, Principal Scientist
Edited by Heidi Carrell, CEEM
Seasonal Forecasts
In our season preview we stated that there was general agreement among the forecasts that hurricane activity was likely to be average or slightly above average. Forecasts called for a relatively calm hurricane season, driven by cooler-than-average waters in the eastern Tropical Atlantic—an area known as the Main Development Region (MDR)—and by increased wind shear in this region resulting from a developing mild El Niño in the Pacific.
The early forecast from National Oceanic and Atmospheric Administration (NOAA) suggested a 45% chance for an above-normal season in the Atlantic. Colorado State University’s forecast for a 60% chance of a near-normal season was very close to this, as was the Tropical Storm Risk prediction from University College London. Halfway through the season, these organizations even released updated forecasts that lowered these already mild season predictions. What changed?
| ACE Index | Named Storms | Hurricanes | Major Hurricanes |
||
|---|---|---|---|---|---|
| Observed 2018 | 129 | 15 | 8 | 2 | |
| Average (1950-2017) | 103 | 12 | 6 | 3 | |
| TSR | 5 Apr | 84 | 12 | 6 | 2 |
| 6 Aug | 58 | 11 | 5 | 1 | |
| CSU | 5 Apr | 130 | 14 | 7 | 3 |
| 2 Aug | 64 | 12 | 5 | 1 | |
| NOAA | 24 May | 60-134 | 13 | 7 | 2 |
| 9 Aug | 11 | 5 | 1 | ||
| Source: NOAA, Colorado State University, Tropical Storm Risk | |||||
Tropical cyclone development is fueled by warmer ocean waters producing warm, moist air, and hurricanes need sea surface temperatures (SSTs) of at least 78.8° F (26° C) to sustain them. The warmer the water, the more energy there is available to drive hurricane formation, while cold waters deprive them of this fuel.
In June we warned that while the MDR was showing cooler-than-average SSTs, the warm phase of the Atlantic Multidecadal Oscillation (AMO) was still in evidence, which had the potential of boosting activity. We also noted the potential development of a weak El Niño—a period with elevated SSTs in the eastern or central part of the Pacific basin—which normally results in hurricane-destroying vertical wind shear in the Gulf of Mexico and the Caribbean. Due to increasing signs of El Niño conditions, NOAA and other agencies issued updated forecasts in August predicting an even quieter season, but the earlier season forecasts proved more accurate in the end.
In August, the MDR warmed back to near normal. While not as warm as 2017, ocean temperatures were still high enough to allow tropical disturbances to pass through to grow and threaten the U.S., including the one that spawned Florence.
Also, the expected warming of the Eastern Pacific—and accompanying disruptive Atlantic wind shear—came slightly later in the season and was not enough to temper tropical cyclone formation. Finally, in the upper atmosphere, convective phases of the Madden-Julian Oscillation—an eastward moving disturbance of clouds, rainfall, winds, and pressure that can enhance storm formation—happened in early September and again in early to mid-October. This produced two stronger bursts of storm development, giving us Florence and Michael.
Of note, this season’s activity was boosted by the number of storm days from storms like Leslie that persisted for a time in the western Atlantic north of the MDR that experienced higher than average SSTs this season.
Hurricane Florence
Florence was the sixth named storm to form in the initially quiet start to the 2018 hurricane season. This storm strengthened rapidly September 4–5, reaching Category 4 status with maximum sustained winds of 130 mph. Florence was knocked back down by wind shear to a tropical storm by September 7, but then reorganized and gained strength to reach major hurricane status with winds of 138 mph on September 10. Following that, it went through an eyewall replacement cycle that decreased the wind speed, although the storm's wind field continued to grow to massive size.
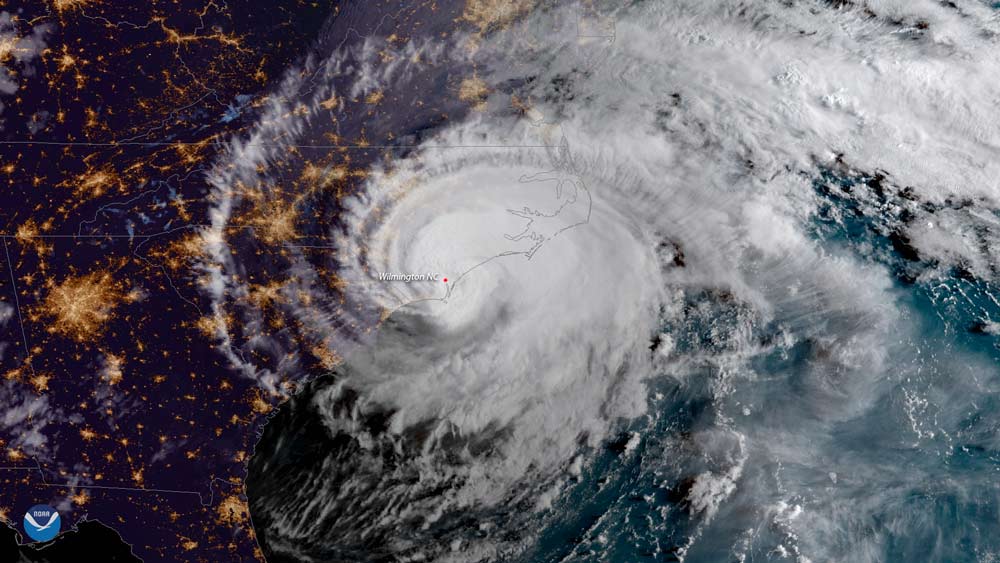
Early on September 15, Florence made landfall near Wrightsville Beach, North Carolina, as a Category 1 hurricane with 90 mph sustained winds, bringing a 10-foot storm surge to the area and causing extensive damage. The storm weakened further as it crawled inland, unleashing record amounts of rain.
Like Harvey last year, flooding was Florence’s most destructive aspect. A large, slow-moving storm, steered inland by an unusual grouping of blocking fronts, Florence plodded across the Carolinas as slowly as 2 mph, breaking statewide rainfall records from a tropical cyclone for both North Carolina and South Carolina over 4 days before the storm’s remnants finally moved north and east. The new record set by Florence in North Carolina is 35.93 inches, surpassing the previous record of 24.06 inches set by Hurricane Floyd in 1999 by more than 10 inches. In South Carolina, Florence broke the record set by Tropical Storm Jerry in 1995 by dropping 23.63 inches of rain.
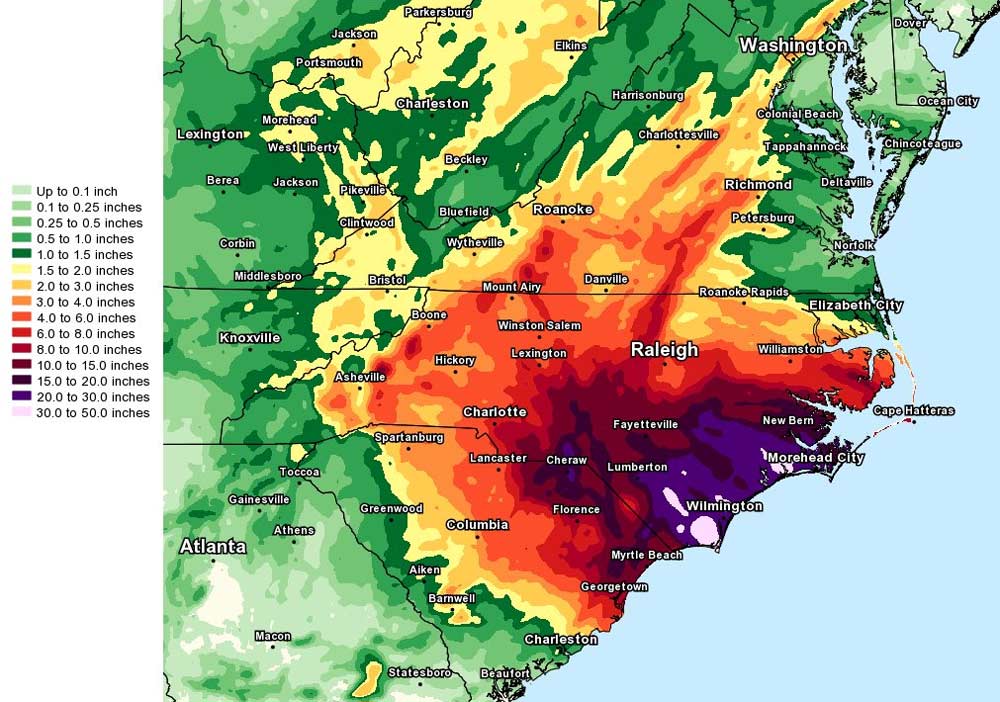
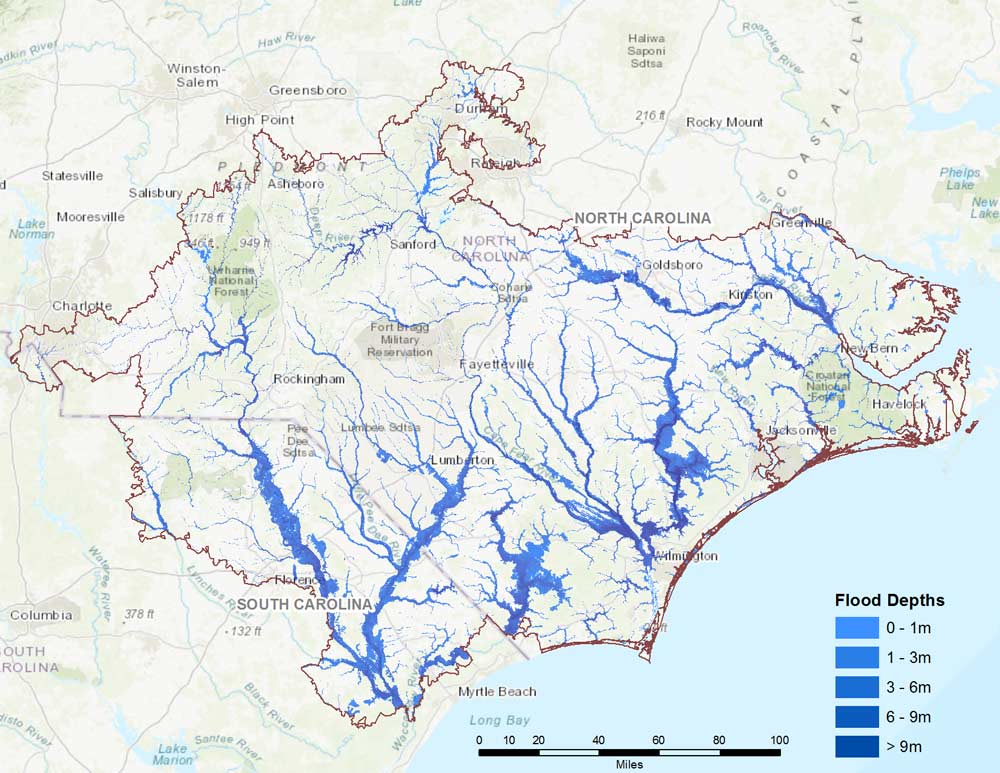
The region had already been facing one of the wettest years on record; natural areas of overflow were saturated, so Florence’s rain rapidly filled rivers and streams. The relentless downpour triggered flooding that continued for weeks, with rivers cresting days past landfall. More than 50 river gauges reached flood stage in the Carolinas, with several that broke previous records set during Hurricane Matthew in 2016 and Hurricane Floyd in 1999.
Hurricane Michael
The weather setup for the development of Hurricane Michael was highly unusual. Throughout September and early October, a high-pressure system blocked early season cold fronts from entering the Southwest, keeping record heat over the region. This drove the northern Gulf SSTs up to 84°—three to four degrees above normal.
On October 7, 2018, more than 600 miles southwest of the Florida Panhandle, Michael became a named tropical storm. Less than 72 hours later, Michael made landfall on October 10 as a monster Category 4 hurricane, ripping into the Florida Panhandle as the strongest hurricane on record ever to strike there. Michael made landfall with the fourth highest wind speed and the third lowest minimum central pressure of any hurricane on record to strike the U.S. mainland. Michael’s central pressure was only three millibars lower than Andrew’s in 1992, and it made landfall with the highest wind speed since Andrew.
At landfall, a combination of extensive wind and surge damage obliterated the coastal town of Mexico Beach. The storm’s strongest eyewall winds tore up buildings and mowed down forests as far as 15 miles inland. Michael moved well inland through Georgia, South Carolina, and North Carolina to exit into the Atlantic from Virginia, with most wind damage confined to the Florida Panhandle and southern Georgia, particularly in Albany, which is well inland.
NOAA researchers are still compiling data about this storm, including recovering some sensors washed away in the onslaught. There is the possibility that this storm may be reclassified to a Category 5, joining Andrew, Camille, and the Labor Day Hurricane of 1935 as the fourth known Category 5 hurricane to make landfall in the continental United States.
Increased Activity in the Northern Hemisphere
The Eastern Pacific had the fourth-most active hurricane season on record. Rising sea surface temperatures fueled multiple tropical storms and two hurricanes that inundated Mexico and the Baja Peninsula, including Willa, which spun up to Cat 5 intensity before weakening to a Cat 3 at landfall. Hurricanes Hector, Lane, and Olivia all impacted Hawaii, where hurricanes rarely approach, with an extended reach fueled by the warming waters.
| Basin | Named Storms | Hurricanes | Major Hurricanes | ACE |
|---|---|---|---|---|
| N Atlantic | +27% | +27% | -26% | +24% |
| NE Pacific | +39% | +46% | +133% | +141% |
| NW Pacific | +12% | +1% | +8% | +20% |
| N Indian | +43% | +208% | +43% | +79% |
| Northern Hem. | +25% | +27% | +83% | +52% |
The final East Pacific ACE total of 316 was the highest level in 48 years, and more than double the average season’s ACE of 131. In fact, 2018 is the first recorded occurrence of above-average ACE accumulated seasonal values in all four of the Northern Hemisphere tropical cyclone basins, including the Northwest Pacific and North Indian Ocean.
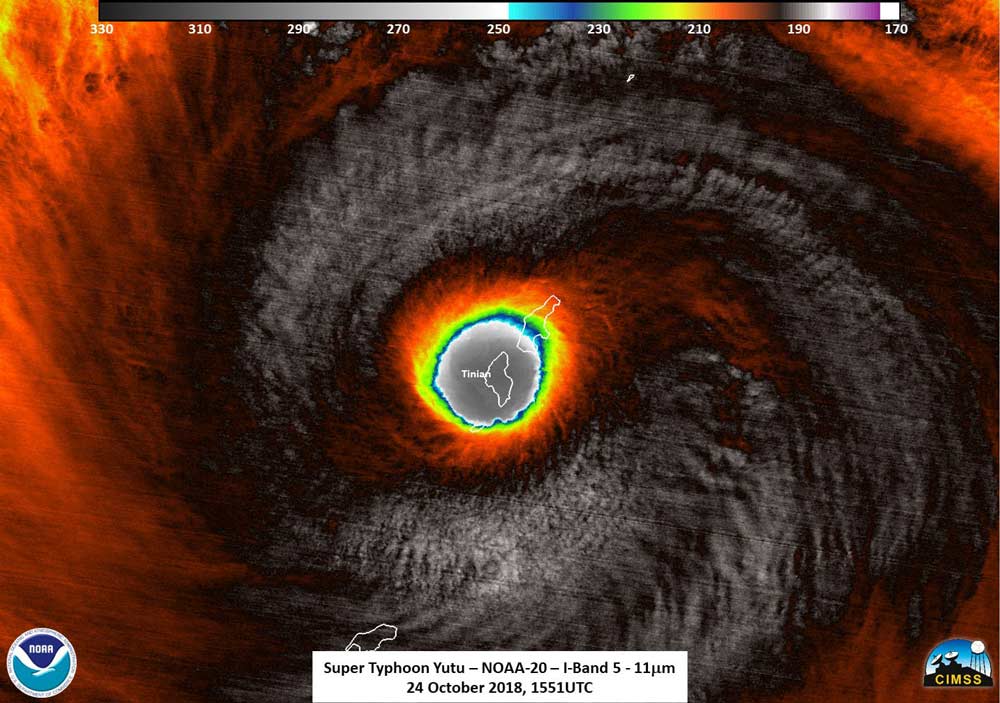
This energy could be seen in storms such as Typhoon Yutu in the Northern Pacific, which struck the U.S. Northern Mariana Islands as a Category 5 storm with maximum winds of 285 km/h—the strongest typhoon to affect the islands on record and the most intense storm, globally, of 2018—before it went on to strike the Philippines. Other notable Pacific storms include the Category 5 Typhoon Mangkhut, which brought widespread damage to Guam, the Philippines, and southern China, and Typhoon Jebi, which severely impacted Japan.
AIR Models Account for “the Unexpected”
While this year’s hurricane season broke several records, storms such as Florence and Michael were accounted for in the stochastic catalog of the AIR Hurricane Model for the United States. If it can happen, it will happen at some point, and using a probabilistic model that has incorporated a complete range of physically possible storms can prepare you for that eventuality. In addition, AIR has conducted damage surveys after major storms and incorporated lessons learned into the damage functions of our model. Surveys following both Florence and Michael confirmed what we know about the kind of damage that hurricane winds and flooding can cause.
In terms of the number of storms, this year was near average and could be prepared for with our probabilistic model. The potential landfall activity of 2018 still reflects the inherent uncertainty of losses in a given year, which our model accounts for.
With Florence, we are again reminded that hurricanes do not need to be Category 3 or higher to inflict significant damage, as has been proven by storms such as Hurricane Ike (2008), Hurricane Irene (2011), Hurricane Sandy (2012), and Hurricane Harvey (2017).
Michael was the fourth Cat 4 hurricane to form in two years, a scenario reflected in our model. In the historical record, 2017 was the first and only year during which three consecutive Category 4 storms formed. The probability over a record of 67 years (1951-2017) is therefore approximately 1.5%. AIR’s stochastic catalog shows a remarkably close probability of 1.8%. This is entirely without bias or adjustment, as AIR’s model catalog was built before 2017, and it was not explicitly designed to capture that feature of higher consecutive year storm counts. The reason AIR captures this probability with such fidelity is due to the extent of Atlantic basinwide modeling information that went into the design of catalog.
While forecast accuracy may be increasing, this year’s lagging transition to El Niño conditions highlighted the reality that seasonal forecasts are inherently uncertain, and that probabilistic models remain the most reliable method of obtaining a comprehensive view of tropical cyclone risk.
Insurers can leverage the forward-looking power of catastrophe modeling to not only accurately price hurricane risk, but also design incentives to strengthen the resilience of homes and businesses. Catastrophe models allow users to identify key risks and evaluate the efficacy of different risk mitigation strategies.
