Canada Crop Hail Damage: What Can We Learn From 2016?
Mar 16, 2017
Editor's Note: Crop damage caused by hail during Canada’s 2016 growing season was notable, especially in light of 2015’s growing season, which was a relatively good one for crop hail insurers in Canada. AIR is releasing our new crop hail model this summer to give crop hail insurers and reinsurers a probabilistic view of crop hail risk in Canada for the first time so they can better prepare for seasons of above-average losses. In this article, we discuss where most crop hail damage occurs in Canada and why; how crop damage varies by crop and developmental stage; the significance of 2016 in terms of crop hail damage and how it compares to other notable years; and how to manage Canadian crop hail risk with AIR’s Crop Hail Model for Canada.
Hail is a significant peril in Canada, causing damage to property and vehicles as well as to crops. Crop damage can range from the tearing of a few leaves in a portion of a crop to the complete destruction of an entire field. Average annual insured losses to crops from hail is about CAD 200 million.1 The 2016 growing season exceeded this average annual loss, with preliminary estimates of total payouts of nearly CAD 256 million in western Canada alone.2 Strikingly, 85% of total crop losses in a year can be caused by only 10–15% of the hailstorms that occur during the growing season.
The Prairie Provinces—Where Most Crop Hail Damage Occurs and Why
The Prairie Provinces—Alberta, Saskatchewan, and Manitoba—comprise the majority of Canada’s cropland and have the highest average hailstorm frequency in the country. The higher frequency of hailstorms in this region can be attributed to several atmospheric and geographic features that either trigger or amplify thunderstorm activity.
Alberta’s “Hailstorm Alley” extends from High River to Red Deer to Edmonton, east of the Rocky Mountains where cool dry air flowing over the mountains from the west descends and facilitates the lift of warm moist surface air during the summer months. Within severe thunderstorms, those strong updrafts carry moisture to cold altitudes where water droplets condense and freeze, creating hailstones. The updrafts allow newly formed ice particles to remain aloft and gather additional layers of ice, increasing the size of the hailstones that will then fall from the storm clouds. Attempts to reduce the size of hailstones during outbreaks in Alberta through cloud seeding with silver iodide have been ongoing since 1996 with the inception of the Alberta Severe Weather Management Society,3 yet crop hail damage has still been noteworthy in many of the years since.
In Manitoba, the mechanism is a bit different. Here, it is moisture from the Gulf of Mexico traveling north to the southern portions of the province that is conducive to the development of severe thunderstorm activity, including hailstorms.4 During the peak hail season—which can extend from late June to August, the warmest months—the Prairies are hit with an average of 130 severe hailstorms annually.5
Crop Hail Damage Varies by Crop and Developmental Stage
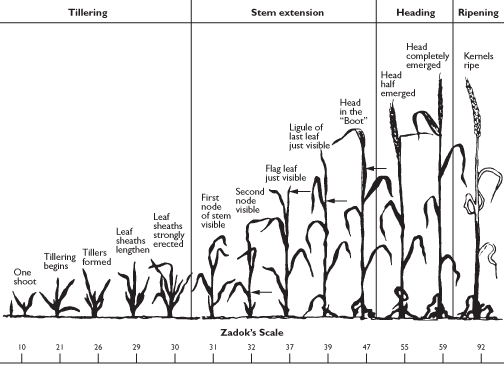
While severe thunderstorms can damage or destroy entire fields of crops, even small hailstones (less than one inch in diameter) can critically injure plants, tearing leaves or bruising stems, and thus hinder the plants’ growth and development. In addition to the severity of the storm, the damage a hailstorm is able to inflict depends on the type of crop in the field and the developmental stage of that crop at the time of a storm. Most cases of hail-induced crop-yield reduction results from damaged and lost leaves, leading to decreased photosynthesis—an important factor in yield potential. The reduction in yield is not always proportional to the leaf area damaged by hail, however, which makes it more challenging to determine the extent of damage and associated loss. In addition, storms that impact a crop near or after the middle of the growing season generally tend to cause larger yield losses because more developed parts of the plants, with less capacity to recover, are damaged. For example, wheat plants that sustain damage prior to the head in the “boot” stage (Figure 1) may recover if the entire plant has not been destroyed, whereas following head emergence, the ability of the plant to recover declines rapidly.6

2016—A Year of Significant Crop Hail Damage in Canada
The year 2016 was an expensive one for crop hail insurers in the Prairie Provinces. The number of hailstorms during the season increased from 2015, leading to a larger volume of claims—with many farmers submitting multiple hail loss claims during the year. But because the severity of individual storms was generally lower, the average cost per claim fell. The timing of the hailstorms also played a key role in the large losses paid in 2016. In Alberta, farmers submitted claims as late as October 1, during the final stage of the growing season. Many late-season storms caused high losses by damaging mature crops close to harvest time.
The nearly CAD 256 million in payouts to farmers in 2016 greatly exceeded the 2015 paid losses of CAD 167 million. Collected premiums of just over CAD 300 million led to an industry loss to premium ratio of 85%. Nearly half of the industry payouts originated from Saskatchewan, where total payouts reached more than CAD 124 million for a loss to premium ratio of 71%. Manitoba followed with an estimated total payout of CAD 67 million, while farmers in Alberta received an estimated payout of CAD 64 million. The largest province-level loss to premium ratio was in Manitoba at more than 142%, a significant increase from the recorded loss to premium ratio of 108% for the province in 2015. Similarly, a loss to premium ratio of 82% reported in Alberta surpassed the 2015 reported loss to premium ratio of 66%. Saskatchewan’s loss to premium ratio of 71% also exceeded the 2015 loss to premium ratio of 46%.
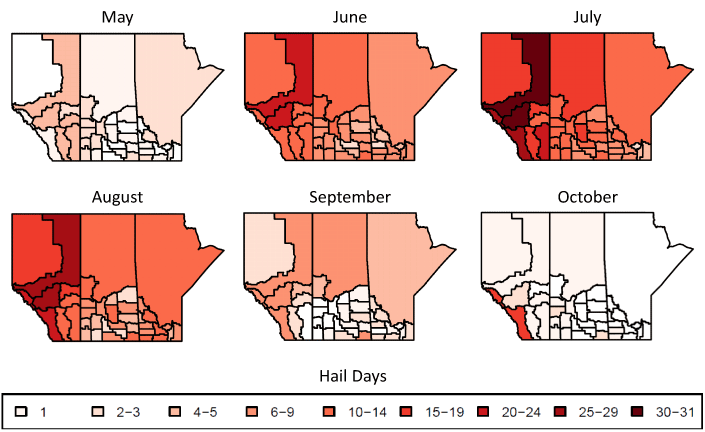
Most of the Census Agricultural Regions across the Prairies experienced several hail events in each month of the 2016 peak hail season, from June through August (Figure 2). The southern regions, where the majority of crop exposure is located, saw more than 10 days of hail activity in July and August. Later-season hailstorms occurred in all three Prairie Provinces, with Alberta experiencing a large amount of hail activity into October. As illustrated by the 2016 monthly hail maps, the frequency of hailstorms varied across the region and throughout the growing season.

Hail-induced crop damage in 2016 was the latest in a list of recent years with above-average industry payouts. The Prairie Provinces saw the second-highest recorded number of hailstorms in 2012, when crop hail insurers suffered an overall loss to premium ratio of nearly 82% with payouts totaling CAD 280 million (Table 1). The province-level loss to premium ratio was highest for Alberta at 113%.
Going back four more years, the 2008 hail season was unusual due to the lack of typical warm moist air over southern Canada that is strongly related to hail activity. Instead, much cooler temperatures at higher altitudes led to sufficient atmospheric instability, which triggered localized thunderstorms and brought very damaging hail.7 As a result, 2008 set a record for high losses from hail-induced crop damage (Table 1). Record payouts across the Prairie Provinces totaling more than CAD 341 million were made to western Canadian producers. Hail insurers in Saskatchewan paid roughly CAD 228 million to farmers, the highest in history, suffering a loss to premium ratio of 129%. While hailstorms were recorded somewhere in Saskatchewan almost every day in July, two catastrophic storms on July 9 and 10 (affecting some of the same areas both days) generated an estimated payout of CAD 80 million. Alberta also saw record payouts to producers totaling almost CAD 99 million and leading to a loss to premium ratio of 147% for the province.8
| Province | Year | Number of Claims | Total Payouts (CAD millions) | Collected Premiums (CAD millions) |
Loss to premium ratio (%) |
|---|---|---|---|---|---|
|
*NR = Not Reported |
|||||
| Alberta | 2008 | 4,800 | 98.6 | NR* | 147 |
| 2012 | 5,500 | 90 | 79 | 113 | |
| 2016** | NR | 64 | 79 | 81.8 | |
| Saskatchewan | 2008 | 21,000 | 228 | NR | 129 |
| 2012 | 13,500 | 159 | 212 | 75 | |
| 2016** | 11,001 | 124 | 176 | 70.8 | |
| Manitoba | 2008 | NR | NR | NR | NR |
| 2012 | 2,500 | 31 | 49 | 64.5 | |
| 2016** | NR | 67 | 47 | 142.5 | |
| Canadian Prairies | 2008 | 29,000 | 341 | NR | NR |
| 2012 | 21,600 | 280 | 341 | 82 | |
| 2016** | 19,854 | 256 | 300 | 84.8 | |
Managing Canada Crop Hail Risk
One of the main challenges in assessing the risk of loss to a crop hail insurance portfolio prior to the growing season is that historical data are limited and do not adequately represent the risk. The AIR Crop Hail Model for Canada, anticipated for release this summer, assesses the risk of damage and loss through the use of a 10,000-year catalog of simulated hailstorms, providing 10,000 possible scenarios of hail activity for the coming growing season. This stochastic catalog does not rely only on records of past hail events and weather patterns; it also includes events outside of the historical record that could have occurred given daily atmospheric conditions experienced during recent years. The model’s probabilistic view of potential hail activity in the coming season can provide a robust view of the risk of loss to crop hail contracts in Alberta, British Columbia, Manitoba, New Brunswick, Nova Scotia, Ontario, Prince Edward Island, Quebec, and Saskatchewan. Barley, canola, corn, flax, lentil, oats, pea, potato, soybean, and wheat are explicitly modeled with losses to all other crops modeled implicitly.
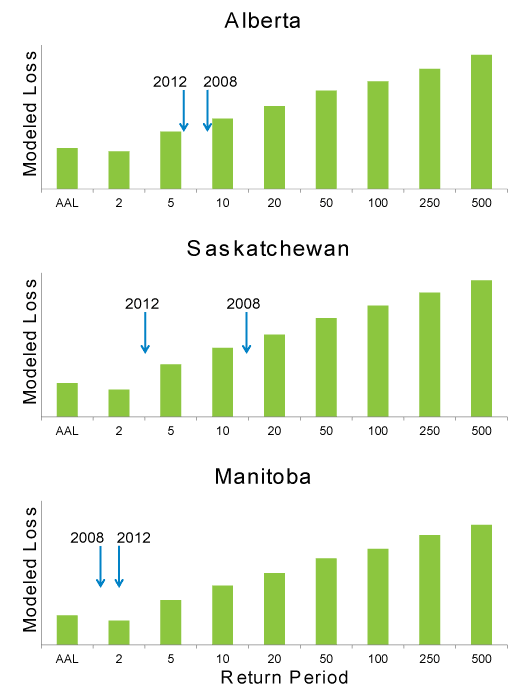
Through AIR’s 10,000 simulations of potential annual hail activity, insurers and reinsurers are able to assess the risk of a larger range of losses than have been experienced by the industry. This provides a more complete view of the risk to their crop hail portfolios. In particular, the new AIR Crop Hail Model for Canada forms the basis of exceedance probability curves indicating the expected return period of large loss years in the Prairie Provinces (Figure 3).

AIR’s Crop Hail Model for Canada will assist the insurance industry in pricing contracts based on the risk of loss due to hail damage in Canada. Users of AIR’s Crop Hail Model for the United States will now have a continuous view of crop hail risk as the models for Canada and the U.S. leverage the same 10,000-year hail catalog whose domain covers the contiguous United States and nine southernmost Canadian provinces. The continuity will be particularly useful for insurers who underwrite policies in both the U.S. and Canada, and brokers who prepare submissions for companies in both countries. Although straight hail insurance policies are currently written only for the Prairie Provinces in Canada, the model accounts for six other southern Canadian provinces with agriculture exposure. In addition, because the AIR Crop Hail Model for Canada and the AIR Severe Thunderstorm Model for Canada use the same hail catalog, users of AIR’s CATRADER® software can easily evaluate combined property and crop losses on an annual basis by province. (To learn more about hail damage to property, please read this AIR Current.)
AIR will be monitoring hail activity in Canada throughout the upcoming growing season and will provide our view of potential impacts to the insurance industry from major outbreaks in the CropAlert® Growing Season Report, to be published June through October, 2017.
References
1 Historical Canada: Hail
2 The Hail Report – Canadian Crop Hail Association. October 18, 2016
3 Alberta crop insurers develop cloud seeding program
4 Science Update: Tropical Nights in Manitoba?
5 Environment and Climate Change Canada: Seasonal weather hazards
6 Morton County Extension Agent News for the week of June 23, 2008
7 Canada's Top Ten Weather Stories for 2008
8 Ibid
 Kazi Ahmed, Ph.D.
 Melanie Parker, Ph.D.