


2015 Hurricane Season in Perspective
Dec 18, 2015
Editor's Note: The 2015 hurricane season has lived up to expectations, with below-normal activity in the Atlantic basin and above-normal activity in the Eastern and Central Pacific basins. In this article, AIR Assistant Vice President and Director of Meteorology Peter Sousounis discusses notable Atlantic and Pacific storms from the season, explains how a strong and persistent El Niño and related climate factors shaped the seasonal outcomes, and reviews forecasts for the current 2015—16 Southern Hemisphere tropical cyclone season.
The Atlantic Basin
In an average year, the Atlantic basin spawns 11 named storms, six of which become hurricanes, including three that achieve major (Category 3 or higher) hurricane status. The 2015 Atlantic hurricane season was below average. While there were 11 named storms, only four reached hurricane strength and only two became major hurricanes.
An Early Start
The 2015 Atlantic hurricane season started prematurely when Tropical Storm Ana formed in the first half of May and became the earliest named storm to make landfall in the United States, albeit with 45 mph sustained winds. Tropical Storm Bill followed suit about one month later, making landfall in Texas. While the nine named storms that followed never made landfall, a few of them set some noteworthy records.
In late August, Hurricane Danny became the first major hurricane of the 2015 Atlantic hurricane season when it reached Category 3 status as it trekked across the Caribbean, making it the first storm to reach that strength in the strip of the Atlantic Ocean between western Africa and the Lesser Antilles since Hurricane Julia in 2010.1 The second hurricane of the season came just one week later when Hurricane Fred (a Category 1 storm) prompted the first-ever hurricane warning for the Cape Verde Islands. Fred was only the fourth Atlantic named storm to have ever formed east of 19°W, and holds the record for the easternmost hurricane formation in the tropics based on data from the National Hurricane Center (NHC) database.2 Hurricane Joaquin developed over the eastern Caribbean in late September and briefly reached Category 4 status with peak one-minute sustained winds of 155 mph and minimum central pressure of 931 mb, making it the strongest Atlantic hurricane since Igor in 2010. With a path directly over the central Bahamas, Joaquin was the first Category 4 storm to track through the Bahamas since 1866.3 The fourth and final storm to reach hurricane status in the Atlantic basin this season was Hurricane Kate, which closed out the Atlantic hurricane season after reaching Category 1 status on Veterans Day. Although not strong, Kate was the latest hurricane on record to form so far northwest in the Atlantic basin, and the latest-forming Atlantic hurricane in 10 years.4
 Peter Sousounis
AVP, Director of Meteorology, Research
Edited by Rachel Wisch
The article:
- The 2015 Atlantic hurricane season began early but stayed below average, while activity in the Eastern and Central Pacific basins was decidedly above average.
- A strong and persistent El Niño impacted wind shear and sea surface temperatures in both ocean basins, greatly contributing to the seasonal outcomes in 2015.
- Seasonal hurricane forecasts have limited use from an insurance risk management perspective; probabilistic models remain the most reliable tool.
A Below-Average Season
Despite the early start and handful of historically notable storms, the 2015 Atlantic hurricane season was below average from both the activity and the Accumulated Cyclone Energy (ACE) perspectives. A wind-energy index, the ACE Index is defined as the sum of the squares of maximum surface wind speeds over the duration of a storm. The unit of ACE is 104 knots2, and the seasonal total is the sum of the ACE values from each storm. An ACE index below 66 is considered a below-average season,5 and this year’s total was 59.6
| Season Type | Above-Normal | Near-Normal | Below-Normal | 2015 Atlantic Hurricane Season ACE Total |
|---|---|---|---|---|
| ACE Index (104 kt2) |
>111 | 66-111 | <66 | 59 |
No U.S. Hurricane Landfalls
Not only were there no major U.S. landfalling hurricanes in 2015 for the 10th consecutive year, there was barely any landfalling activity at all. Only the first two named storms of the season—tropical storms Ana and Bill—made landfall in the continental U.S., aligning with early seasonal landfall forecasts.
The Pacific Basins
Other basins in the Northern Hemisphere were busy overcompensating for the inactive 2015 hurricane season in the Atlantic.
Eastern and Central Pacific Basins
In the Eastern and Central Pacific, there were a total of 26 named storms, with 16 hurricanes and 11 major hurricanes—a decidedly above-average season. A normal year would have generated 18 named storms, 9-10 hurricanes, and three major hurricanes. One clear departure from normal this season has been the number of major hurricanes, exceeding 300% of the number expected in a normal season. Although Hurricane Patricia was the only Category 5, it should have been a 5+: Maximum sustained winds were measured by reconnaissance aircraft at 201 mph, making Patricia the most powerful hurricane ever, based on wind speed. Maximum winds for Super Typhoon Haiyan in 2013 were estimated to be 196 mph by the Joint Typhoon Warning Center (JTWC), meaning Patricia surpassed Haiyan’s record.
Western Pacific Basin
Although the season in the Western Pacific basin does not officially end until December 31, the Japan Meteorological Agency has already recorded 27 named storms this year, with four typhoons attaining minimum central pressures of 920 mb or less. The JTWC designated ten storms as super typhoons, with winds near or at Category 5 levels. In a normal year, less than half that number will form.
Contributions from El Niño
Wind Shear
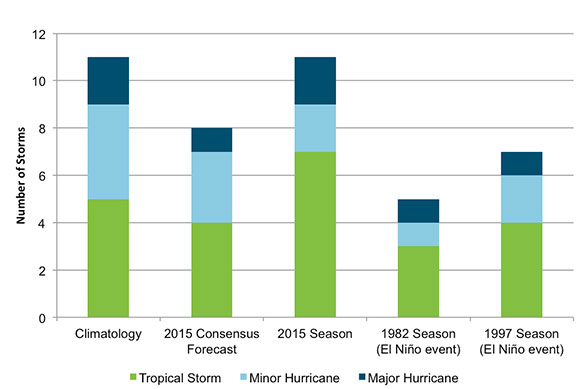
The reason for the below-normal activity and forecast success in the Atlantic basin this year is largely related to El Niño, a phenomenon that occurs every 2–7 years, during which warm water in the western tropical Pacific extends eastward to South America. Conditions remained favorable for continued development of a strong El Niño event right through the heart of the 2015 hurricane season. For the Atlantic, El Niño increases vertical wind shear over the main development region (Caribbean Sea), which inhibits tropical cyclones from intensifying or forming. Depending on other factors, El Niño can contribute to a considerable reduction in hurricane activity. The last two major El Niño events—in 1982–83 and 1997–98—also coincided with below-normal hurricane activity (Figure 1).
The hyperactive Pacific basins also have ties to the strong El Niño, which has an opposite effect in the Pacific by decreasing vertical wind shear. The result is a more favorable environment for storm formation.
Sea Surface Temperatures
A strong El Niño also extends warm water that normally resides along the western part of the Pacific basin eastward to South America, thus increasing the surface area where sea surface temperatures (SSTs) exceed the critical 26.5°C threshold for hurricane formation. This provides storms that form farther east a longer opportunity to strengthen as they move westward before making landfall or re-curving northeastward, also contributing to a more active Pacific hurricane season.
Just as above-average SSTs play a part in elevated Pacific hurricane activity, below-normal SSTs contribute to less active Atlantic hurricane seasons. Working in concert with the 1982–83 El Niño event was a negative Atlantic Multidecadal Oscillation (AMO), which resulted in below-normal SSTs. The AMO is a mode of variability in the North Atlantic Ocean that influences water temperatures over a timescale of multiple decades. It was just beginning to enter a positive phase in 1997, which likely contributed to the slightly higher totals. The number, intensities, and lifetimes of the storms during those El Niño events were also reflected in very low Atlantic basin ACE values of ~30 and ~40, respectively.
The Global View
The Northern Hemisphere
Since the Pacific (west, central, and east) Ocean in the Northern Hemisphere typically accounts for nearly one-half of all tropical cyclone activity in a given year, even slight increases above climatology can have a large effect on overall activity. Accordingly, the ACE value of ~900 (through November 30)7 is the largest seasonal value ever calculated for the Northern Hemisphere, surpassing the previous record of ~860 in 1992.8
The Southern Hemisphere
The 2015−16 tropical cyclone season has just begun in the Southern Hemisphere, which officially runs from November 1 to April 30. The South Pacific got a rare early start when Tropical Cyclone Raquel was named on July 1 and moved over the Solomon Islands,9 and Tropical Cyclone Tuni battered Samoa on November 28.10 While there is a high degree of uncertainty in some elements of the model used to generate the prediction, the Australia Bureau of Meteorology (BOM) forecast indicates a below-average season in the Western South Pacific and a near-average season in the Eastern South Pacific due to a persistent El Niño during the preceding July to September period.11 In contrast, New Zealand’s MetService is expecting increased tropical cyclone formation over the Eastern South Pacific this season due to El Niño.12
The Southern Indian Ocean is also included in the Southern Hemisphere tropical cyclone season. According to NASA, the fourth tropical cyclone of the Southern Indian Ocean season—Bohale—formed on December 10 but faded quickly on December 12 after interfacing with adverse atmospheric and oceanic conditions.13
Closing Thoughts
The global activity this year demonstrates that while El Niño can inhibit activity over the Atlantic, it can certainly make up for it in other basins, especially if other climate signals are present. Though El Niño may have contributed to a successful 2015 forecast for the Atlantic basin, contradictory tropical cyclone activity predictions for the Southern Hemisphere remind us that seasonal forecasts are inherently uncertain. It is equally important to note that while general tropical cyclone counts and intensities across basins may be correlated, landfall activity may not be. Further exploration of the potential relationship between climate signals in general and multi-basin landfalling tropical cyclone activity is therefore needed, and probabilistic models remain the most reliable method of obtaining a comprehensive view of tropical cyclone risk.
References
1 http://www.wunderground.com/news/hurricane-danny-tropical-storm-danny-atlantic-2015
2 https://www.washingtonpost.com/news/capital-weather-gang/wp/2015/08/31/hurricane-fred-is-a-fountain-of-firsts-in-the-atlantic-ocean/
3 http://www.weather.com/storms/hurricane/news/hurricane-joaquin-bahamas-atlantic-east-coast-bermuda-2015
4 http://www.weather.com/storms/hurricane/news/tropical-depression-twelve-tropical-storm-hurricane-kate-atlantic-2015
5 http://www.cpc.ncep.noaa.gov/products/outlooks/background_information.shtml
6 http://models.weatherbell.com/sst.php
7 http://models.weatherbell.com/sst.php
8 http://models.weatherbell.com/global_annual_ace.png
9 http://blog.metservice.com/node/1065
10 http://blog.metservice.com/TC-Tuni-29-Nov-2015
11 http://www.bom.gov.au/climate/ahead/south-pacific/tc.shtml
12 http://blog.metservice.com/TC-Tuni-29-Nov-2015
13 http://www.nasa.gov/feature/goddard/bohale-southern-indian-ocean
