


Extraordinary Weather, Ordinary Losses: The 2013-2014 Extratropical Cyclone Season in the UK
Nov 20, 2014
Editor's Note: Despite historically wet and windy (yet mercifully warm) weather across much of Europe last winter, insured losses were relatively low. This article reviews the meteorological and climatic conditions behind the 2013-2014 extratropical cyclone season and puts losses in the UK in historical context.
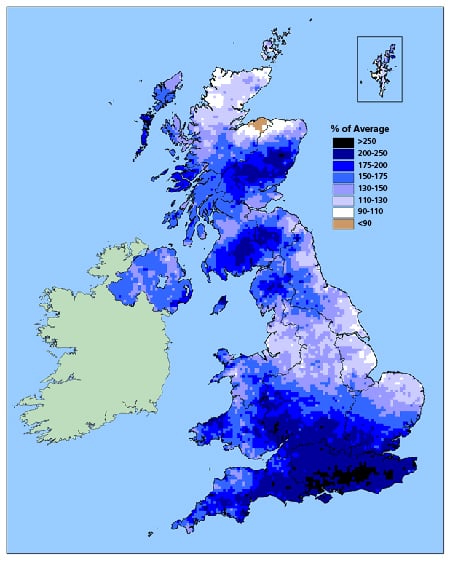
The winter of 2013-2014 was remarkably warm, wet, and windy across much of Europe. The World Meteorological Organization reported it was one of the warmest winters across the region; Austria, the Netherlands, and France all experienced their second warmest winter on record, and Germany its fourth. More precipitation fell on Ireland last winter than any other winter, while parts of southern England experienced 2.5 times their average winter rainfall.
According to the National Oceanic and Atmospheric Administration (NOAA), between October 1, 2013, and March 8, 2014, a total of 43 extratropical cyclones (ETCs) with hurricane-force winds formed in the North Atlantic. And although many ETCs weakened or dissipated before they hit Europe, a new wind speed record was recorded in Denmark, and southern England endured its single worst winter storm in 40 years.
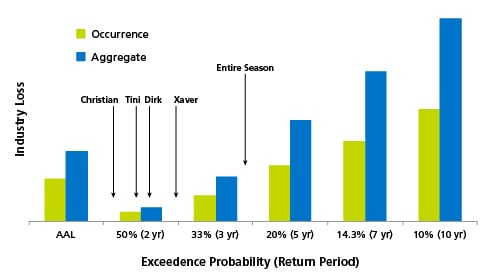
In fact, meteorological conditions were ripe for the growth of an ETC to the size and strength of historical blockbusters such as Lothar, Daria, and Anatol, but such development never occurred and insured losses remained relatively low. The losses from wind and flood in the UK, for example, have exceedance probabilities (EPs) of 25% and 29% (4- and 3.5-year return periods), respectively, on the aggregate EP curve.
 By: Stephanie Higgs
Ph.D.
Edited by Eric Bland
Article Highlights:
- Despite meteorological conditions conducive to the genesis of big storms, no single storm grew intense enough to cause very high losses.
- Insured loss in the UK from wind and inland flood were modest, with annual aggregate exceedance probabilities of 25% and 29%, respectively.
- Between December 18, 2013, and January 5, 2014, seven windstorms (Bernard, Dirk, Erich, Felix, Gerhard, Anne, and Christina) hit the UK in rapid succession. This clustering behavior is explicitly captured in the AIR model.
A Strong Start
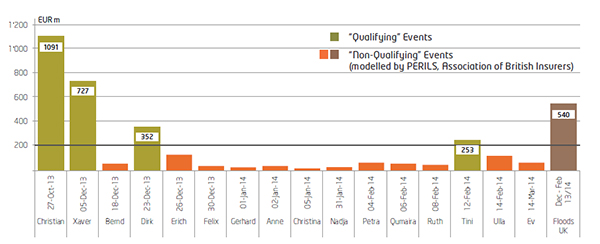
The 2013-2014 European ETC season kicked off in October with windstorm Christian (known as St. Jude in the UK), which caused an estimated industry loss of EUR 1.5-2.3 billion, according to AIR. Less than two months later, windstorm Xaver caused losses of EUR 700 million to 1.4 billion. Then, between December 18, 2013, and January 5, 2014, seven windstorms (Bernard, Dirk, Erich, Felix, Gerhard, Anne, and Christina) hit the UK in rapid succession (read more about these storms in this In Focus blog post). Dirk alone caused about EUR 352 million in loss, but the other storms also caused significant damage.
Such clustering of storms is a common occurrence in northern Europe. Clustered storms can be quite powerful and aggregate losses can mount alarmingly, making it crucial to explicitly account for the phenomenon when managing the risk. During the 1989-1990 ETC season, for example, eight consecutive storms hit Europe, including Daria, which caused more than EUR 4 billion in insured damage (in 1990 currency). In 1999, Lothar and Martin—separated by just 36 hours—caused a combined loss of more than EUR 6 billion (in 1999 currency). More recently, 2007's Kyrill struck four days after Hanno, and Emma followed quickly in the wake of Johanna and Kirsten in 2008.
Climatic factors, including a positive North Atlantic Oscillation (NAO) signal, contributed to the overall activity of the 2013-2014 ETC season. (To learn more about the impact of the NAO, please read the AIR Currents article "A Windy Winter Season") An exceptionally strong jet stream helped strengthen the storms. The Quasi-Biennial Oscillation (QBO), a fast, high-altitude flow of air in the tropics, moved westerly last winter (instead of easterly), a trend that is historically linked with a stronger-than-normal Icelandic Low and Azores High and a strong jet stream. And finally the descent southward of the polar vortex, which caused so many cold days over the U.S. last winter, is also associated with stormier winter weather in Europe.
Putting the Losses in Perspective
Despite meteorological conditions conducive to storminess, only four ETCs reached PERILS' EUR 200 million threshold for issuing loss estimates: Christian, Xaver, Dirk, and Tini (Figure 2).
Combined, estimated loss in the UK from these four events have an annual exceedance probability of between 40%-59% (a return period of 1.7-2.5 years) on the industry insured EP curve for the UK.
Adding the insured losses from events that did not meet the PERILS threshold (estimated by the Association of British Insurers [ABI] to be GBP 640 million for events between December 23, 2013, and February 28, 2014), the annual exceedance probability for all storms is about 25% (a return period of approximately four years).
Likewise, last winter's flood losses (a much discussed topic this year in light of Flood Re) were unremarkable, even though flooding lasted for months in some areas. Placed on the aggregate EP curve, the ABI's estimated GBP 451 million of flood losses have an exceedance probability of about 29% (or approximately a 3.5-year return period). By contrast, the 1999 series of storms (Anatol, Lothar, and Martin) produced UK-only losses for both flood and wind at the exceedance probability level of about 7% (a return period of about 14 years) on an aggregate EP curve. The 1990 series (Daria, Herta, Vivian, and Wiebke) produced losses (again, for the UK only) at the 3% exceedance probability level (a return period of about 33 years).
The Hours Clause
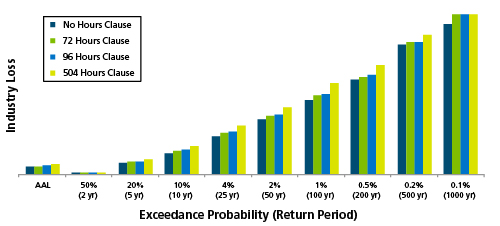
The prevalence of the hours clause in reinsurance contracts makes it all the more important to capture temporal clustering when assessing occurrence losses (aggregate losses remain unchanged with the application of an hours clause). The application of the standard 72 hours clause to the EP curve has a relatively small impact across the curve, with the largest difference at low exceedance probabilities, where the hours clause groups together clusters of high-intensity (large loss-causing) events. When a 504 hours clause is applied, as is done in many flood contracts across Europe (and may be applied in some wind policies), small increases across the EP curve are again observed.
Closing Thoughts
The 2013-2014 ETC season saw historic weather conditions that favored the formation of large and powerful storms. And while four ETCs crossed PERILS' EUR 200 million threshold for issuing loss estimates, insured wind and inland flood losses were modest overall, with annual exceedance probabilities of 25% and 29% for the UK. None of these storms were large enough to trigger reinsurance payouts, and they paled in comparison to memorable ETC events in Europe's past. Last winter demonstrated that record-setting meteorological conditions do not necessarily translate to historic losses. Meanwhile, we will be paying close attention to what the 2014-2015 ETC season brings.
