


Managing U.S. Severe Thunderstorm Risk: Part 2, New Hail Vulnerability Framework
Jan 24, 2022
Editor's Note: Verisk plans to release a substantially updated severe thunderstorm model for the United States in summer 2022. In this article, the second of three in our series on managing U.S. severe thunderstorm risk, we discuss our innovative and first-of-its-kind hail vulnerability framework and how our updated model can distinguish the view of risk from one property to another. Part I discussed newly available data, technological advances, and the importance of capturing all severe thunderstorm outbreaks to successfully manage this risk; this article also discussed the impact of climate change on the severe thunderstorm peril. In Part III we will discuss our Verisk-wide approach to looking at cat risk and non-cat risk, our validation methodology, and how companies can use their own claims experience with our model to form their own view of risk.
When asked “what do catastrophe modelers do?” we find ourselves trying to explain a complex integration and collaboration of meteorology and earth sciences, data science, statistics, engineering, and actuarial science laced together with a finesse to create art. It is quite an art to decompose highly complex natural phenomena into reliable decision-making tools that can be used to help manage and mitigate future risk. Essentially, the goal of a catastrophe model is to answer hypothetical questions such as, “What would happen if catastrophe X were to hit region Y?” Once you try to answer one question, 100 more arise, leading to endless possibilities of unexplored or unanswered questions. When developing the Verisk Severe Thunderstorm Model for the United States, this was no different. Verisk engineers tried to answer the question, “What happens to buildings subjected to hail impacts or straight-line and tornadic winds?” This seems trivial until one tries to quantify a response and formulate additional questions. For example, what kind of building? How many floors? When was it built? What kind of roof does it have? Where is it located?, etc. Even knowing everything about the building would still not provide an answer to the initial question when the building is subjected to hazard.
The updated Verisk Severe Thunderstorm Model for the United States introduces a first-of-its-kind and innovative component-level framework to assess the vulnerability of structures to hail strikes. In this article we will discuss the inner workings of this framework, including how material resistances and component costs flow through the framework logic; and the implications and benefits of using this framework to assess hail vulnerability, with a focus on implications for roofing components, which are particularly vulnerable to hail.
The Hail Vulnerability Framework—An Overview of the Inner Workings
The novel, engineering-based component-level hail vulnerability framework developed and implemented as a part of the updated Verisk Severe Thunderstorm Model for the United States captures the physical process of hail striking a building at the component level. The framework answers the three critical questions that arise when translating hail strikes into component vulnerability, namely:
- What is the hail impact (load) on a building and what building characteristics influence this?
- What is the component’s resistance to the hail impacts that result in damage?
- What is the damaged component’s cost, and how does that relate to the overall building value?
The subsequent subsections will go into further details of the answers to these individual questions, but first we will share a high-level overview of our innovative framework here. The hail vulnerability framework accounts for component response and the relative contribution of any component’s damage to the overall vulnerability of the building, first by calculating the total event kinetic energy (KE), which is the accumulation of the kinetic energy of a distribution of hailstones—whose individual KE is a function of the mass and velocity squared—over the duration of a hailstorm. This KE metric can represent numerous combinations of hailstone size distribution, the duration of the event, and the wind speeds that impart a horizontal component to the hail trajectories. The framework accounts for both short duration events with larger hailstones and longer events with smaller hailstones, as well as hail events in between.
Although there is still a significant level of uncertainty around the properties of hail—including their shape, density, size distributions, and drag coefficients (used to quantify the drag or resistance of an object in a fluid environment, such as air or water), which are variables that govern the kinetic energy and impact energy—there have been significant advances made by the Insurance Institute for Business and Home Safety (IBHS) to quantify these parameters and create realistic performance test specifications that can be used to refine model parameters.
To translate total event KE into actionable information, the event needs to be decomposed into individual stones where the number, size, and trajectory of hailstones as a function of total KE needs to be determined. This process basically produces a “shower” of hailstones with their individual properties preserved that is representative of an area within a modeled footprint. A building envelope is then introduced into the calculation to understand the hail strike energy imparted on various building surfaces and how many strikes will exceed predefined damage thresholds for a given total KE. These damage thresholds can be related to a material’s resistance to various types of damage to build damageability curves. For example, various KE thresholds may be associated with the denting or cracking of various roof covering materials. Figure 1 illustrates an example of the interaction of building-related primary risk characteristics (larger orange circles) and secondary risk characteristics (smaller light blue circles) considered when evaluating the roof cover component vulnerability. Arrows indicate relationships between a building characteristic and a pillar of the framework. These relationships will be expanded upon in the upcoming sections.
 Tim Johnson, Ph.D.
Senior Engineer
 Sarah Bobby, Ph.D.
Senior Engineer
 Karthik Ramanathan, Ph.D.
Vice President
Edited by Sara Gambrill, CEEM
Now that we have provided a basic overview of the inner workings of the framework, we can tackle how it handles the three critical questions that arise when translating hail strikes into component vulnerability.
What Is the Hail Impact (Load) on a Building and What Building Characteristics Influence This?
As hail falls to the ground at terminal velocity (the constant speed that a freely falling object eventually reaches when the resistance of the medium through which it is falling—in this case, air—prevents further acceleration), each hailstone will have an inherent KE that will impact a surface. Building surfaces and components, including the roof, windows, and exterior walls, are particularly susceptible to direct impacts from hail strikes. The building surface will produce an equal and opposite reaction on the hailstones; in some cases, the building surface will take the full impact of a hailstone, and in others the building surface will deflect a hailstone and reduce the net impact.
Geometric features such as the roof slope and shape can increase or decrease the impact angle, which changes the impact energy (or load) imparted on a component surface. Because hailstorms generally produce winds that blow from the same direction for the life of the storm, it is unlikely that all wall surfaces of the same building would be subjected to hail impacts equally. So, if the wind during a hailstorm is blowing south from the north, for example, the north-facing wall of a building would experience the brunt of the hailstorm’s impact. As a result, some surfaces will not be as significantly impacted during an event, which reduces the overall vulnerability of the building.
Impact Load Modification
The updated U.S. severe thunderstorm model explicitly accounts for the influence of a building’s geometric features, such as roof shape and pitch (which can be thought of as modifying, i.e., increasing or decreasing, the resulting hail impact energy) by implementing a variable known as the impact load modification factor. Essentially, impact load modification helps explore and answer the following question: What is a component’s susceptibility to being impacted directly, indirectly, or not at all? To capture the physical mechanics of the hail strike patterns, the model incorporates a simulation model that measures how many hailstones strike a typical building for a given total KE and calculates the resulting impacts on each surface.
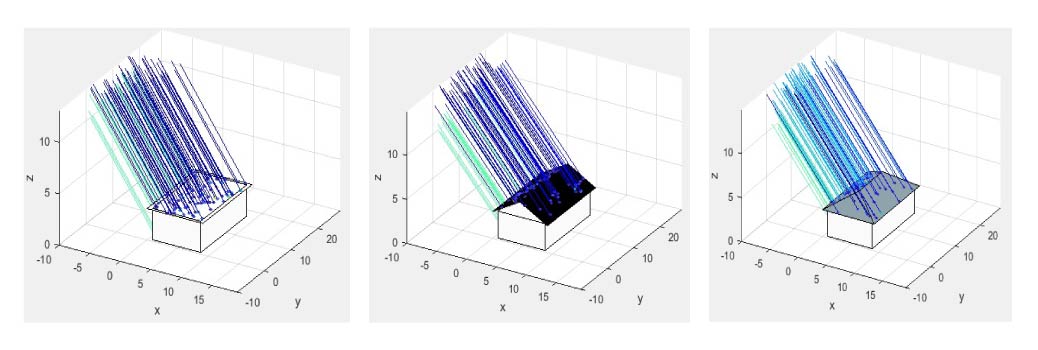
While there will still be inherent uncertainties in the estimates of load adjustments, a simulation approach applies the same load in a measured way to various configurations, thereby reducing the influence of other variables. This process helps quantify the reduction or increase in impact energy on the building surface by varying geometric features. These relationships help provide a realistic representation of the physical loads on the structure and how variations would likely modify the expected losses. Figure 2 illustrates the hail strike patterns for various roof geometries for a similar event. Typically, the leeward walls are sheltered from hail strikes. In addition, each surface of the roof will modify the impact trajectory, which can change the impact energy on the surface and therefore increase or decrease the expected damage to the roof.
What Is the Component’s Resistance to the Hail Impacts that Result in Damage?
The component resistance of susceptible envelope elements subject to hail strikes is the inherent resistance to hail impacts based on the material properties and features that could increase or decrease strength. Factors such as material type, impact rating, and age all play an important role in determining the strength of the building envelope.
To determine the relevant building characteristics and expected performance of components susceptible to hail, Verisk engineers leveraged damage reports and published test standards, reviewed component performance literature, and coupled these with an in-house simulation model. The general performance standards of typical building materials varies significantly and there is no unified standard for determining the expected performance of building materials. Most literature assigns a hail diameter rating threshold at which point damage is initiated. This metric can vary significantly and reveals significant levels of uncertainty depending on age, composition, and failure criteria—even for the same roof cover type. For example, asphalt shingles have varied performance metrics: Standard shingles have damage thresholds of less than 1 inch to almost 2 inches for impact rated products. While this range does not appear to be that significant, the difference in impact energy imparted by a 1-inch vs. 2-inch hailstone is significant, as KE is a function of both mass and the velocity squared, as we have noted.
Most product approval ratings are based on a particular target KE as shown in Table 1. While these tests have different parameters and criteria, they do provide a reasonable idea of target KE values that products are rated to. IBHS developed and is currently implementing its own testing standard with the aim of providing a standard metric with realistic hail sphere missile parameters and failure criteria that can be used to determine relative performance for all component types. (This standard is not yet available to the general public and there is no sufficient data at this time on in-situ responses to a wide selection of building materials.)
| Standard | Missile Parameters | |||
|---|---|---|---|---|
| Diameter, in. (mm) |
Mass, lbs.(kg) |
Distance, ft. (mm) |
Energy, ft. lbs. (J) |
|
| ASTM D 3746 | 2" (50) | (2.27) | 4'5.0" (1355) | 22 (30.0) |
| FM Class I-SH | 1.75" (45) | (.360) | 17'9.5" (5400) | 14 (19.0) |
| FM Class I-MH | 2" (51) | (.737) | 5' (1500) | 8 (10.8) |
| UL Class 1 | 1.25" (32) | .28 (.127) | 12' (3700) | 3.36 (4.6) |
| UL Class 2 | 1.5" (38) | .48 (.218) | 15' (4600) | 7.2 (9.8) |
| UL Class 3 | 1.75" (46) | .79 (.358) | 17' (5200) | 13.43 (18.3) |
| UL Class 4 | 2" (51) | 1.15 (.521) | 20' (6100) | 23 (31.2) |
For products that do not have a known target performance criterion, observations from damage reports and literature are used to determine thresholds of hail sizes most likely attributed to various material types. With this information, damage relationships can be derived that indicate the proportion of a component that experiences hail strikes exceeding a pre-defined KE threshold. With both of these pieces of information, one can derive the damage levels for various building components subjected to a particular total load. Figure 3 shows an example of damage curves generated for a flat roof and the walls of a building with a target threshold of 1 joule (the amount of energy exerted by a force of one newton—the force that gives a mass of 1 kilogram an acceleration of 1 meter per second applied over a displacement of 1 meter). Similar curves are derived for damage mechanisms that correspond to capacity thresholds of various building materials. This figure highlights the reduction in damage due to the geometric properties of a roof vs. the walls under the same hail load with the same target KE threshold. Damageability curves for individual features are based on the selected building components and their expected target threshold.
What Is the Damaged Component’s Cost and How Does That Relate to the Overall Building Value?
The first two aspects of the hail component module determine the level of damage incurred to the damageable components of a structure as a function of hail KE as the intensity measure. The relative contribution of a component’s cost to the overall replacement value of the building helps integrate the damage across various components to yield building-level damage. Accurate and reliable estimation of component costs and the factors that influence these costs therefore contribute an equally important piece of information when trying to understand overall vulnerability.
Cost estimates are highly uncertain. Typical costs of average homes are therefore required to best capture the average replacement costs for various material types. The objective of reliable cost estimates is to provide reasonable attribution of components to the overall value and adjust these accordingly. The proportion or contribution of an individual component to the overall building vulnerability is therefore calculated as a function of the component's cost relative to the overall total replacement cost of the building. This ratio, more commonly referred to as the replacement cost ratio, is unitless and is useful in comparing a building’s elements to one another as a percentage of the total. Multiplying this replacement cost ratio by a component damageability function produces component damage functions, which determine the relative contribution of a component to the overall building vulnerability as a function of increasing intensity.
Building features such as roof cover type, geometry, impact rating, number of stories, and area are all factors that would influence the cost distribution of a structure. For example, a certain roof cover type may be more expensive than another type for the same structure, so the relative contribution of the roof cover to the total building value needs to be adjusted accordingly. In some cases, the materials may be the same, but the geometry and roof pitch may vary, which modifies the unit costs of that component due to the additional labor and materials requirements. To account for variations in a particular component’s cost, Verisk’s U.S. severe thunderstorm model’s hail vulnerability framework uses cost modifiers to reflect the relative building component contribution to the overall building value by explicitly accounting for differences in component size, cost, and component-to-building proportions. Unit replacement costs for various construction types and occupancy combinations from Verisk’s 360Value® were used, as well as other cost estimating resources such as RSMeans (2019).
Building height and gross area (or square footage) are important when assessing hail damage and associated repair costs. As a building's height increases, the proportion of wall surface area relative to the overall area also increases (Figure 4). Conversely, the proportion of roof value with respect to the overall building value decreases with increasing building height. Adjusting the component unit costs explicitly captures the relative value attributed to building elements that are vulnerable to hail damage as well as the systems that are not susceptible to hail damage.
The unit cost and size cost adjustments determine how much the presence of each building component either increases or decreases the building's overall repair cost due to hail damage. To determine the relative change with respect to the overall building, the sum of all modified costs is calculated and a component cost ratio is derived (i.e., a component's relative contribution to the overall building replacement value). Typical low-rise (1 to 3 stories) single-family homes’ component cost breakdowns can be seen in Figure 5.
So, What’s the Damage?
The hail vulnerability framework answers the three critical questions we laid out at the beginning of this section to formulate vulnerability curves for individual risks. Damageability functions describing specific failure modes are first adjusted to account for load and strength specifications. Costs are evaluated based on user input, and the overall building damage function is generated as a weighted average of the component-level damageability functions and the respective cost-based weighting factors.
Assessing Roof Vulnerability
The roof of a structure bears the brunt of the impact from hail. As such, the roof contributes to a major proportion of the claims experienced during hail events, so accurately assessing roof vulnerability is critical to understanding a structure’s vulnerability. The development of the hail vulnerability framework was an important step toward more accurate roof vulnerability modeling, which involves not only accurately modeling the components of the roof separately but also ensuring that the vulnerability of the roof is well represented within the context of the behavior of the entire building system.
The individual damageability curves describing the vulnerability of each roof covering and roof deck material were developed using the latest engineering research combined with an in-house simulation model. Our framework brings in new research from various sources, including Brown and Pogorzelski (2014), Herzog et. al. (2012), and RICOWI (2016), which describe thresholds for damage initiation. Asphalt shingles, which are the primary roof material on residential structures in the United States, can see granule loss or crushing in hail events, which can shorten a roof’s lifespan. In addition, cracking can lead to water intrusion, which can cause water to enter the interior. Bitumen layer roofs are generally resilient to hail damage, but large hailstones can puncture or damage the surface; and although metal roofs appear to sustain only cosmetic damage from dents, small cracks at impact points can allow water to enter the building and damage and scoring of the surface may lead to rust and more problems in the future. Accurately representing damage to every material considered in the framework is an essential first step to building the final damage functions and ensuring that roofing behavior is reasonably captured.
Another important aspect of accurately representing damage is determining the appropriate costs for each component of the structure to ensure that the contribution of the roof to the total building value is reasonably captured. Key to this is the way height and square footage flow through the hail vulnerability framework. When the height and square footage are entered into the model, the square footage of the roof and walls of the structure are adjusted accordingly. The model therefore automatically updates the proportion of the total building cost assigned to the roof and wall system to more accurately model the vulnerability of the building envelope within the context of the entire building. Updating this relationship is essential to reasonably capturing the wide variation in the vulnerability of similar structures with different dimensions. A 10,000-square-foot 1-story commercial masonry building can have very different hail vulnerability in comparison to a similarly constructed building serving the same purpose that is 3 stories tall. Similarly, a 10,000-square-foot, 1-story commercial masonry building will have a different hail vulnerability than a 2,000-square-foot 1-story commercial masonry building (Figure 6). Specifying additional attributes allows further vulnerability differentiation, as shown in Figure 7. The component-based hail vulnerability framework now allows the updated U.S. severe thunderstorm model to explicitly capture these vulnerability differences, enabling enhanced risk differentiation.
Roof Age Is a Factor in Its Vulnerability
One of the key differentiating features in a roof’s vulnerability is its age. Newer roofs have been found to perform better than older roofs, and an additional highlight of the hail vulnerability framework is the ability to explicitly account not only for aging roof materials but also the impacts that re-roofing can have on roof damage. When the roof year built is entered into the model, the framework identifies whether the structure has its original roof or has been re-roofed, which is assumed to be the case when the roof age is newer than the building age. Typically, when a structure is re-roofed, the new roof must comply with the current local building code.
One of the salient features of the updated U.S. severe thunderstorm model is the incorporation of a detailed building code study that informs the spatial and temporal wind vulnerability assumptions across the contiguous United States. Verisk engineers tapped into this study to explicitly capture roof upgrades. When a re-roofing is indicated by the model input, which is specified using the roof year-built secondary feature, roof-related building characteristics that are consistent with the building codes in effect at the time of the upgrade are automatically assigned to the structure. This allows the full impact of the re-roofing to be captured in the model. In the case where a re-roofing hasn’t been performed, the model still pulls roof information from the building code study to assign roof-related characteristics consistent with the year the structure was built. Figure 8 shows the relative vulnerability of a 1-story wood frame single-family home built in 1990 in Dallas, Texas, when different roof year-built values are input into the model. As can be seen, re-roofing can have a significant impact on the structure’s vulnerability. The capability to explicitly capture re-roofings allows you to capture a more detailed view of roof vulnerability.
The updated U.S. severe thunderstorm model also supports the case where the roof age is unknown. It is much more preferable to input the roof age into the model, as the model can assign roof-related characteristics using building code information; however, even in the absence of this information, the model is able to provide an added level of detail to roof age for single- and multi-family homes as well as apartments and condominiums of wood frame and masonry construction. We used Verisk’s roof age data to develop unknown roof age assumptions for these risks. This data combines permit insights, assessor records, and an array of other data elements to assess the age of a structure’s roof. This information was analyzed by engineers working on our model to assign a roof age to a structure at the county resolution across the contiguous United States when this information is not populated by the model user (unknown roof year-built user input).
Roof aging is an active area of research, as it is well known within the industry that aging is tied to roof damage, particularly in hail events. There are a number of active research projects actively investigating these relationships. For example, IBHS is in the process of conducting a study to identify shingle performance and how this relates to aging (Brown-Giammanco et al. 2020). These are long-term studies; currently, there is little published research that has identified aging patterns over the entire lifespan of roofs. Researchers on the extreme event modeling team at Verisk have approached roof aging by identifying the lifespan of typical roofs and developing vulnerability relationships for roofs of varying ages. It is known that, in general, roofs tend to last 25 to 30 years before a re-roofing is needed. We bucket the roof age into three bins: new, average, and old (Figure 9). If the building was constructed between 2010 and the current year, the roof is automatically classified as a new roof based on the U.S. severe thunderstorm model’s roof age definitions. If the building was constructed between 2000 and 2009, then the roof would be classified as average in the absence of a re-roofing. Some areas, however, have had significant numbers of re-roofings for these risks; in these areas the average roof year-built is 2010 or later. In these cases, the Verisk model defines the roof as new, from an aging and materials perspective. Similarly, if the building was constructed before 2000, the average roof age in an area may be old, average, or new depending on the extent and timing of re-roofings. The data behind the Verisk roof age product is used to gain insight into this and the U.S. severe thunderstorm model again considers the county average roof age for aging materials and deterioration. This same capability exists and influences the straight-line wind and tornado vulnerability, which are the other sub-perils of severe thunderstorms covered by the model.
Managing U.S. Severe Thunderstorm Risk
Verisk engineers on the extreme event solutions team developed a state-of-the-art, engineering-based component-level hail vulnerability framework, which is incorporated into the Verisk Severe Thunderstorm Model for the United States to allow you to better assess hail risk across the country. The damageability relationships behind the framework are based on the most recently available research and materials testing information, allowing you to bring state-of-the-art research into your risk analysis process. The framework also contemplates spatio-temporal hail vulnerability and, together with a similar framework to assess the straight-line wind and tornado vulnerability consistently, seamlessly captures the severe thunderstorm risk across the contiguous United States for all three sub-perils. Furthermore, the framework is inherently able to capture important details related to the roof of a structure—one of the key drivers of hail risk—to give a detailed and comprehensive view of a structure’s hail vulnerability.
Our innovative hail vulnerability framework is part of a larger vulnerability update to the Verisk Severe Thunderstorm Model for the United States. Other vulnerability enhancements include updated damage functions across all supported traditional and specialty risks for building, contents, and business interruption/time element coverages for hail, straight-line winds, and tornados, including traditional residential, commercial, industrial, manufactured homes, personally owned and commercial automobiles, and large industrial facilities. The model also significantly expands on the supported risk types by modeling the damageability of marine lines and infrastructure assets.
Verisk’s updated U.S. severe thunderstorm model allows you to more accurately capture severe thunderstorm risk in the United States.
Resources
Brown, T. M and Pogorzelski, W. H. “Claims Analysis Study of May 24, 2011 Hailstorms in Dallas-Fort Worth.” Applied Climatology, 94th American Meteorology Society Annual Meeting, Atlanta, GA, February 4, 2014.
Brown-Giammanco, T. M., Williams, L., Meisenzahl, B., and Giammanco, I. M. “IBHS Roof Aging Farm: 5-Year Hail Performance Study; IBHS Research Report, Members Only.” Insurance Institute for Business & Home Safety, 2020.
Crenshaw, V. and Koontz, J.D. “Simulated Hail Damage and Impact Resistance Test Procedures for Roof Coverings and Membranes.” RCI Interface, Vol. XIX, 2001.
Flüeler, P., Stucki, M., Guastala, F., and Egli, T. “Hail Impact Resistance of Building Materials Testing, Evaluation, and Classification.” 11 DBMC International Conference on Durability of Building Materials and Components, Istanbul, Turkey, May 11-14, 2008.
Herzog, R. F., Morrison, S. J., Patnode, S. A., and Green, J. R. “Ice Ball Impact Testing of Siding.” 27th RCI International Convention and Trade Show, Dallas, TX, March 15-20, 2012, Pages 142-146.
RICOWI. “Hailstorm Investigation, North Texas, April 11, 2016.” Roofing Industry Committee on Weather Issues, Clinton, OH, 2016.
RSMeans (Ed.). “Square Foot Costs with RSMeans data 2019” E-book ed., Gordian, 2009.
