


Preview of the 2014 Atlantic Hurricane Season
Jun 23, 2014
Editor's Note: With cooler Atlantic sea surface temperatures and El Niño conditions developing, forecasts for the 2014 hurricane season point to low storm activity. Forecasts of fewer storms don't eliminate the risk of a damaging tropical cyclone, however, and it has been eight years since a major hurricane made landfall in the United States. Learn why meteorologists are keeping a weather eye on the 2014 hurricane season in both the Atlantic and the Pacific.
Introduction
The start of the Atlantic hurricane season on June 1 also signaled the beginning of the ninth season since Hurricane Wilma, the last Category 3 or greater hurricane to make landfall in the United States, ravaged parts of Florida in fall 2005. The unprecedented lull without a major hurricane making landfall in Florida—or in the country—has created much speculation among meteorologists, speculation further fueled by forecasts for this season of below-average storm activity, cooler sea surface temperatures (SSTs), and the likelihood of El Niño conditions. But even if forecasts are realized, major hurricanes do develop and make landfall during periods of low activity, sometime with considerable damage.
In this article, we'll view the 2014 forecasts in a historical perspective, explore the uncertainty behind seasonal hurricane predictions, note some trends to be aware of, and review how AIR can help if potentially damaging storms develop.
 By: Dr. Tim Doggett
Assistant Vice President, Senior Principal Scientist
Edited by Dan Edson
Highlights:
- The 2014 hurricane season could usher in a lengthy period of low storm activity.
- Actual storm counts vary widely from preseason tropical cyclone and hurricane forecasts.
- AIR catastrophe models help insurers prepare for potential outcomes in advance.
Atlantic Basin Forecast
On average 10-11 tropical storms (named storms) develop in the open Atlantic annually during the June 1 through November 30 hurricane season. As indicated in Figure 1, about half reach hurricane strength (74 mph) and approximately one quarter become major hurricanes (Saffir-Simpson Category 3 or greater). These average storm figures have inched up in the last 15-20 years because of elevated Atlantic sea-surface temperatures (SSTs).
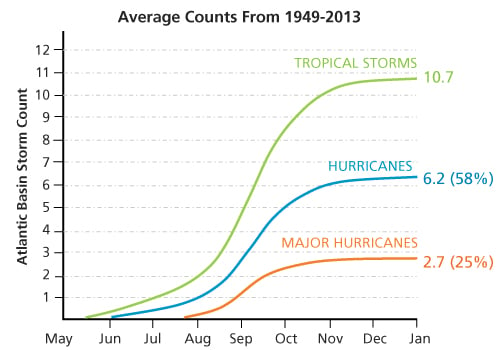
As Figure 1 shows, storm activity tends to be rather constrained until midsummer, with a steady uptick in storm frequency starting in August. On a climatological (long-term) basis, the most active part of the season for tropical cyclones occurs in mid September, then steadily decreases through late October and November. This pattern holds true for hurricanes and major hurricanes as well, with tailing off occurring slightly sooner for these more-intense events.
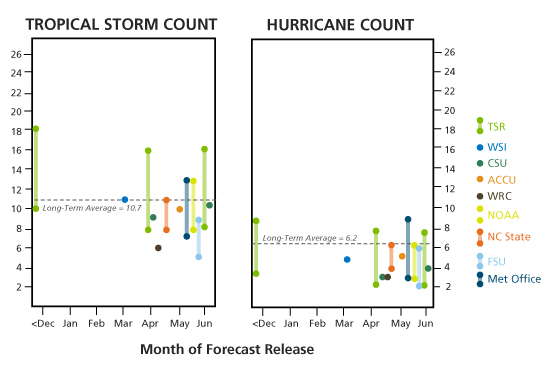
Figure 2 presents the 2014 forecasts for named storms (tropical storms) and hurricanes from eight organizations, along with long-term averages (indicated by the dotted lines). A few common threads emerge from the numbers:
- Almost all categories of forecasts are below the storm and hurricane averages.
- A few of the forecast ranges cross into above-normal values.
- The relative percentage of tropical storms that develop both into hurricane and major hurricanes (most agencies are forecasting 1 to 2 major hurricanes) is in line with historical ratios.
Putting the 2014 Forecasts into Perspective
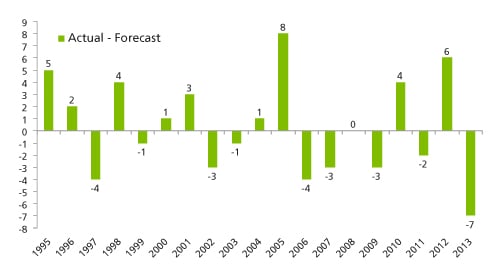
Hurricane season forecasts do have utility and can help put expectations into perspective, but because preseason storm predictions require anticipating climate and weather signals weeks to months in advance, they carry considerable uncertainty. Historically, the actual level of storm activity rarely matches the forecast level. As shown in Figure 3, between 1995 and 2013 the actual storm count minus the forecast storm count for the Atlantic ranged from eight more storms than forecast to seven fewer storms than forecast.
Even when environmental conditions are accurately forecast, day-to-day weather variability makes it extremely difficult to correlate basinwide storm activity with storm location and track, landfall risk, damage, and insured loss. A highly active season in terms of storm counts does not necessarily translate to high damage and losses; likewise, a season with a below average storm count does not always translate to low damage and losses—such as we saw in 1992, a low-activity, El Niño year, when Hurricane Andrew came ashore and devastated parts of Florida and Louisiana.
Despite the innate challenges, seasonal forecasts today do benefit from more sophisticated methodologies, such as numerical rather than solely statistical prediction, and make use of dramatically improved climate models. We advocate being aware of the trends these forecasts indicate for a given season, but not getting too attached to the absolute forecast values. Ultimately, what really matters is not storm counts, but whether storms make landfall and result in damage and insured loss.
Exploring the Reasoning—and Uncertainty—Behind the Forecasts
Forecasters assess numerous indicators to gauge the conditions for storm formation and strengthening, chief among them SSTs and wind shear. Storms need an ample supply of energy to form and strengthen, and humidity from warm SSTs provides that energy. Likewise, storms will not develop in the highly disturbed environment that results from wind shear.
In the short-term, when tracking a storm in real-time, SSTs and wind shear are fairly predictable; uncertainty increases, however, as the forecast time lengthens. Other factors influencing storm development, strength, track, and even landfall—such as atmospheric steering currents (which influence storm track and the probability of landfall)—are even less predictable in advance of the season.
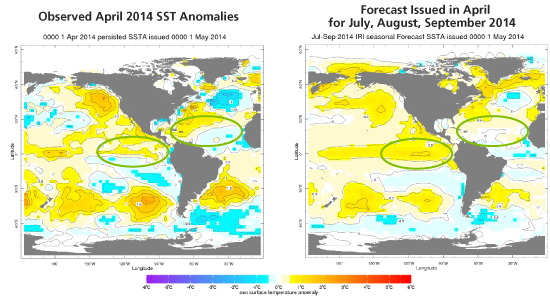
SST anomalies, linked to the ocean's enormous capacity to retain heat, help us understand the potential impacts of SSTs. In Figure 4, the image on the left shows April 1, 2014, SSTs, while the image on the right presents a prediction of SSTs for July-September of this season. The Main Development Region (MDR) in the Atlantic—the area in which much of the Atlantic storm activity will originate—revealed some pockets of warm SST anomalies in April, but conditions appear to be very close to normal across the Atlantic later in the season. In the eastern equatorial Pacific—the area to watch for potential El Niño conditions—the cool signal from last year was replaced by widespread neutral SST conditions in the April image, with clear signs of a warm anomaly building in the forecast image, on the right. (See the callout box, "2014 Pacific Basin Hurricane Season Forecasts.")
As seen in Figure 5, Atlantic SSTs—and cyclone activity—correlate with a phenomenon called the Atlantic Multidecadal Oscillation (AMO), the source of some very warm Atlantic SSTs in recent seasons. During warm SST periods, a higher percentage of tropical storms mature into hurricanes and major hurricanes.
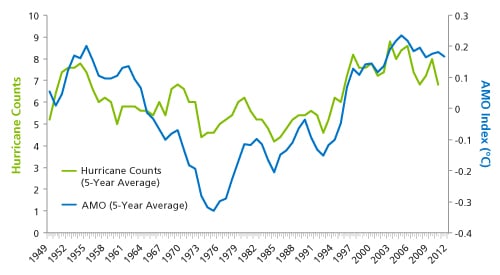
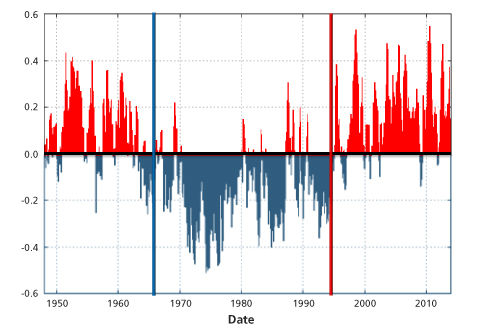
Figure 6 presents AMO data from NOAA's Earth System Research Laboratory from 1948 to 2014, with warm periods in red and cold periods in blue. The AMO index, which has been below zero, or cool, since January 2014, may shift phase into a multidecadal cool period and warrants monitoring over the next few years.
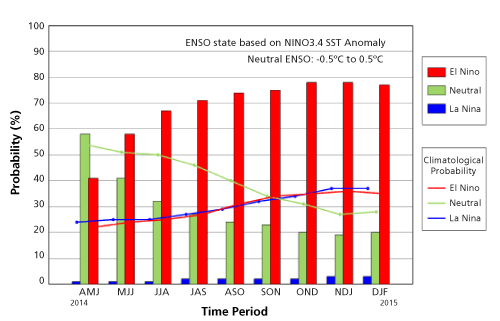
El Niño and La Niña—which refer to the warming (El Niño) or cooling (La Niña) of SSTs in the eastern equatorial Pacific Ocean—impact storm formation and storm weakening/strengthening. El Niño tends to decrease wind shear (with a resultant increase in storm activity) in the Pacific, and increase wind shear (with a decrease in storm activity) in the Atlantic, while the opposite occurs with La Niña conditions. According to the Climate Prediction Center (CPC) and International Research Institute for Climate and Society (IRI), the chances of El Niño increase during the remainder of 2014. As shown in Figure 7, the probabilistic El Niño forecast exceeds 65% by summer (see time period JJA) and peaks near 80% during the late fall and early winter.
The Role of Catastrophe Models
The published forecasts for this season reflect two key signals, both of which suggest lower storm activity than average: El Niño is coming and the Atlantic SSTs are not above normal. It is important to note, however, that AIR does not issue seasonal forecasts because there is no strong basis given the current state of research to translate atmospheric and ocean signals—forecast months in advance—to parameters that are useful for insurance risk management. While other solutions in the industry have attempted to make use of "near-term" or "medium-term" forecasts, the record shows that these methods have been unsuccessful.
Although storm prediction capabilities are improving, the best tool for managing insured risk for landfalling storms continues to be a catastrophe model that offers a long-term view. Offering a full spectrum view for hurricanes of all intensities and landfall locations, catastrophe models allow insurers to prepare for potential outcomes in advance.
The AIR U.S. Hurricane Model estimates climatological long-term risk, with the standard catalog reflecting all historical seasons since 1900 and the warm-SST (WSST) catalog reflecting seasons since 1900 with anomalously warm SSTs. Although neither catalog is meant to predict activity in the coming season, they do promote a multi-model approach to catastrophe risk management by allowing users to assess the sensitivity of their portfolio to different views.
During the hurricane season, AIR also posts ongoing meteorological and damage information as NewsALERTS, beginning two to three days before landfall. For storms with high loss potential, insured loss estimates also are issued and event sets are provided to allow clients to analyze the impact of the storm on their own portfolios.
Conclusion
A quiet hurricane forecast does not mean an inactive year for meteorologists. As this season unfolds, we will be keeping watch on a number of indicators:
- Will the lull in activity from 2013 continue in the Atlantic Basin?
- Will the El Niño show up as expected?
- If the El Niño forecast does verify, how long will it persist and will it be strong enough to promote storm development in the Pacific and suppress storm development in the Atlantic?
- Will the record streak of inactivity in Florida—and the country—continue?
Meanwhile, we await Arthur, the first 2014 named storm in the Atlantic, and weigh the odds of it being followed by Bertha, Cristobal, Dolly, Edouard, Fay, Gonzalo, Hanna, Isaias, and Josephine, as forecast.
