


Powerful Typhoon Hits Japan: Are You Prepared?
Mar 26, 2014
Event: Category 4 typhoon
Model: AIR Typhoon Model for Japan
Stochastic Event ID: 146503
Landfall location: Mie prefecture, south of Nagoya
Affected area: From Osaka to Chiba, including Tokyo, and extending across northern Honshu and Hokkaido
Storm footprint: Approximately 1,500 km long and 300 km wide
Estimated insured loss: JPY 3.0 trillion (USD 29.4 billion) for Japan; JPY 810.4 billion (USD 7.9 billion) for the Tokyo metropolitan area
Annual loss exceedance probability: 1% (100-year return period) for the Tokyo metropolitan area; ~0.5% (200-year return period) for Japan
Event Overview
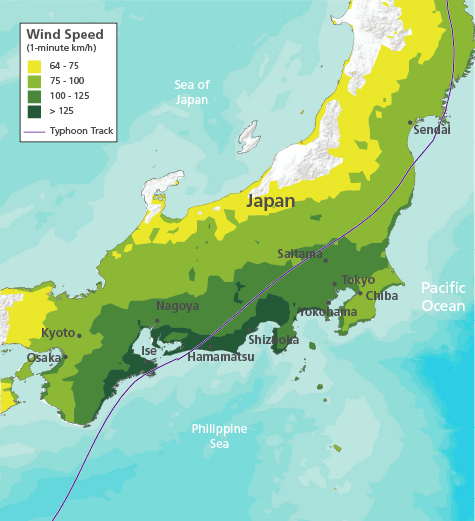
It is well into December when a Category 4 typhoon, the seventh typhoon landfall of the year, slams into Japan. The slow-moving storm brings fierce winds, some in excess of 160 km/h, to the coastal regions of Mie, Aichi, and Shizuoka prefectures. A high storm surge plows into the levees surrounding Ise Bay, testing flood defenses. Weakening as it moves inland over colder and more mountainous terrain, the storm passes north and west of Tokyo, causing extensive wind damage to the low-lying coastal areas around Tokyo Bay and higher elevations west of the city. The storm, which makes a total of five landfalls in Japan, continues to weaken as it moves across northern Honshu and Hokkaido.
Strong winds disrupt surface transportation, cause the cancellation of hundreds of flights, and prompt officials to issue evacuation orders or advisories to hundreds of thousands of residents. Heavy precipitation increases the risk of landslides. In Tokyo, officials suspend public transit and close down schools. Production along the highly industrialized southern coast is halted as vulnerable light metal roofing and siding are either heavily damaged or destroyed.
AIR estimates that if such an event were to actually happen today, insured losses would be JPY 3.0 trillion (USD 29.4 billion)1 for all of Japan and JPY 810.4 billion (USD 7.9 billion) for the Tokyo metropolitan area. The heaviest losses are found in Shizuoka Prefecture and result from damage to industrial assets. Figure 1 shows the wind intensity footprint for this simulated storm.

Japan's Typhoon Setting and History
The Northwest Pacific Basin produces more tropical cyclones than anywhere else in the world. Since 1951, an average of four typhoons per year have made landfall on one of Japan's four islands—and another five come within 500 km of the coastline. While typhoons can occur during any month of the year, most strike Japan between May and October, with July through September being peak season.
Wind drives most typhoon-related loss in Japan, but flooding is also a significant threat because of Japan's orientation, location, and terrain. After the destruction caused in 1959 by Typhoon Vera—the costliest weather-related disaster in Japan's history, the government undertook a massive effort to strengthen coastal and inland defenses, and most major cities are now protected by sophisticated flood defense systems.
Typhoon Vera was accompanied by an exceptionally destructive storm surge that destroyed a levee and dyke system and inundated the city of Nagoya. More than 5,000 people were killed, and more than 834,000 buildings were damaged or destroyed in Japan. AIR estimates that if this event were to occur today, the insured losses would be close to JPY 1.8 trillion (USD 17.5 billion). Other significant historical storms include Typhoon Kathleen (1947) and Typhoon Ida (1958). A more recent storm, Typhoon Tokage (2004), affected some of the same areas as our Megadisaster scenario, but was far less powerful. Modeled insured losses for a recurrence of these historical storms are shown in Table 1.
| Insured Loss (JPY Billions/USD Billions) | |||
|---|---|---|---|
| Typhoon | Wind* | Precipitation-Induced Flooding | Total |
| Kathleen (1947) | 8.7 / 0.1 | 710.4 / 6.9 | 719.1 / 7.0 |
| Ida (1958) | 144.5 / 1.4 | 211.3 / 2.0 | 355.8 / 3.5 |
| Vera (1959) | 1767.9 / 17.1 | 10.9 / 0.1 | 1778.8 / 17.3 |
| Tokage (2004) | 166.0 / 1.6 | 51.5 / 0.5 | 217.5 / 2.1 |
Affected Exposure
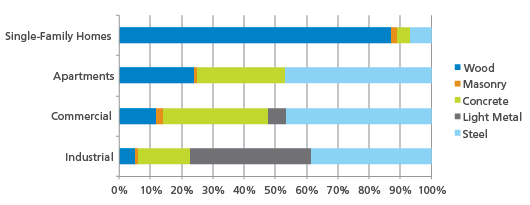
Throughout Japan, building codes are stringent and reflect the country's exposure to both wind and earthquake hazards, but many existing structures predate the existence of these codes. Wood construction dominates residential exposures in Japan, and modern wood-frame houses exhibit good lateral resistance to wind loads; thus, major structural damage is expected to be limited at the wind speeds of the modeled storm. However, damage to roof coverings and windows can allow wind-driven rain to enter a building's interior and cause extensive damage to building contents. Furthermore, dislodged external components can become wind-borne debris that can cause extensive damage to surrounding structures.
Larger multi-family apartment buildings and commercial and industrial structures are generally engineered and made of reinforced concrete or steel. Damage is usually confined to nonstructural components, such as mechanical equipment, roofing, cladding, and windows.
A significant portion of Japan's industrial stock is of non-engineered light metal construction, which is one of the construction types most vulnerable to high winds. These buildings can experience extensive structural damage, and even collapse.
Estimating the Impact
AIR estimates that the simulated event featured here would cause insured losses of JPY 3.0 trillion (USD 29.4 billion) for all of Japan. Figure 3 shows the distribution of modeled loss by municipality.
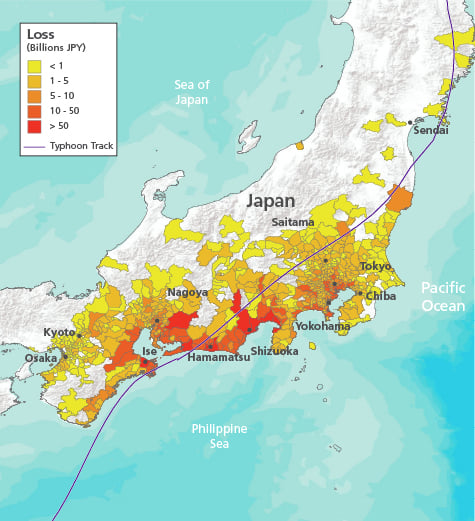
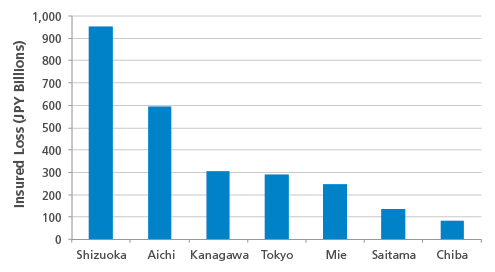
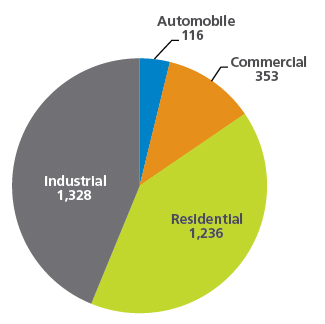
The coast from Mie to Shizuoka is hit hardest. A storm surge, similar in height and size to the storm surge generated by Typhoon Vera, flows into Ise Bay, causing moderate flood damage. However, the levees protecting Nagoya, which failed in 1959, hold this time. Powerful winds rake the coasts of Aichi, Mie, and Shizuoka prefectures. Together these three prefectures account for almost 60% of all insured loss from the modeled storm. Figure 4 shows insured losses in the most heavily affected prefectures.
Much of this loss is industrial because this region is a manufacturing hub and home to companies like Toyota, Brother Industries, Makita, Yamaha, and Suzuki. Note that insurance penetration for industrial and commercial lines is typically much higher than for residential lines, which is another contributing factor to high insured industrial losses. On an insurable loss basis, residential losses exceed industrial losses.
Shizuoka Prefecture alone sustains over JPY 950.6 billion (USD 9.2 billion) in insured loss. Most of this loss is to industrial exposures in Hamamatsu and around the northern portions of Suruga Bay. Shizuoka's residential loss, at JPY 293.3 billion (USD 2.8 billion), is also the highest of any prefecture. To the west, most of the JPY 594.8 billion (USD 5.8 billion) in Aichi prefecture is to industrial exposures on Atsumi Peninsula and in and around the city of Toyota.
With JPY 810.4 billion (USD 7.8 billion) in insured loss, the densely populated Tokyo metropolitan area (consisting of the prefectures of Chiba, Kanagawa, Saitama, and Tokyo Metropolis) accounts for 27% of the event's total insured loss, most of which is to residential properties. Strong winds affect all areas around Tokyo Bay and areas to the west, such as Hachioji, Machida, Suginami, and Nerima, but Edogawa and Ota are hit especially hard.
Are You Prepared?
Using model scenarios to probe your portfolio's strengths and weaknesses is responsible risk management practice. It is important to prepare for a wide range of scenarios in order to respond effectively when disaster does strike. This scenario is just one example of the extensive and widespread damage a typhoon could produce in Japan and around Tokyo. The insured loss for this event has a modeled annual exceedance probability of about 0.5% (a 200-year return period) for all of Japan, and about 1% (100-year return period) for Tokyo. This is not an extreme tail event; far greater losses are possible (see Extreme Disaster Scenarios box).
A few modeling best practices can help ensure that your model produces the most realistic loss estimates:
- Building response to potentially damaging winds is highly dependent on its location and attributes. Accordingly, collect accurate, detailed information for the properties that make up your portfolio—including location and all primary building characteristics such as construction type, occupancy, building age, height—and a true replacement value. Relying solely on coarse resolution address data can lead to significant over- or underestimations of risk.
- Be aware that typhoons in Japan can result in high flood losses. While precipitation was not a significant source of loss in this Megadisaster scenario, the AIR model provides the ability to separate wind and flood losses, which have different policy conditions in Japan. Note that storm surge is not currently explicitly captured by AIR's model, but will be included in an upcoming release.
- Note that losses from extra cleanup expenses and debris removal can be a significant source of additional insured losses (more than 30% for some policies). While not included in the industry losses in this scenario, clients can explicitly model these losses for their own portfolios.
- Consider the potential for business interruption losses. While not included in this scenario, clients can use the AIR model to calculate business interruption losses as a function of downtime, the level of damage sustained, the size of the building, and its architectural complexity.
- Note that highly concentrated losses can trigger demand surge, which is an increase in the cost of materials and labor after a large catastrophe due to limited supply. This event triggers demand surge of about 17% for building damage, which is included in the industry modeled losses.
- Finally, consider your loss ratio, or how your estimated losses compare to the "total insured value" in each affected area. While your losses may at first appear to be high, the loss ratio they reflect (typically less than 10% even in the worst affected region of this Megadisaster analysis) should be entirely consistent with an infrequent but thoroughly plausible catastrophic event.
Closing Comments
What will be the next megadisaster surprise?
AIR's models capture the behavior of physical phenomena and how those phenomena impact the built environment. They have been thoroughly validated using data from a wide variety of sources.
But no model can predict what the next megadisaster will actually be or when it will occur. This fundamental uncertainty makes it all the more important for companies to use catastrophe models to prepare for such losses. The full range of scenarios the models generate—simulating so many perils that impact so many places—provide a unique and important global perspective on an organization's overall risk. The careful analysis of model results can help risk managers prepare for many contingencies—thus ensuring that scenarios like the one presented here will not be entirely unexpected.
1 All USD amounts are based on an exchange rate of JPY 1 = USD 0.0097, current as of mid-March, 2014.
