


Introducing The Industry’s First Fully Probabilistic Tsunami Model
Mar 26, 2013
Editor's Note: A previous AIR Current presented a high-level overview of the most significant changes in 2013's update to the AIR Earthquake Model for Japan. This AIR Current provides additional detail about the new tsunami module, the development of which benefited from the abundance of scientific data and detailed insurance claims generated following the 2011 Tohoku earthquake.
Seismic Risk Assessment Must Include Tsunami
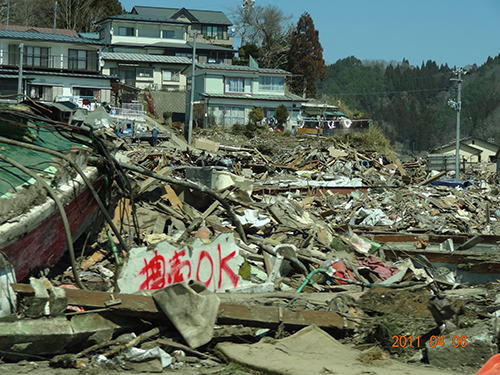
Two years ago this month, parts of eastern Japan were ravaged by a massive tsunami. This devastating series of waves—generated by the M9.0 Tohoku earthquake, the world's fourth largest since 1900—was the most damaging tsunami Japan had ever experienced. Towering over 10 meters in height, it rushed ashore, destroying coastal communities in minutes and demolishing nearly all structures in its footprint. Tsunami waters extended more than five kilometers inland, inundated nearly 535 square kilometers of Japanese soil, and killed almost 15,000 people.1
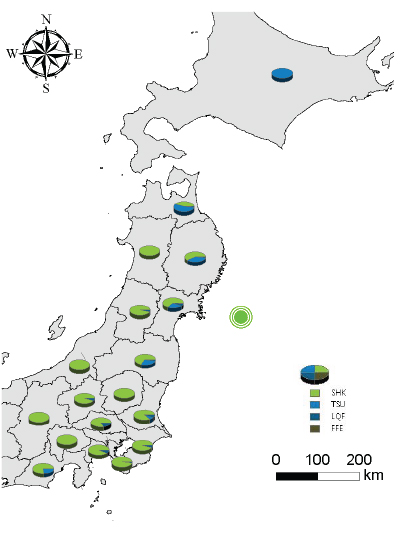
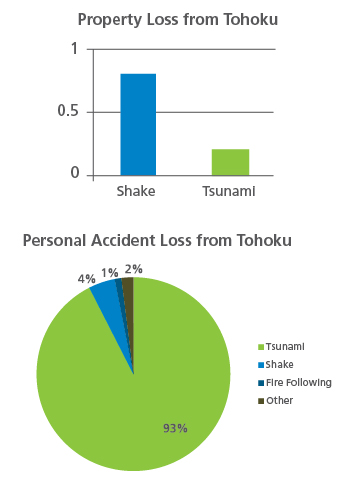
In addition to causing significant insured losses—which AIR estimates at between USD 4.6 and 7.6 billion (or roughly 15-25% of the Tokohu event's total insured losses)—the tsunami imparted important lessons. First, while ground shaking typically drives earthquake-related property losses, the tsunami peril drives noteworthy losses, too—particularly to marine lines of business (marine hull and cargo suffered between USD 1 and 3 billion2 in insured losses following Tohoku). Second, the tsunami peril—not ground shaking—dominates personal accident losses; 93% of Tohoku-related casualties were from drowning.

Dr. Peter Sousounis,
Meagan Phelan, CCM, and
Dr. Yue-Jun Yin
The article: Discusses Japan's vulnerability to tsunami. Because damage from tsunami is an insured peril, any comprehensive view of insured seismic risk in Japan can no longer ignore it.
Highlights: A simulation illustrates the utility of AIR's new tsunami module for estimating tsunami occurrence and damage.
Prior to Tohoku, the insurance industry had generally underestimated the risk from the tsunami peril, even though the massive Boxing Day tsunami3 occurred off Sumatra just seven years prior. Furthermore, available industry models did not account for tsunamis in a systematic way. The devastation wrought by Tohoku, however, had a substantial impact, illustrating that tsunami risk cannot be overlooked. Accurate seismic risk evaluation for Japan requires a multi-peril assessment.
Using the results of studies conducted in the aftermath of Tohoku—a period of industrywide earthquake model re-examination—AIR has developed a comprehensive view of Japan's earthquake risk. Critically, AIR's approach features the industry's first fully probabilistic tsunami module, a sophisticated tool capable of capturing both the complex nature of a tsunami's development and its behavior as it nears the coast and comes ashore (see the text box at the end of the article for an explanation on the generation and propagation of tsunami waves). AIR scientists and engineers developed the tsunami module by enhancing the widely known TUNAMI4 dynamical numerical model, which applies the same equations of motion used to model the atmosphere.
Other solutions that estimate tsunami risk are not fully dynamical numerical models; instead, they overlay a fixed wave height on exposure, a process that does not capture the dynamic rerouting of water (including changes in wave height and inundation extent due to water velocity) as the water and exposure interact. AIR's tsunami modeling methodology does. It also accounts for wave speed, which directly correlates to damage potential. And, critically, it tracks the time between a tsunami being at Point A and its arrival at Point B; accounting for this time span—the lead time evacuees have to get to higher ground—is essential for detailed personal accident claims.
Mechanisms of Tsunami Damage
The 2011 Tohoku event revealed the destructive power of the tsunami peril to the marine and personal accident lines of business. Tsunamis also cause damage to lines including industrial facilities, aviation, and railway. The damage is largely a result of three forces: inundation depth, water velocity, and the force from debris collision. The last of these, debris, was immensely destructive during the Tohoku event, when swirling waters pushed large structures—including 90 large commercial ships and hundreds of smaller vessels—into (and on top of) homes and buildings far inland.
Tsunami damage potential is also affected by the existence of flood defenses. Japan has a sophisticated coastal defense system of man-made barriers that spans roughly 40% of its coastline. It is possible that such defenses could be overtopped or breached, however, and when they are, water actually moves more forcefully and rapidly than it otherwise would (due to the height difference between the artificial wall of the flood defense and the neighboring floodplain); this leads to more extensive flooding than would naturally occur. During the Tohoku tsunami, waves overtopped several defenses, including a 10-meter seawall in Iwate Prefecture. In total, between 40 and 60% of the levees in affected regions of Japan were damaged or destroyed.
The vulnerability component of the AIR tsunami module not only accounts for inundation depth, water velocity, and debris, but also takes into consideration Japan's extensive defense system, including the probabilistic failure of levees due to the force of moving water.
AIR's tsunami damage functions were informed by an extensive study of the performance of different types of structures during the Tohoku event and were validated using a significant amount of detailed claims data. Damage functions were developed for different construction and occupancy types and building heights and take into consideration the depth and velocity of the water. The damage caused by debris collision is also modeled and is based on inundation depth and the nature of the debris.
AIR has developed tsunami damage functions for all lines of business, including specialized lines like marine hull and cargo. The marine hull evacuation process is explicitly modeled, and damage is only calculated if evacuation fails. Typical tsunami-related damage includes vessels drifting and grounding, overtopping, or colliding with each other or with breakwaters (coastal defense structures). Marine cargo (which includes dry bulk cargo, liquid tank, heavy cargo, cargo containers, and warehouse) is concentrated at sea ports and thus easily damaged by tsunami waves. A tsunami depth as shallow as 1.5 meters can dislodge a stack of three fully loaded cargo containers.
The tsunami peril also drives personal accident losses. Indeed, as previously mentioned, though ground shaking caused most of the property damage from the 2011 Tohoku earthquake, it was responsible for just 4% of the deaths (see Figure 2). Of the more than 15,000 people who died, nearly 93% were drowned. After the Tohoku event, about 53%5 of the affected population traveled to tsunami evacuation centers. Assessments of potential tsunami-related loss to the personal accident line of business must consider evacuation procedures, which vary with time of day, maximum wave arrival time, traffic conditions, and accessibility to evacuation buildings.
Separating Earthquake and Tsunami Losses
At present, insurance coverage for earthquake damage in Japan is not mandatory. It can be purchased as an optional addition to a fire insurance policy, and it covers not only ground shaking but also tsunami, fire-following, and liquefaction. Unlike wind and flood policy conditions in Japan, earthquake ground shaking and tsunami policy conditions aren't separate. However, insurers may soon issue policies covering tsunami only, or even policies excluding tsunami. In these cases, the ability to separate insured tsunami losses from insured ground shaking losses would be critical, and AIR's new tsunami module makes it possible to separate tsunami losses to better understand the damage potential of this peril.
Illustrating the Significance of the Tsunami Hazard
Many areas along Japan's coastline are at significant risk from large tsunamis (those 10 meters or higher). One of the benefits of catastrophe modeling is the ability to examine—and plan for—large damage scenarios, including those in which tsunami drives the loss. Stakeholders can use the AIR tsunami module to assess the potential tsunami damage from earthquakes of a variety of magnitudes and in a variety of locations off Japan.
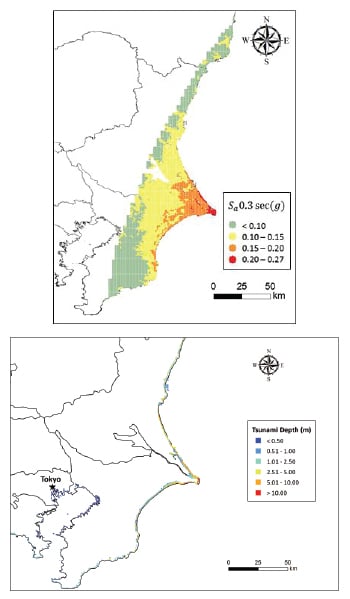
In the following example, the AIR tsunami module was used to simulate the ground deformation and tsunami from an earthquake 150 kilometers offshore and with a magnitude of 8.25. The event's epicenter is near the same latitude as Tokyo. Located in the prefecture of the same name, Tokyo is a major international hub with a population exceeding 13 million.
The tsunami from the simulated event impacts seven prefectures. Along the shore near the border of Ibaraki and Chiba Prefectures, it reaches a maximum height of 15 meters and a maximum inundation depth of 13.3 meters. Even though the temblor that spawned the tsunami was of a significant magnitude, the resulting seismic hazard is low because of the distance of the event from shore; indeed, the maximum ground shaking intensity (measured by 0.3 second spectral acceleration) is about 0.25g (Figure 3). At this level of ground shaking, even vulnerable wood-frame buildings would only experience minor damage, if any, and hardly any buildings would suffer severe damage. The tsunami hazard, by contrast, is quite high; waves exceed 10 meters in some areas—the height of the Tohoku tsunami. Tsunami contributes to more than 90% of the event's total insured loss.
The bulk of the simulated loss was in Ibaraki and Chiba prefectures, with only a small percentage coming from the densely populated Tokyo Prefecture. This is largely because Chiba Prefecture serves as a buffer to Tokyo Prefecture; thus, tsunami waves cannot directly impact it (in this scenario, wave heights in Tokyo Prefecture did not exceed 0.5 meters).
Stakeholders should bear in mind that tsunami losses typically don't contribute greatly to the average annual loss from earthquakes in Japan (or elsewhere), but they can contribute greatly to losses for individual earthquake events. Indeed, their contribution to damage and insured loss is most significant in the tail end of the earthquake distribution.
Conclusion
The Tohoku earthquake event served as a reminder that secondary perils, like tsunami, can be key loss-drivers; even though Japan had tsunami mitigation and evacuation procedures in place, in many cases, these proved inadequate.
One way to better prepare for large tsunamis is to model such events. Indeed, industry-leading efforts to increase the accuracy of catastrophe loss assessments need to extend to this peril. To meet this urgent need—and after months of data mining, model developing, and extensive calibration—AIR will soon introduce the first fully probabilistic tsunami module. It will contribute greatly to the industry's assessment of earthquake risks, particularly as tsunami modeling is expanded to assess risk in other tsunami-prone locations around the world.
From Fault Rupture to Flood on Land
Tsunamis form when a subduction earthquake occurs under the ocean. As one tectonic plate moves under another, part of the overlying plate is pulled downward, through friction, instead of smoothly sliding past. This process, much like the loading of a spring, builds the potential energy that can generate a tsunami; at some point, the tension becomes so great that the plate ruptures at or near the fault. The plate's upward springing action releases energy that in turn lifts a mound of water Figure 4a. How high, how rapidly, and how much water it lifts depends on the rupture characteristics of the event, including how abruptly the slip occurs and how deep it is under the ocean floor.
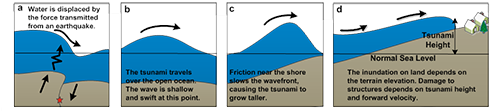
In many cases the rupture is complicated—numerous pieces rupture at once or in rapid succession, each with its own characteristics. The mound of water propagates outward in all directions, which is why earthquakes that occur just off the coast of Japan or in Indonesia can affect the west coasts of North and South America. Typically the wavelength (or horizontal dimension) of the water is much longer than the depth of the ocean; for this reason, the tsunami wave is considered a shallow wave Figure 4b. This type of wave moves very fast—typically at speeds of 500-800 km/h. Early on, its height (or amplitude) is very shallow, on the order of half a meter. Because of the long wavelength and small height, mariners on the deep ocean do not typically feel a tsunami wave passing below, even though it is moving at great speeds.
As the wave moves into shallower water, the speed decreases. The wavelength also decreases because the back of the wave moves faster than the front. In the convergence that results, the water has to go somewhere, and it goes up, increasing the wave height. As the wave moves farther still into shallower water, bottom friction slows it yet again Figure 4c. The slowing of the leading edge helps to further build the wave height.
By the time the wavefront reaches shore, its height can exceed 10 meters and it can still be moving 5-10 meters per second, forcible enough to push and drag buildings. As it comes ashore, the local elevation ultimately determines just how far inland it will go. Mountainous coastline prevents a tsunami from extending too far, for example. The effect of elevation is indeed significant; observations after several tsunamis in Japan's history showed a sharp drop in damage with just a slight change in elevation (Figure 5).
1 National Police Agency of Japan, 2013
2 Clyde & Co.
3 Because this event impacted under-industrialized areas in the Indian Ocean, it did not cause the property damage seen in Japan in 2011.
4 Tohoku University's Numerical Analysis Model for Investigation of Near-Field Tsunamis (TUNAMI) is a well-known numerical model.
5 Central Disaster Prevention Council
