


Earthquake in Australia: Are You Prepared?
Sep 19, 2013
Event: Magnitude 5.7 earthquake
Model: AIR Earthquake Model for Australia
Stochastic Event ID: 510000098
Location: 138.86°E, 34.75°S; approximately 21 kilometers (13 miles) northeast of central Adelaide
Epicenter depth: 4.7 kilometers (3 miles)
Estimated insured loss: AUD 14.5 billion (USD 13.1 billion)
Annual exceedance probability: ~1% (100-year return period)
Event Overview
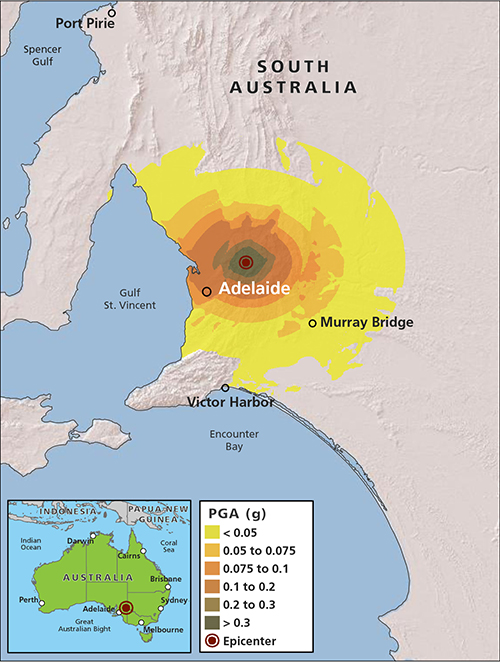
A medium-strength—but very shallow-depth—5.7 magnitude earthquake strikes southern Australia, its epicenter located less than 25 km from downtown Adelaide, the capital of the state of South Australia and the country’s fifth largest city. The rupture takes place along the Eden Burnside Fault at a depth of just 4.7 km, causing intense and often violent ground shaking throughout much of the city.
Damage is widespread, but seldom completely destructive. Residential buildings and older commercial structures are most impacted, incurring ceiling, wall, and veranda collapses, damaged facades, and extensive cracking. The large industrial facilities in Adelaide’s nearby suburbs, which include auto and high-tech manufacturing plants, experience the loss of power and other utilities. There, the intense shaking damages walls, overturns shelves and storage units, and shuts down some assembly lines. Roads, bridges, and other infrastructure are disrupted across metropolitan Adelaide.
AIR estimates that if such an event were actually to happen today, insured losses would amount to AUD 14.5 billion (USD 13.1 billion); insurable losses would reach AUD 17.4 billion (USD 15.7 billion) .
Figure 1 shows the pattern of peak ground acceleration (PGA) emanating from the earthquake's epicenter in this AIR scenario.

Australia's Tectonic Setting and Earthquake History
Australia lies in the eastern portion of the Indian-Australian Plate. It is entirely an intraplate region located far from any plate boundary—where plates pass alongside, push against, pull apart, or move under one another. Such movement, which causes plates to come into direct contact with one another, is the immediate cause of most earthquakes.
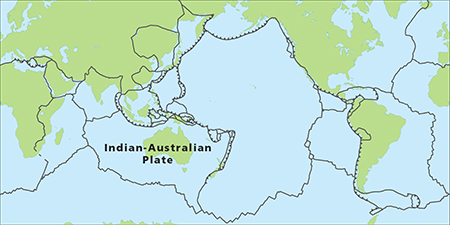
However, intraplate earthquakes do happen, although their causes are not entirely understood. In the case of Australia, recent studies suggest that one factor could be that the Indian-Australian Plate may be in the process of breaking up. The eastern—Australian—part of the plate is moving northward at a rate of about 6 cm (2.4 inches) per year, while the western—Indian—part, is butting up against the Eurasian Plate (and uplifting the Himalayan Mountains). This part of the plate moves at a rate of only about 3.7 cm (1.5 inches) per year.
South Australia experiences about 20 tremors a year, although most are below magnitude 3.5. Adelaide is considered by Geoscience Australia (the Australian national geological survey) to have the highest seismic risk of any Australian state capital or city of its size. It has suffered more medium-size earthquakes in the past 50 years than any other city. In fact, an earthquake that took place there in 1954—which closely matches the scenario described here—remained the most damaging earthquake to strike Australia for more than a century until the 1989 Newcastle, New South Wales, earthquake struck.
The Adelaide and Newcastle earthquakes were of similar magnitude—M5.4 and M5.6, respectively—and although about the same number of buildings were damaged in both cities—more than 30,000 in Adelaide and about 38,000 in Newcastle—Newcastle in 1989 had less than two-thirds the population Adelaide had in 1954 (fewer than 300,000 people compared to about 485,000). Damage ratios from the two events were roughly comparable, about 5% for Adelaide and around 6.5% for Newcastle.
Table 1 shows AIR modeled losses for these two events and for three other significant loss-causing historical earthquakes in the model's historical event set.
Table 1. Modeled insured and insurable losses for historical earthquakes, based on 2011 exposures (AUD millions)
| Event | Insured Loss | Insurable Loss |
|---|---|---|
| 1954 Adelaide | 14,787 | 17,435 |
| 1989 Newcastle | 6,242 | 7,338 |
| 1868 Newcastle | 2,192 | 2,587 |
| 1968 Meckering | 1,546 | 1,828 |
| 1961 New South Wales (Roberts and Bowral) | 1,255 | 1,487 |
Because of their similar characteristics, the recurrence of the 1954 event has a very similar loss to the Megadisaster scenario (the 1954 earthquake had a slightly lower magnitude, but a shallower depth). Note that for all these earthquakes, were they to happen today with today's exposures, insurable losses are only slightly larger than insured losses. This reflects the high take-up rates for earthquake insurance in Australia.
Affected Exposure
Australia's non-life insurance market is the 11th largest in the world, and—despite a record number of weather-related catastrophes since 2006 and the 2008 financial crisis—both the Australian economy generally and the Australian insurance market specifically have continued to grow.
Most of Australia is sparsely settled. The bulk of exposures are in its major cities and suburbs. Because Australia is relatively tectonically stable and few intense earthquakes occurred in more densely populated areas until the second half of the 20th century, not much attention was paid to establishing or following building codes and construction standards.
Even following the 1954 Adelaide earthquake, progress to adopt building codes was not made until the small town of Meckering, about 130 km (80 miles) east of Perth in the state of Western Australia, was essentially destroyed by a magnitude 6.9 earthquake in 1968. Of the 78 private and commercial buildings in the town, only 19 remained standing. The Standards Association of Australia (SAA), in 1979, issued the “SAA Earthquake Code”—but it was implemented only in South Australia (in 1983) and Western Australia, and even in those states it was seldom put in practice (and masonry construction was left exempt from design requirements).
Modifications and updates to the code were issued in 1993, and in 1995 the code became part of the Building Code of Australia, making it applicable to all regions of the country. The code was revised and expanded in 2008 to include provisions to mitigate more earthquake hazard factors.
Given this history, building vulnerability varies across Australia even while construction types often are similar. Australia's historical earthquake experience of relatively moderate-magnitude earthquakes has meant that residential buildings suffer the majority of the damage, as well as the most severe damage. In South Australia State, most single-family homes are timber frame or non-reinforced masonry structures that employ one of a variety of cladding materials.
Masonry veneer (specifically clay brick veneer) is often used as cladding for low-rise residential buildings, but the veneer is non-structural and is connected to the frame with brick ties. However, the ties are typically attached to the timber frame with nails, which have proven to be vulnerable under earthquake loading. Cavity double brick construction became increasingly common in the last century, but this type of construction renders the outer brick wall especially vulnerable to earthquake ground shaking. This building type was the most extensively damaged in the 1989 Newcastle earthquake.
The overall distribution of insurable exposures in the state of South Australia by construction types and lines of business is shown in Figure 3.
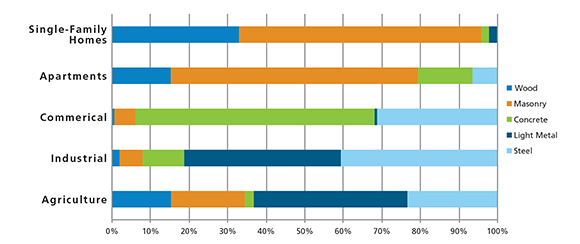
The distribution shows that for the residential line of business, 96% of single-family homes and 79% of apartments consist of some type of non-reinforced construction. More than 90% of commercial structures, which generally have fared better in earthquakes, employ concrete or steel frame construction.
Estimating the Impact
Figure 4 provides a comparison between the pattern of ground shaking intensity for the AIR scenario (shown in Figure 1) and the pattern of potential losses as indicated by CRESTA zones.
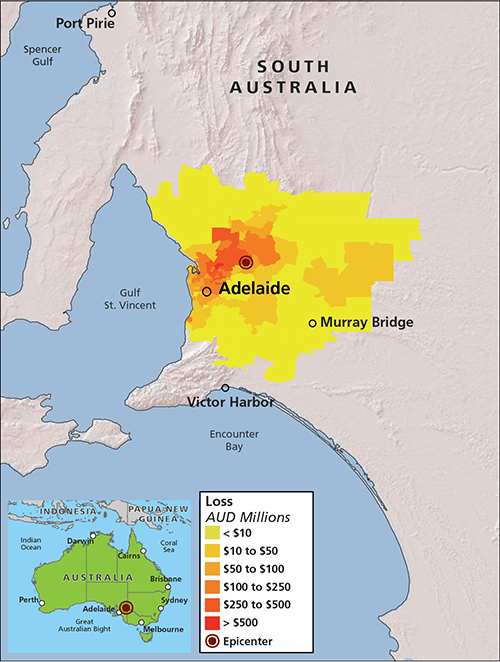
Adelaide is situated between the coast of the Gulf of St. Vincent and, to the east, the Mount Lofty Ranges. The Eden Burnside Fault effectively traces the foothills of the Ranges, and the geography of these low mountains affects the intensity of ground shaking in their vicinity. The Mount Lofty Ranges are hard rock, while to both their east and west, the land is largely soil, which amplifies ground motion. The irregular contours of ground shaking and losses to the west on both maps indicate the jagged outline of the mountains as the land stretches out into the mixed soil of the South Australian plains.
The areas that show loss concentrations are both widely residential and contain some of Adelaide's most important modern economic enterprises. Adelaide is home to more than 40% of Australia's high-tech electronics industry, which accounts for about 14% of all manufacturing jobs in the city; a major contractor is the Australian defense establishment.
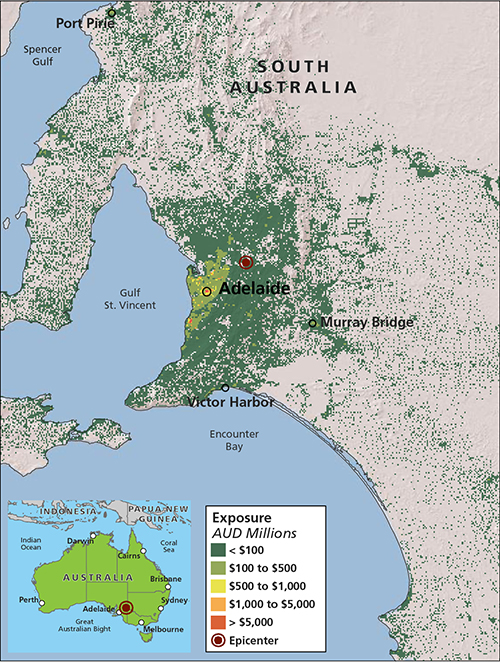
Concentrated losses are also found north of the epicenter; the small town of Williamstown is situated about 10 km (6 miles) from the epicenter, at the opening to the Barossa Valley, one of Australia's wine-growing regions. An "island" of slightly raised losses also shows to the east, on the far side of the Mount Lofty Ranges. This is largely farm and ranch country, but it is dotted with small (and seismically vulnerable) towns like historic Mannum on the Murray River. Today a prosperous tourist destination, it once was a major river port and ship-building center. An overall view of exposures in the Adelaide area is given in Figure 5.
The damage wrought by the 1954 Adelaide earthquake can give some insight into the large losses that the model scenario produces. The scenario epicenter is only about 25 km (16 miles) away from the 1954 epicenter, and the magnitude of the two quakes is about the same (M5.4 in 1954, M5.7 for the scenario). Although Adelaide's population has increased nearly threefold since 1954, except for the most modern structures, much of Adelaide's exposure remains similar in vulnerability to those in 1954. In 1954, claims were filed for 22% of all buildings in the city.
The total estimated insured losses for the stochastic scenario, as stated earlier, come to AUD 14.5 billion (USD 13.07 billion). By line of business, these losses break down to:
| Modeled Loss | ||
|---|---|---|
| Line of Business | AUD millions | USD millions |
| Residential | 12,126 | 10,932 |
| Commercial | 1,228 | 1,107 |
| Industrial | 1,035 | 933 |
| Auto | 35 | 32 |
Even in the worst-affected areas, loss ratios would not be expected to exceed 30%.
Are You Prepared?
Using model scenarios to probe your portfolio's strengths and weaknesses, as demonstrated in this exercise, is simply responsible risk management practice. It is important to prepare for a wide range of scenarios in order to respond effectively when disaster does strike. The scenario outlined here is just one of many plausible high loss earthquake scenarios that could occur in Australia. If the estimated losses seem high for a 5.7 magnitude event, they reflect the actual vulnerability and exposure characteristics of the affected area. In fact, the scenario represents an annual exceedance probability of about 1% (roughly a 100-year return period loss). This is not an extreme tail event; far greater losses are possible.
Not reflected in the scenario are the additional potential losses to uninsured structures, such as government buildings, schools, and churches, many of which may have been built before building codes were issued and enforced. Other nonmodeled sources of potential loss include damage to public infrastructure such as roads, bridges, and power, natural gas, water, and sewer lines.
A few modeling best practices can help ensure that your model produces the most realistic loss estimates. These include:
- Building response to earthquake-induced ground motion is highly dependent on both the building's precise location relative to the earthquake's epicenter and the characteristics of the soil on which it rests. Accordingly, collect accurate, detailed location information for the properties that make up your portfolio. Relying solely on coarse resolution address data can lead to significant over- or underestimations of risk.
- Building attributes play a central role in establishing a particular structure's vulnerability in response to seismic ground motion. Collect and input detailed data when you define your exposures. This means accurately capturing all the primary building characteristics of the exposures: construction type, occupancy, building age, height—and a true replacement value.
- Be aware of nonmodeled sources of insured loss. Not discussed in this scenario, for example, are possible losses attributable to landslides, fires following the earthquake, or to the impact of a tsunami (although in this scenario a tsunami is not likely).
- Finally, also consider your loss ratio for properties in the impacted CRESTA zones. That is, how do your estimated losses compare to the "total insured value" of the specific local area in which the losses were incurred? Your losses might at first appear to be high, but typically they reflect a loss ratio of less than 30%, a proportion consistent with an infrequent but plausible catastrophic event.
Closing Comments
What will be the next megadisaster surprise?
AIR's models are robust; they accurately capture the behavior of physical phenomena and how those phenomena impact the built environment. They have been thoroughly validated using data from a wide variety of sources.
But no model can predict what the next mega-catastrophe will be. This fundamental uncertainty makes it all the more important for companies to use catastrophe models to prepare for such events. The full range of scenarios the models generate—simulating so many perils that impact so many places—provides a unique and important global perspective on a firm's overall risk. The careful analysis of model results can help risk managers prepare for many contingencies—thus ensuring that scenarios like the one presented here will not be entirely unexpected.
