


Earthquake Risk Due to Hotspot Volcanoes: The Case of Hawaii
Jul 24, 2013
Editor's Note: The 2013 update to the AIR Earthquake Model for Hawaii features an improved understanding of seismicity, enhanced ground motion prediction equations, and new damage functions that better reflect the vulnerability of Hawaii's building stock.
On June 15, 1990, Mount Pinatubo, on the island of Luzon in the Philippines, awoke from its 500-year slumber to produce the second largest volcanic eruption of the 20th century. Nearly a year before, Luzon was shaken by a magnitude 7.8 earthquake epicentered about 60 miles northeast of the volcano. Thousands of smaller earthquakes also occurred in the months leading up to the eruption as magma moved toward the surface from more than 20 miles below the volcano. Like most volcanoes, Mount Pinatubo is located along the boundary of tectonic plates. It is here where massive pieces of the earth's rigid outer shell, or lithosphere, converge or diverge, producing most seismic and volcanic activity.
How can you identify locations at high risk to lava flows? Learn more here.
But volcanoes and seismic hazards exist, too, in the interior of tectonic plates. The Hawaiian Islands, for example, sit well within the interior of the vast Pacific Plate. On Hawaii, earthquakes accompany the movement of magma within and under active volcanoes such as Mauna Loa, Kilauea, and Hualalai, and sometimes release the strain that accumulates along the flanks of these volcanoes. These and other volcanoes also influence Hawaii's seismicity, as their heavyweight can stress the Pacific lithosphere to the point of triggering an earthquake. The culmination of these risks produces seismic hazard on the south side of Hawaii Island that is comparable to that of coastal California, even though Hawaii is far from any plate boundary. This article discusses the earthquake risk across the Hawaiian Island chain and how the AIR Earthquake Model for Hawaii captures the complexity of the risk.
Historical Seismicity of Hawaii
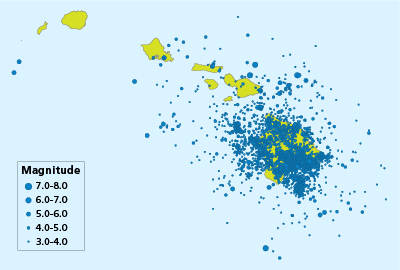
Thousands of earthquakes occur every year on and around Hawaii Island (also called the Big Island). Most of these temblors are too minor to be felt but some are strong enough to cause minor to moderate damage. Earthquakes are particularly common on the south side of the island, where the largest events have taken place and where the historical earthquake rate is relatively high (as shown in Figure 1). While approximately 20 earthquakes of magnitude 6.0 or greater have occurred on or very close to the Big Island since 1868, only six events have taken place northwest of Hawaii Island, from Maui to Molokai. This decrease in historical seismicity from the southeast to the northwest across the island chain is a result of Hawaii's geologic history—a unique combination of plate tectonics and hotspot volcanic activity.
 By: Dr. Khosrow Shabestari
Principal Scientist
 By: Dr. Claire Pontbriand
Scientist, Seismology
 By: Kathryn Fobert
Science/Technical Writer
Edited by Nan Ma
The article: Explains how volcanoes both directly and indirectly influence seismicity on the Hawaiian Islands and describes how the AIR model captures the hazard.
Highlights: AIR's updated model reflects a deeper understanding of the soil conditions on Hawaii Island and incorporates the latest research on the effects of ground shaking in the region.
Hawaii's Origins
The Hawaiian Islands are located at the southeastern end of an extensive volcano chain consisting of hundreds of islands, islets, and seamounts (submarine mountains) spread across approximately 1,500 miles in the central Pacific Ocean. These islands formed nearly 70 million years ago as a result of a hotspot deep within earth's mantle. The hotspot caused a plume of magma to rise up through the Pacific tectonic plate and erupt at earth's surface. Over time, countless eruptions caused a seamount to rise from the ocean floor until it finally emerged above sea level to form an island volcano. Appropriately, this type of volcano is known as a hotspot volcano.
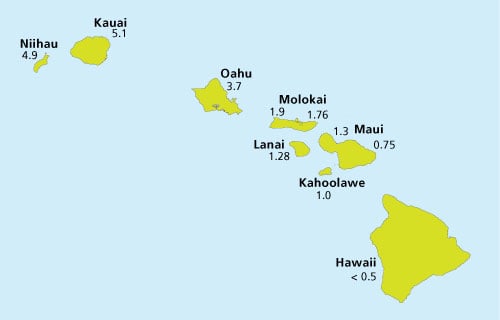
As the Pacific tectonic plate moved in a northwesterly direction, it carried the seamount with it while the Hawaiian hotspot remained fixed in place. While this seamount was cut off from the source of the hotspot, a new seamount formed in its place. Over time, these successive seamounts caused an undersea mountain range, known as the Hawaiian-Emperor seamount chain to form. The oldest seamounts have since eroded to below sea level; today's state of Hawaii comprises the still exposed peaks of the (relatively) youngest mountains. As a result of being both older and farther from the hotspot, which today is located roughly beneath the southeastern side of the Big Island, the northwest Hawaiian Islands have lower rates of volcanic and seismic activity. The eight main islands and their ages are shown in Figure 2.
AIR Seismicity Model for Hawaii
The AIR Earthquake Model for Hawaii captures the diversity of the regional hazard by way of a 10,000-year catalog of nearly 15,000 simulated earthquakes. Regional seismicity along the island chain is modeled by five types of seismic source zones, including the flanks (sides) of active volcanoes on the Big Island, Kilauea rift zones (fissures along the sides of volcanoes), shallow smoothed seismicity zones, deep smoothed seismicity zones, and a single large zone encompassing the northwest islands. In total, AIR has identified 22 seismic source zones at two depths, which are consistent with those used by the U.S. Geological Survey1 (Figure 3). AIR's stochastic catalog was developed using all available hazard data on geological faults and volcanism, as well as historical earthquake data (1868-1959) and a modern catalog of earthquakes through 2010 collected by the Hawaiian Volcano Observatory's seismic network.
Earthquake hazard on the Hawaiian Islands is greatest along the flanks of the Big Island's active volcanoes (Kilauea, Mauna Loa, and Hualalai). The volcanic activity here generates abundant small earthquakes and seismic swarms. Large earthquakes beneath the active volcanoes are caused by strain accumulating as magma builds up in the rift zones but does not reach the surface. The southern flanks of Kilauea and Mauna Loa periodically shift seaward, releasing the strain, making room for more magma, and generating temblors like the 1868 M7.9 Mauna Loa earthquake, the largest in Hawaii's recorded history.
Seismicity also comes from deep, non-volcanic earthquakes that are triggered by the release of long-term accumulations of lithospheric stresses due to flexure of the crust under the heavy load of the islands. These earthquakes typically occur at depths of 20-60 km. The 2006 M6.7 Kiholo Bay event and its M6.0 aftershock, both of which ruptured at a depth of 29 km on the northwest part of the Big Island, were likely generated by the release of stress due to crustal loading. The 2006 event was the strongest earthquake to affect Hawaii in the last 20 years; it caused more than 100 million (2006 USD) in economic losses in a relatively sparsely populated part of the island.
In the northwest Hawaiian Islands, away from the hotspot, the stress on the lithosphere has lessened over time due to the slow rebound of the Pacific plate. The AIR model captures the gradual decrease in seismicity northwestward by fitting a spatially smoothed decaying ramp to the historical catalog.
Ground Motion Relations and Local Soil Conditions
Ground shaking intensity at any given location depends primarily on earthquake magnitude, distance from the source, the rock through which the seismic waves travel, and the soils present at the site. As the seismic waves propagate outward from the initial source of the rupture, the wave amplitude attenuates, or decreases, as a result of the absorption and scattering of energy.
The AIR model calculates ground shaking intensity using ground motion prediction equations (GMPEs) that determine how quickly the waves attenuate. Typically, GMPEs are developed by performing a regression analysis of a database of strong ground motion recordings. The AIR model employs a weighted combination of relevant GMPEs for both shallow and deep crustal earthquakes.2
The local site conditions can dramatically increase or decrease the intensity predicted by the GMPEs. For example, if the incoming seismic waves are of low-to-moderate intensity, a site with soft soils may experience significantly higher levels of ground motion than a rock site, especially from low-frequency seismic waves, which are most damaging to mid- and high-rise buildings. The process is more complex for high-intensity ground motion due to the nonlinear behavior of soil materials. The soil classification map developed for the AIR model (Figure 4) indicates that the basalt around much of Hawaii Island is a combination of soft to firm rock (soil type C), soft rock (soil type CD) or stiff clay and sandy soil (soil type D).

Conclusion
The Hawaiian hotspot is responsible for the formation of the Hawaiian Islands and for the region's volcanic and seismic hazard. However, as the historical catalog of events in the region indicates, the seismic hazard is not uniform across the island chain, but rather declines from southeast to the northwest. Variant soil types on each island and from one island to the next further contributes to the hazard by possibly amplifying or deamplifying seismic waves. The AIR model captures all of these factors by probabilistically modeling the hazard in five types of seismic zones, implementing appropriate ground motion prediction equations, and capturing the effects of local soil conditions. The model represents the latest available data and scientific literature on seismicity and ground motion of Hawaii.
1 Klein, et al., "Seismic Hazard in Hawaii; High Rate of Large Earthquakes and Probabilistic Ground-Motion Maps", Bulletin of the Seismological Society of America, 2001.
2 For a list of the GMPEs employed in the AIR Earthquake Model for Hawaii and their weighting factors, please see the model documentation available for clients to download at www.air-worldwide.com.
