


Best Track Data
Jan 24, 2013
Editor's Note: Historical data are an essential building block of catastrophe models. It is important, therefore, to use the best available. In this article, Senior Scientist Jason Butke describes what best track data consist of and how they are obtained, what agencies are responsible for collecting them in each ocean basin, and why they are important in catastrophe modeling.
Every year, on average, 84 tropical storms (including 43 hurricanes) form around the world, with considerable variability by ocean basin. Basin size and location, proximity to continents (dry air), sea surface temperatures, wind shear, and relative humidity, to name several, all contribute to tropical cyclone variability by region. To study how these factors affect tropical cyclone formation, make seasonal and real-time forecasts, and assess potential losses in catastrophe modeling, researchers depend on best track data.
Best track data represent not only the "best" location (storm track) estimates for tropical cyclones throughout the lifetime of the storm, but also the intensity (central pressure and/or wind speed) estimates at each point along the track. Because these storms are complex and highly dynamic and observations are limited and subject to uncertainty, scientists need to conduct post-event analysis of all available data to ensure that each storm is appropriately represented in the best track data set. Best track data have a wide range of applications across disciplines. Wind engineers use best track data to inform the development of building codes; forecasters use them for model validation; and climatologists use them to study climate change. In catastrophe modeling, researchers use best track data to develop and validate probabilistic landfall frequency and intensity estimates to inform a long-term view of tropical cyclone risk.
This article discusses how these data are developed, sources of uncertainty in the data, and how the data are used in catastrophe modeling.
Regional Specialized Meteorological Centers
The World Meteorological Organization's (WMO) Tropical Cyclone Program (TCP) aims to minimize the loss of life and damage caused by tropical cyclones. As part of achieving this objective, the TCP is tasked with providing tropical cyclone track and intensity forecasts as well as best track data for historical tropical cyclones.
The WMO divides regions of tropical cyclone formation into seven basins, monitored by six Regional Specialized Meteorological Centers (RSMCs) and six regional Tropical Cyclone Warning Centers (TCWCs), which have similar responsibilities (see Figure 1 and Table 1). Note that tropical cyclones have been observed in the Mediterranean Sea and off the coast of Brazil; however, due to the infrequent occurrence in these regions, the WMO has not designated a forecast center for these regions. Best track data are the official responsibility of Regional Specialized Meteorological Centers (RSMC) and are updated each year with the previous year's tropical cyclone information.

By: Jason Butke
Edited by Sara Gambrill
The article: Describes what best track data represent, compares the tools used to obtain them, their sources of uncertainty, and how AIR uses the data to inform a long-term view of tropical cyclone risk.
Highlights: Aircraft reconnaissance and the Dvorak technique are two methods for gathering best track data, and both are subject to uncertainty for different reasons. In addition, The HURDAT Reanalysis Project's findings have broad implications for perceived tropical cyclone risk
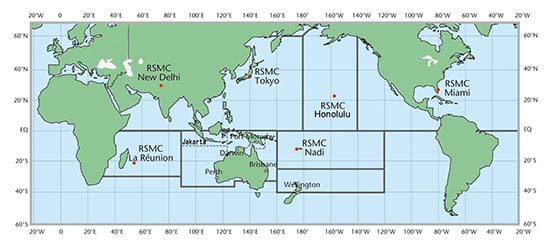
In each basin, RSMCs and TCWCs are responsible for collecting and disseminating all tropical cyclone-related information, including advisories, warnings, and best track data. The National Hurricane Center (NHC; RSMC Miami) and the Japan Meteorological Agency (JMA; RSMC Tokyo) are two well-known and busy centers.
| Agency | Alternative Name | Ocean Basin | Year Range | TC | TS | Hurr |
| RSMC Miami3 | National Hurricane Center | Atlantic (I) | 1950-2011 | 11.1 | 11.1 | 6.3 |
| RSMC Honolulu | Central Pacific Hurricane Center | Central Pacific (III) | 1966-2003 | 3.7 | 2.5 | 1.2 |
| RSMC Tokyo3 | Japan Meteorological Agency | Northwest Pacific (IV) | 1977-2010 | 25.5 | 25.5 | 14.2 |
| RSMC New Delhi | India Meteorological Agency | North Indian (V) | 1990-2009 | 7.5 | 3.8 | 1.4 |
| RSMC La Reunión | Météo France | South Indian (VI) | 1981-2008 | 10.9 | 9.7 | 4.3 |
| TCWC Perth | Australian Bureau of Meteorology | Southwest Pacific (VII) | ||||
| TCWC Jakarta | Indonesian Agency for Meteorology | Southwest Pacific (VIII) | ||||
| TCWC Darwin | Australian Bureau of Meteorology | Southwest Pacific (IX) | 1960-2008 | 11.6 | 9.3 | 4.9 |
| TCWC Port Moresby | Papua New Guinea | Southwest Pacific (X) | ||||
| TCWC Brisbane | Australian Bureau of Meteorology | Southwest Pacific (XI) | ||||
| RSMC Nadi | Fiji Meteorological Service | South Pacific (XII) | 1992-2008 | 5.8 | 5.8 | 2.8 |
| TCWC Wellington | New Zealand Meteorological Service | South Pacific (XIII) | 1968-2008 | 5.6 | 2.8 | 0.2 |
Best Track Data Tools
The tropical cyclone tracking agencies all use remotely sensed, or satellite, data and land-based radar data to estimate storm intensity and location. The NHC is the only agency to also routinely fly aircraft into tropical cyclones to directly measure storm characteristics. One might assume that direct observation is superior to remotely sensed data, but that is not necessarily the case because both methods are subject to uncertainty for different reasons that are explained in the next section. The two methods are complementary, but aircraft reconnaissance is costly and not widely used outside of the U.S.
Aircraft Reconnaissance
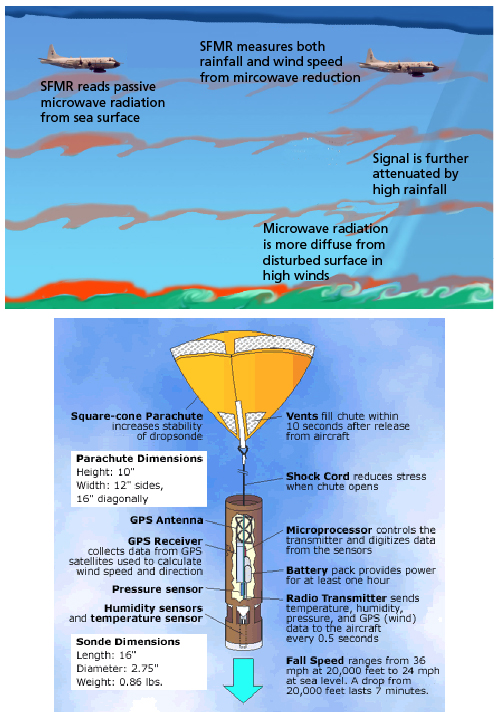
The NHC's aircraft reconnaissance teams, commonly referred to as "Hurricane Hunters," use dropsondes (instrumentation packets dropped from the aircraft) to measure a storm's characteristics within the vicinity of the plane, including wind speed and direction, pressure, temperature, and relative humidity. In addition, the planes use Stepped Frequency Microwave Radiometer (SFMR), a scatterometer that remotely estimates wind speed based on the ocean surface brightness temperature below the aircraft, and radar is used to remotely estimate precipitation intensity and wind speed and direction at various levels. All these tools provide unique information that allows meteorologists to estimate the current location, intensity, and movement direction of a tropical cyclone (Figure 2). All North Atlantic reconnaissance data can be found at https://www.nhc.noaa.gov/recon.php.
Aircraft reconnaissance data are subject to uncertainty for a number of reasons. It is not used consistently for all storms because of costs, different aspects of the entire storm cannot be sampled simultaneously, and planes need to return to base to refuel, resulting in data gaps. There is also uncertainty in peak wind speed measurements because it is difficult to determine where the strongest winds are occurring. Because the center of the storm circulation is typically easy to identify from satellite imagery or radar, there is less uncertainty in measuring the minimum central pressure of a storm using dropsondes, especially of intense storms with well-defined eyes.
Furthermore, how efficiently momentum is transferred from the mid-levels to the surface is constantly changing, which makes it difficult to know whether the peak wind was sampled. Because tropical cyclones are dynamic, there is also uncertainty in the assumption that the sampled part of the storm is representative of the entire storm. As a result, the NHC tends to be conservative in their estimates and errs on the high side for intensity estimates.
Satellite Remote Sensing
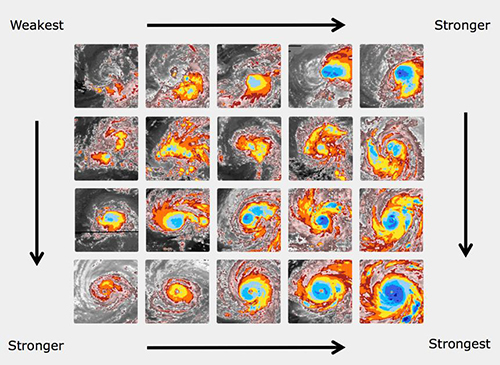
The majority of agencies that do not use aircraft reconnaissance heavily rely on the Dvorak technique4 to estimate tropical cyclone intensity. The Dvorak technique originated as a purely subjective cloud pattern matching technique in the late 1960s, then evolved to become a more objective assessment based on infrared satellite data in the late 1990s (Figure 3). The Dvorak technique uses satellite estimates of cloud-top brightness temperature (in general, the colder the cloud top, the more intense the storm).
Because storm size, environmental pressure, and sea surface temperatures (among other characteristics) vary by basin, basin-specific wind-pressure relationships were developed to estimate central pressure and wind speed.
Sources of uncertainty in the Dvorak technique relate to the inherent limitations in empirical methods, which allow for the possibility of subjective analysis and user error. Tropical cyclones are complex and dynamic systems; the relationship between cloud top temperature and surface wind speeds varies from storm to storm, even for ones that appear similar on satellite imagery.
HURDAT—The World's Best Known Best Track Data Set
The Atlantic hurricane database, or HURDAT, is maintained by the National Hurricane Center (RSMC Miami) and is arguably the most well-known and scrutinized best track data set in the world. Beginning in the late 1990s, the NHC has been reanalyzing and revising historical tropical cyclone data as part of the HURDAT Reanalysis Project. This effort improves upon earlier tropical cyclone frequency and intensity estimates and removes systematic biases and errors, some of which were the result of antiquated analysis techniques that are inconsistent with the latest understanding of tropical cyclones. Additional variables, including radius of maximum wind, environmental pressure, and various wind radii (distance from center to 34-, 50-, or 64-knot winds by quadrant), are also provided—if discernible in the data.
The HURDAT Reanalysis Project has a dedicated team of meteorologists who gather and analyze all available information about each tropical cyclone and make changes accordingly. New storms are often added, some are removed, and many have their intensity increased or decreased. The most recent systematic update is for the years 1936 through 1940 (adding to the already completed years of 1851 through 1935), in which two storms were downgraded one category. A key storm during this period was the Great New England Hurricane of 1938, also popularly known as the Long Island Express. While this storm was still deemed to be a Category 3 hurricane at its landfall in New York and New England, its peak sustained winds at landfall in New York were increased from 85 kt. (100 mph) to 105 kt. (120 mph) in the revision.
The previous update, for the years 1931 through 1935, had five storms downgraded one category and two upgraded one category. The two upgraded storms were in the Northeast (New Jersey and New York) and, because of the low climatological frequency in this region, the upgrades change the regional frequency from 12 to 14 landfalls, which in turn increases the perceived risk.
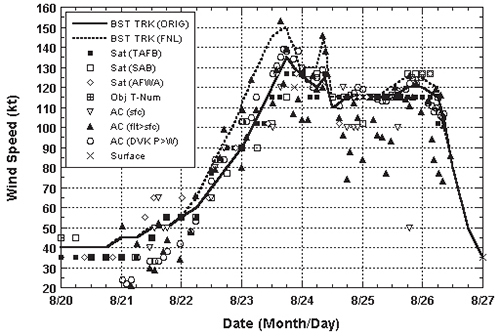
Outside of the systemic updates, some key historical storms have also been re-examined, including 1992's Hurricane Andrew. This hurricane was one of the most destructive in U.S. history and its intensity was a topic of debate for years. It had been officially designated a Category 4 based on its recorded wind speeds, but the winds were so intense that anemometers were either destroyed or failed prior to peak intensity. As a result, there were only a few reliable in situ observations near the eyewall. After a decade of reanalysis, the HURDAT Reanalysis Project's study concluded that Andrew had actually manifested Category 5 conditions when it made landfall. Andrew's best track data were eventually updated and released in 2002 (Figure 4). (Please read "A Note on the Reanalysis of Hurricane Andrew's Intensity" for more information on this topic.)
Closing Thoughts
Catastrophe modelers use best track data to gauge the frequency and intensity of tropical cyclones in a region and assess changes in regional—or global—tropical cyclone frequency. However, because the historical record alone is not long enough to capture the full range of possible storm experience, statistical methods are applied to the data to create a more robust sample.
Using techniques such as probability distributions, kernel density smoothing, Gaussian noise, and autoregressive time series models, AIR can construct 10,000-, 50,000-, or even 100,000-year stochastic catalogs of storm occurrence. The large size of the catalogs reduces some of the uncertainty in the best track data, removing biases and addressing data gaps. And, because the catalogs are fully probabilistic, the storm tracks generated are not limited to those that have been observed historically.
Best track data form the basis of developing a robust and long-term view of tropical cyclone risk around the world.
Franklin, J.L., M. L. Black, and K. Valde, 2003: GPS dropwindsonde wind profiles in hurricanes and their operational implications. Wea. Forecasting, 18, 32-44.
Landsea, C.W., J. L. Franklin, C. J. McAdie, J. L. Beven II, J. M.Gross, R. J. Pasch, E. N. Rappaport, J. P. Dunion, and P. P. Dodge, 2004: A re-analysis of Hurricane Andrew's (1992) intensity. Bulletin of the American Meteorological Society, 85, 1699-1712.
Sousounis, P., 2008: Changing the way we measure hurricane intensity. AIR-Currents, Feb 2008. Available online: http://www.air-worldwide.com/_public/NewsData/001409/AIRCurrents_HurricaneIntensity.pdf.
1 http://www.nhc.noaa.gov/aboutrsmc.shtml As taken from IBTRaCs
2 (www.ncdc.noaa.gov/oa/ibtracs/index.php?name+rsmc-data), and truncated to provide similar ranges, where possible.
3 Does not track tropical depressions
4 https://journals.ametsoc.org/doi/abs/10.1175/1520-0493%281975%29103%3C0420%3ATCIAAF%3E2.0.CO%3B2
