


Capturing Correlation in Agricultural Risk Models
May 24, 2012
Editor's Note: A previous article, "Introducing a Crop Loss Model for China," presented an overview of AIR's newest agriculture risk model. In this article, Dr. Gerhard Zuba further details the significance of spatial correlation in a weather-based approach to agricultural modeling, and explains how AIR's Agricultural Weather Index (AWI) technology explicitly captures the effects of spatially correlated weather events on modeled losses.
In April 2011, southern China was suffering the effects of a severe drought; agricultural land across several provinces was devastated. Among the hardest hit provinces were Guangdong and Hunan, where thousands of people suffered from a shortage of drinking water. More than 2.4 million mu (160,000 hectares) of crops were affected by the drought in Guangdong, and more than 1.8 million mu (121,300 hectares) in the neighboring Hunan province.
A few months later, in June 2011, deadly floods along the Yangtze River inundated eastern China. In addition to damaging thousands of residential and commercial buildings, the floods ruined large swaths of cropland in several provinces, including the neighboring Hubei and Zhejiang provinces.
China is regularly impacted by these large-scale catastrophic weather events, which are responsible for 90% of all crop losses observed in the country. In terms of modeling such losses, there are two primary approaches: a weather-based approach, as employed by the AIR Multiple Peril Crop Insurance Model (MPCI) for China, and a purely statistical approach, based on historical production information. The advantage of the weather-based approach is that it uniquely captures the inherent spatial correlation of weather events such as the widespread drought in the spring of 2011 and the floods that followed in summer. The significance of spatial correlation in high-resolution agricultural risk modeling and how it is accounted for in AIR's modeled losses are discussed in this article.

By: Dr. Gerhard Zuba
Edited by Zahra Hirji
The article: Details the benefits of modeling the effects of widespread adverse weather events on crop losses for diverse portfolios.
Highlights: Weather is the predominant driver of crop losses in China. In the AIR Multiple Peril Crop Insurance Model for China, a weather-based approach to crop modeling ensures greater accuracy in modeled loss calculations. The inherent spatial correlation of weather events serves to validate model losses, a goal that pure statistical crop modeling cannot achieve.
Large-Scale Spatial Correlation of Weather Events
Weather perils—including drought, excessive precipitation, frost, hail, flood, and wind damage—disrupt crop growing conditions. If a weather event is especially severe or long-lasting, crops cannot recover and damage occurs. It is thus critical that any agricultural risk model accounts for the effects of adverse weather on agricultural yields.
The spatial extent of a weather peril depends on the type and intensity of the episode. Some weather episodes are localized, causing damage to a relatively small area. A typical hailstorm, for example, will likely impact only a few farms within a particular district. In contrast, a drought such as the spring 2011 event will commonly impact multiple provinces simultaneously. In general, perils that impose water-related stress on the environment—that is, perils that disrupt a region's normal water cycle—have the potential to affect large areas across the country. Droughts, for example, are responsible for over 50% of crop losses in China and can be the most geographically widespread peril for crop production. Recent major droughts occurred in 2007, 2009, 2010, and most recently in 2011.
Large-scale storm systems such as typhoons can also impact extensive areas. While the most intense winds are limited to near a storm's landfall location, heavy rains and related flooding can persist far inland. China, situated in the world's most active tropical cyclone basin, experiences more tropical cyclone landfalls than any other country. In 2011 alone, eight tropical cyclones made landfall in China. Widespread floods in China are not only caused by typhoons; heavy rainfall from thunderstorms and runoff from snow melt coming from the Himalaya Mountains are two other sources of flooding in China.
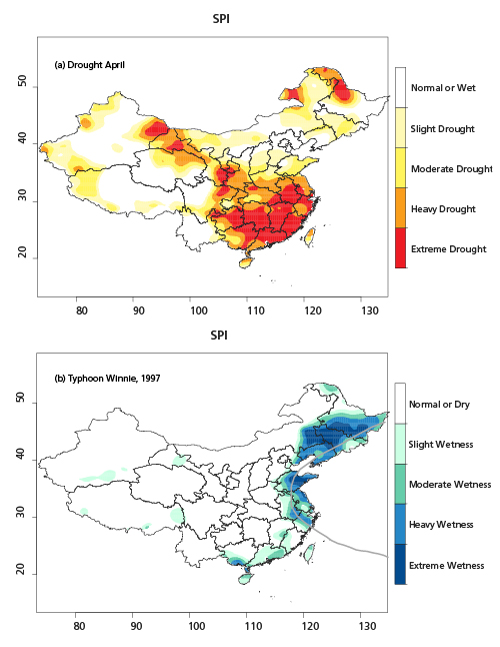
Two widespread weather events as measured using the Standardized Precipitation Index (SPI) are pictured in Figure 1. The SPI captures anomalies, or the deviation of precipitation levels from the norm. In the top panel, the spring drought of 2011 is captured in a snapshot of precipitation levels for the month of April. On the bottom, excessively wet conditions caused by Typhoon Winnie in 1997 are shown.
For large or small weather episodes, the most accurate picture of an event's damage footprint requires knowing the event's spatial extent. The degree of similarity in damage between provinces, or counties, affected by the same weather event is called correlation.
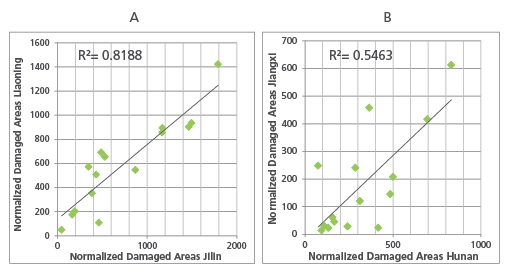
Figure 2 shows the spatial correlation in drought-related damage on a regional scale based on historical data between the years 1995 and 2009. Each point, colored green, represents observed normalized damage1 for a particular year for two sets of neighboring provinces. The degree of correlation between normalized damaged areas for the neighboring provinces is indicated by the R2 value. The higher the R2 value, the more correlated the provinces (i.e., the more likely it is that drought damage in one province will correspond to drought damage in the neighboring province). Note that differences in R2 values reflect China's varied climate regimes. The R2 value is larger for the set of northeastern provinces in Figure 2a, where drought is the major peril. The correlation between Hunan and Jiangxi provinces (Figure 2b) is lower because drought has less of an impact in southern provinces. Note that while the correlation is lower for Hunan/Jiangxi, it is still statistically significant.
Across different drought events, the degree of correlation between drought-damaged areas for various Chinese provinces is relatively high. Equivalent correlation levels between provinces for flood-induced damaged areas are lower. This is because rain events generally exhibit large intensity variations, even when they are widespread. The interaction of rainfall with certain geographical landscapes is another factor that might limit the area impacted by excessive precipitation; generally, low-lying areas are more flood-prone than hilly or sloped areas. Drought, in contrast, does not exhibit this same topographic influence.
AIR's Weather-Based Approach to Agriculture Modeling
Assessing the risk for a crop insurance portfolio requires adequately modeling the damage to crops from adverse weather. This process starts at a local level. Local weather conditions determine the success or failure of a growing season, as weather-related perils (e.g. drought, flood, frost, freeze, and wind) are the most important factors contributing to crop damage. The AIR MPCI Model for China accounts for local effects by subdividing the area of China into 50 km by 50 km grid cells and using historical temperature and precipitation data to help estimate the crop risk for each grid cell.
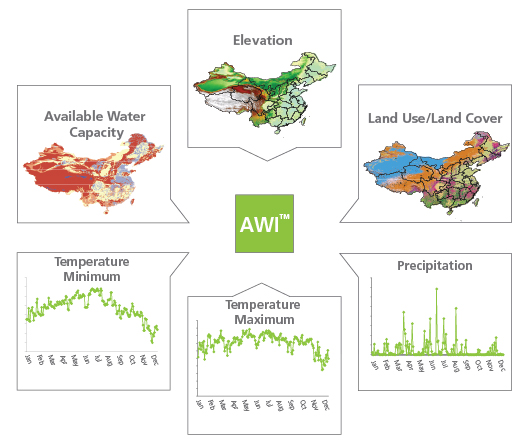
The AIR model takes the assessment a step further by simulating realistic weather events. This is achieved through combining weather and soil conditions with crop-specific information in a water balance model, which ultimately determines the water available to crops at any time during the growing season. Any deviation from the normal level is recorded. Using these deviations AIR developed a crop-specific index—the Agricultural Weather Index (AWI)—that summarizes crop health, which is translated into yield potential at the end of the growing season for any location (grid cells) within China (Figure 3). Any crop yield shortfall at harvest is translated into monetary losses after the application of policy conditions.
Historical data lays the foundation for agricultural risk modeling. AIR's model employs a diverse set of historical hazard, crop, and crop damage information. AIR simulations are constrained by hazard and crop parameters, as well as weather peril dynamics, thus ensuring that appropriate spatial correlations are captured in crop losses.
In statistical modeling, complex pattern recognition algorithms are needed to capture the large-scale spatial weather correlations between every county within China—a method that demands significant data. Purely statistical crop risk models rely heavily on historical yield information, which is not readily available on the same temporal and spatial resolution as weather information in China. Additionally, yield-based modeling requires accounting for crop practices and technology changes. It is difficult to develop complex pattern recognition algorithms and account for changing crop practices and technology if high resolution yield data is limited.
Impact of Spatial Correlation on Crop Insurance Portfolios
There is significant variability in where weather events will generate damage and losses. Agricultural risk modeling that accounts for spatial correlations helps insurers better understand this variability and prepare for it. To prevent against large losses, companies commonly turn to portfolio diversification—insuring properties in multiple provinces. Diversifying a portfolio helps protect companies against catastrophic small-scale weather events, such as hail, but still leaves companies susceptible to losses from widespread weather events. With the AIR MPCI Model China, companies are guaranteed that large-scale weather-related spatial correlations are accounted for in their portfolio analysis.
While it is possible to model losses from large-scale weather events on a province level, it is more accurate to determine losses on a county level. In fact, computing more localized losses by way of high resolution weather-based modeling is beneficial for accurately determining recovery payments from the Chinese government's crop insurance program.
China's government protection program is designed to stabilize the country's insurance market when large and widespread losses occur—as is likely in a multiple peril crop insurance program. The government program does this by reducing the variability of weather-related losses within a given province by limiting the losses incurred by insurance companies. Specifically, government protection may be implemented as a refund for a portion of losses above a certain threshold, or as a cap to potential total losses experienced by a company. If losses are capped to a certain level, the government assumes all the losses above a defined loss ratio (ratio of sums of paid claims to sums of collected premiums).
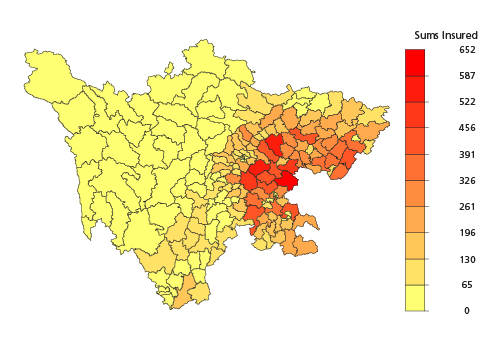
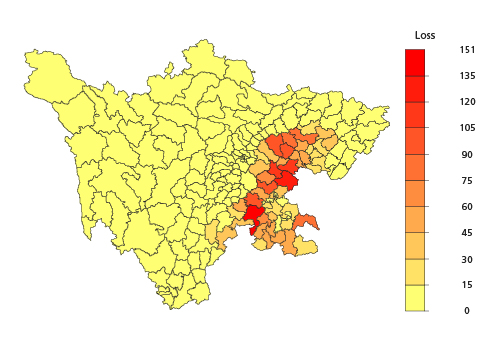
Government protection applied on a local level, i.e. a city or county level, will differ in impact from protection applied on a province level. This is explored using a simulated loss scenario in the AIR MPCI Model for China. The insurable crop values for all modeled crops in Sichuan province are shown in Figure 4. The counties with the highest value of crop production is clustered to the east, and not spread uniformly across the entire province. In a simulated year, the highest insurable losses were experienced in some eastern counties (Figure 5). The pattern of loss and the pattern of value of production in general do not overlap precisely. Usually, some counties experienced heavier damage than others, and the resulting county-level loss ratios are not uniform over the entire province, as shown in Figure 6.
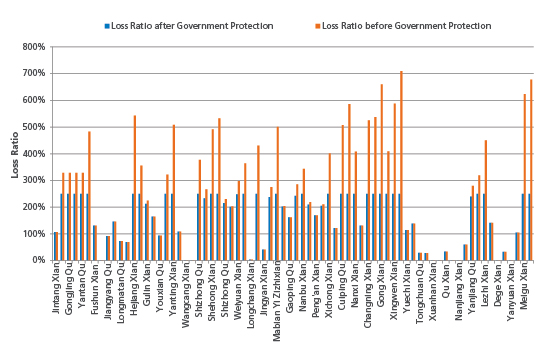
In this scenario, assume that the government refunds 50% of losses for a loss ratio between 200% and 300%. The government also limits total losses to a loss ratio of 300%, and it is assumed that these terms are for province-level losses. Although the county-level loss ratios for this simulated year range up to 700% (Figure 6), due to the high variability of losses within the province, the combined loss ratio for the entire province is only 168%. As a result, under this province-level government protection plan, no insurance companies would receive a payout.
However, if county-level government protection with the same terms was available, the story would be different. Under county-level protection, insurance companies that experienced significant losses in the counties with high loss ratios would indeed receive a recovery payment from the government.
Figure 6 presents the modeled loss ratios for all Sichuan counties, where the loss ratio before government protection is shown in orange and the loss ratio after government protection is shown in blue. Any county with a loss ratio over 200% received some payout due to county-level protection. After the government recoveries are considered, the resulting total loss ratio for Sichuan province is 114%.
Conclusion
Every year, China is plagued by damaging, large-scale weather events such as droughts and floods. These events can damage crops across multiple provinces simultaneously, leaving even companies with diverse portfolios exposed to widespread losses.
It is difficult to account for spatial correlations using purely statistical agricultural models, and the results from those models may underestimate losses significantly. In contrast, AIR's weather-based modeling explicitly accounts for the spatial correlation of both large and small weather events on related crop damages. The AIR high-resolution modeling in China accurately assesses crop risk at the regional province level and the localized county level, catering to the wide variety of insurance needs, such as accurately determining the remaining risk to reinsurers after complex rules relating to government recoveries are considered.
1 Covered areas (with 10% damage ratio or greater) and affected areas (with 30% damage ratio or greater) are combined as suggested in the BNU & PICC National Crop Insurance Regionalization Research Report (2011)
