


30th Anniversary of Typhoon Mireille
Sep 01, 2021
Editor's Note: This AIR Current represents a fresh take on Typhoon Mireille, 10 years after our last comprehensive article about this storm. In the past decade our Typhoon Model for Japan has undergone updates—the latest update was this year—and we have launched our Climate Change Practice, so it is an opportune time to re-examine this record-breaking storm.
The authors would like to gratefully acknowledge the contributions of their colleagues, Sylvie Lorsolo, Ph.D., and Matthew Sienkiewicz to this article.
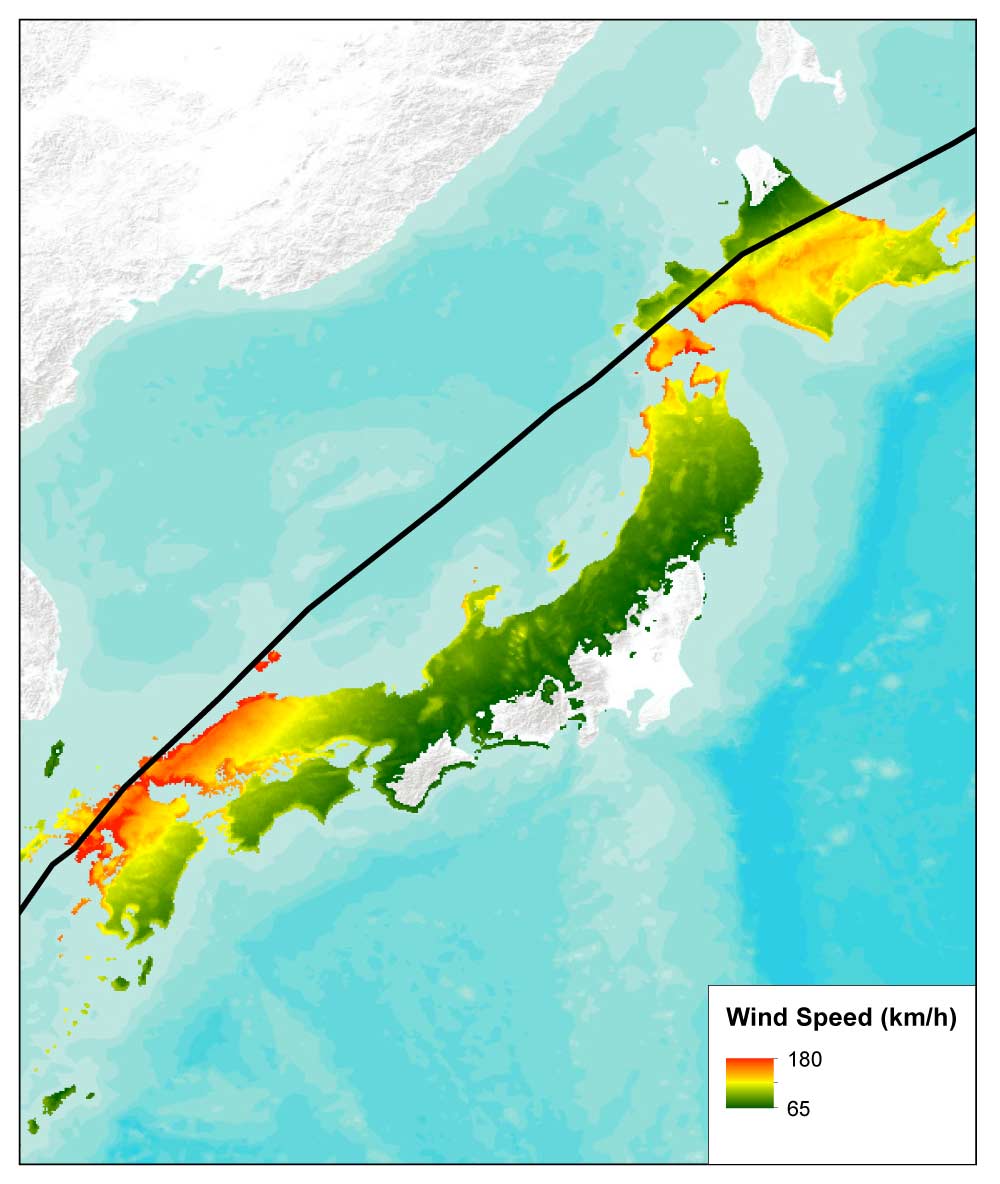
Thirty years ago, in September of 1991, Typhoon Mireille whipped across Japan with winds in excess of 160 km/h (Figure 1). According to the General Insurance Association of Japan (GIAJ), Mireille caused damage in 41 of Japan’s 47 prefectures, destroying more than 170,000 houses, and resulted in total insured losses of JPY 573 billion (in 1991 currency).1 At the time, this was the largest insured loss claim ever paid for a typhoon-related loss in Japan. AIR estimates that if Mireille were to recur today, with today's exposures, it would result in insured losses of JPY 1,046.49 billion (USD 9.81 billion), with the majority of these losses—JPY 967.77 billion (USD 8.92 billion)—caused by wind.
Mireille’s unusually enhanced winds contributed to insured losses so significant they would stand as a GIAJ record for nearly three decades, before being surpassed only recently by Typhoon Jebi in 2018 (JPY 1,067.8 billion) and Typhoon Hagibis in 2019 (JPY 582.6 billion). In the next sections, we consider how a recurrence of Mireille could have far-reaching impacts on Japan's modern exposures and demonstrate how the magnitude of a Mireille, modified by future climate change, might top the charts in another 30 years.
A Usual Track with Unusual Winds
Mireille's left-side track was typical of other typhoons that have caused major damage in Japan, such as Bart in 1999 and Songda in 2004 (Figure 2). When approached from the west side, the island nation is subjected to a typhoon's strongest winds, typically found on the right-front quadrant of a storm. Mireille, however, also developed strong winds behind it and to the left side—where strong winds don't usually form—which contributed to higher losses.
Five days prior to landfall, on September 23, Mireille had just strengthened, with maximum sustained winds of 212 km/h (132 mph), when it interacted with Typhoon Nat in a rare Fujiwara effect, causing Mireille’s forward speed to slow briefly and its direction to shift. Mireille passed 175 km west of Okinawa while producing winds of 90 km/h (56 mph) or greater for 27 hours across that island. At Kadena AB, wind gusts were recorded as high as 147 km/h (91 mph).
Mireille then accelerated northeast and made landfall in Nagasaki Prefecture on September 27 with a central pressure of 940 mb, and an estimated intensity of 176 km/h (109 mph). Mireille produced record wind gusts at 26 locations, with a peak gust of 220 km/h (136 mph). Mireille underwent an extratropical transition as it traversed northeast through the Sea of Japan before making another landfall in Hokkaido.
Influences on Extratropical Transition
Mireille's winds were strengthened asymmetrically as it underwent extratropical transition. Due to unseasonably cold air to the northwest of the storm, a strong upper-level westerly jet streak developed, which drove Mireille's surface winds toward Japan. An area of cold high pressure then moved in from the northwest, and the increasing temperature gradient where it met warm moist air to the southwest further amplified Mireille's west-side winds. Finally, an upper-level cold front developed on the western edge of the typhoon, creating a pressure dip that further enhanced the winds in the storm's left rear quadrant.
The resultant strong westerly winds behind the storm’s center were equally able to wreak havoc on onshore exposures. In fact, nearly two-thirds of the wind-observing stations monitoring Mireille reported the strongest winds coming from the west onto Japan, rather than from the east in the usual right-front quadrant. Extratropical transition also broadened the destructive reach of Mireille's enhanced wind field as the storm moved northeast.
The economic impacts of extratropical transition in Japan can be dramatic, as buildings and other exposures in the middle and high latitudes and well inland may be less prepared for storm-force winds over large areas.
Record-Breaking Damage and Loss: Japan's Costliest Typhoon at the Time
The majority of the damage and destruction was caused by the wide-ranging and enhanced winds, impacting 41 of Japan's 47 prefectures. In addition to the more than 170,000 buildings that were damaged or destroyed, there was extensive damage to the apple crop and trees. The storm's fast forward motion meant precipitation did not have much time to accumulate, but even so, 200 mm (nearly 8 inches) of rain fell across portions of Kyushu and Shikoku islands and as much as 350 mm (nearly 14 inches) of rain fell in Tokushima Prefecture. Storm surges as high as 3 meters inundated the western coasts of the Inland Sea of Japan. Flooding from coastal surge and precipitation inundated nearly 23,000 houses, including parts of Hiroshima City.2 Nearly 6 million people lost power, with electric company officials at the time calling it the nation’s worst typhoon-related blackout on record.3 More than 50 people were killed, and 700 more were injured. Air, road, rail, and ferry transportation was hampered for days. More than 900 ships were damaged.4 JPY 18.5 billion in claims were paid in marine lines and JPY 26.9 billon in automotive, according to GIAJ.
What if Mireille Were to Recur Today?
If Typhoon Mireille were to recur today, we would still expect the majority of the damage and destruction—over 90%—to be caused by winds. Precipitation-induced flooding and storm surge would incur around 8% of the total insured property loss, when taking into account modern flood mitigation measures. Based on our estimation, Mireille would cause in total JPY 1,046.49 billion (USD 9.82 billion) in insured property loss across residential, commercial/industrial, auto, and mutual lines of business, placing it on par with Jebi's losses in 2018. Insured commercial/industrial losses alone would reach JPY 432.88 billion (USD 4.06 billion). Areas hardest hit by wind damage would include ports and industrial parks in Kyushu, such as port Kitakyushu and automotive manufacturing facilities, which have expanded substantially since the early 1990s.5
Capturing Japan's Exposures Today
Japan's modern building codes are stringent and reflect the country's exposure to wind and flood from typhoons and other storms, as well as to earthquake hazards. Modern wood-frame houses, or zairai, typically exhibit good lateral resistance to wind loads, making them less subject to collapse, but even minor wind damage to roof coverings and windows can allow wind-driven rain to enter a building's interior, where the water can damage contents. Larger multi-family apartment buildings and major commercial and industrial structures in Japan are generally engineered and made of reinforced concrete or steel—wind damage to these structures is usually confined to nonstructural components such as mechanical equipment or roofing. Such structures may also be more resilient to flooding due to the inclusion of flood mitigation features. A significant portion of Japan's industrial stock today is non-engineered light metal construction, which is particularly vulnerable to wind damage from a storm like Mireille.
 Peter Sousounis, Ph.D.
Vice President and Director of Climate Change Research
 Ruilong Li, ASA
Senior Manager, Principal Engineer
Edited by Heidi Carrell, CEEM
Climate Change–Enhanced Mireille Wind Scenarios
When Mireille occurred in 1991, global temperatures were almost 1 degree Celsius lower than they are today, and given the expected continued—and accelerating—increase in temperature due to greenhouse gas accumulations, a relevant question to ask is: What might Mireille look like in another 30 years?
One exercise that would allow us to quickly estimate the future effects of climate change on Mireille's winds is to create a small sample set by using some assumptions similar to those in the Miami Hurricane Event Set (MHES), released by AIR earlier this year. The base storm in MHES was a slightly modified version of Hurricane Andrew, which struck Florida in 1992, conveniently around the same time frame as Mireille. This similarity allows us to use similar percent changes when accounting for temperature increases 30 years from now and for the expected impact on tropical cyclone intensity of a future recurrence of Mireille. By 2050, global temperatures are expected to be nearly 2 degrees Celsius higher than they were late last century, under the RCP 8.5 scenario set out by the IPCC (in the MHES, we considered both RCP 4.5 and 8.5). Each additional degree Celsius is expected to increase storm intensity by about 5% (Jisan 2018), so by 2050, a recurrence of Mireille would mean Japan would receive 110% of the original winds.
Intensity is not the only way climate change could affect typhoon impacts: The reduction in the pole-to-equator temperature gradient from heat-trapping greenhouse gases is effectively reducing the intensity of the jet stream and slowing the westerlies that would typically move typhoons across Japan. Studies have shown that recent tropical cyclones worldwide have slowed their forward speed by as much as 25% post-landfall, subjecting exposures to a longer duration of damaging winds. This slowing effect is supported by a recent analysis conducted at AIR as part of our assessment of climate change impacts on Japan typhoon activity, and it will continue to impact steering winds in the future.6
To examine these potential effects, we developed a sample set consisting of three climate-conditioned scenarios of Mireille corresponding to an RCP 8.5 scenario in 2050: a more intense version (decreasing the central pressure uniformly by 11 mb); a slower storm (decreasing the forward speed by 15%); and one both slower and more intense. The versions with increased intensity were therefore projected to make landfall in Nagasaki Prefecture at 929 mb instead of 940 mb, with winds of 145 km/h instead of 133 km/h, while the slower versions would be moving at 42 km/h instead of 50 km/h at landfall. The moderate 15% calculated slowdown is due to the mostly over water track of Mireille's center as it affected Japan, with minimal obstacles to its forward motion.
| Event Versions | Return Periods | Wind-Only Losses, All Lines of Business, Current Exposures | |
|---|---|---|---|
| JPY Billions | USD Billions | ||
| 1991 Mireille Recurrence Today | 21 | 967.77 | 8.92 |
| Mireille 2050: More Intense | 93 | 2,108.53. | 19.43 |
| Mireille 2050: Slower | 27 | 1,105.38 | 10.19 |
| Mireille 2050: Slower and More Intense | 122 | 2,381.36 | 21.94 |
Looking at the wind loss impacts from the climate change perturbations of Mireille detailed in Table 1, we see that Mireille in 2050 would yield nearly two-and-a-half times the wind loss when compared to the original 1991 version. The return period of those climate-impacted versions would shift upward significantly, relative to today’s climate, moving from a ~20-year recurrence to the equivalent of a 120-year return period storm in the current AIR Japan typhoon model.
These significant loss increases were calculated using today's exposures, without accounting for future changes in exposure or inflation that could lead to higher loss numbers in 2050. It is also worth repeating that this is a simplified subset of future loss impacts: It does not consider the potential impacts of global warming on Mireille's other perils—including increases in precipitation-induced flooding from storms staying in place longer and potentially holding more water, and coastal flooding boosted by an expected additional 1 foot of sea level rise by 2050, which could amplify flood loss by several times, as shown in our MHES.
Managing Japan Typhoon Risk Today and Tomorrow
We have seen how Mireille's uniquely enhanced winds helped make it a chart topper in terms of loss for well over two decades, and a repeat performance against modern exposures even today would move it back up the charts to near Jebi's level. A careful analysis of the potential recurrence now or in the future of a storm like Mireille to probe a portfolio's strengths and weaknesses is part of a responsible risk management practice.
The Northwest Pacific Basin produces more tropical cyclones than anywhere else in the world, and there is the potential for considerably higher losses than Mireille or Jebi, such as if Ida (1958) or Vera (1959) were to recur. The AIR model incorporates lessons learned from the 2018-19 seasons to provide the most up-to-date and comprehensive understanding of the risk, including peril-specific damage functions and vulnerability assessments.
Current climate change trends are not slowing down, and to address this we continue to develop our new framework for modeling weather and climate extremes. AIR's global climate modeling studies can help provide the best estimates of future impacts on tropical cyclone activity.
References
1 10 Largest Claims Paid for Typhoons and Windstorms in Japan, GIAJ (as of March 2021)
2 High Tide Disaster in the Ohtagawa River Delta in Hiroshima, Universidad Nacional Autónoma de Honduras, 1996
3 "Killer Typhoon Pounds Japan; at Least 45 Die", Associated Press, 1991 (archive at Los Angeles Times)
4 Digital Typhoon: Typhoon 199119 (MIREILLE)-Disaster Information, National Institute of Informatics
5 Ports, regions and manufacturing systems: Automobile manufacturing in Kyushu, Japan. Case Studies on Transport Policy, Elsevier, 2017
6 "Accounting for Climate Change" chapter, model description document for the AIR Typhoon Model for Japan (client login required)
