
Current Crop Risk in India: How Can It Be Managed Effectively?
Nov 13, 2019
Despite the long history of extensive agriculture in India, multiple peril crop insurance (MPCI) has only recently become widely available. The first crop insurance scheme was introduced in India less than 50 years ago, and the scope of that scheme was extremely limited. Several crop insurance schemes have been introduced since, often replacing the pre-existing scheme although sometimes running concurrently, and often resulting in high losses. Figure 1 illustrates the growth of premiums and annual variation in claims for India’s three national MPCI schemes in operation since 2000: the National Agricultural Insurance Scheme (NAIS, 2000–2015); the Modified National Agricultural Insurance Scheme (MNAIS, 2010–2015); and the Pradhan Mantri Fasal Bima Yojana (PMFBY, 2016–present). Only the most recent scheme has resulted in more premiums than claims.
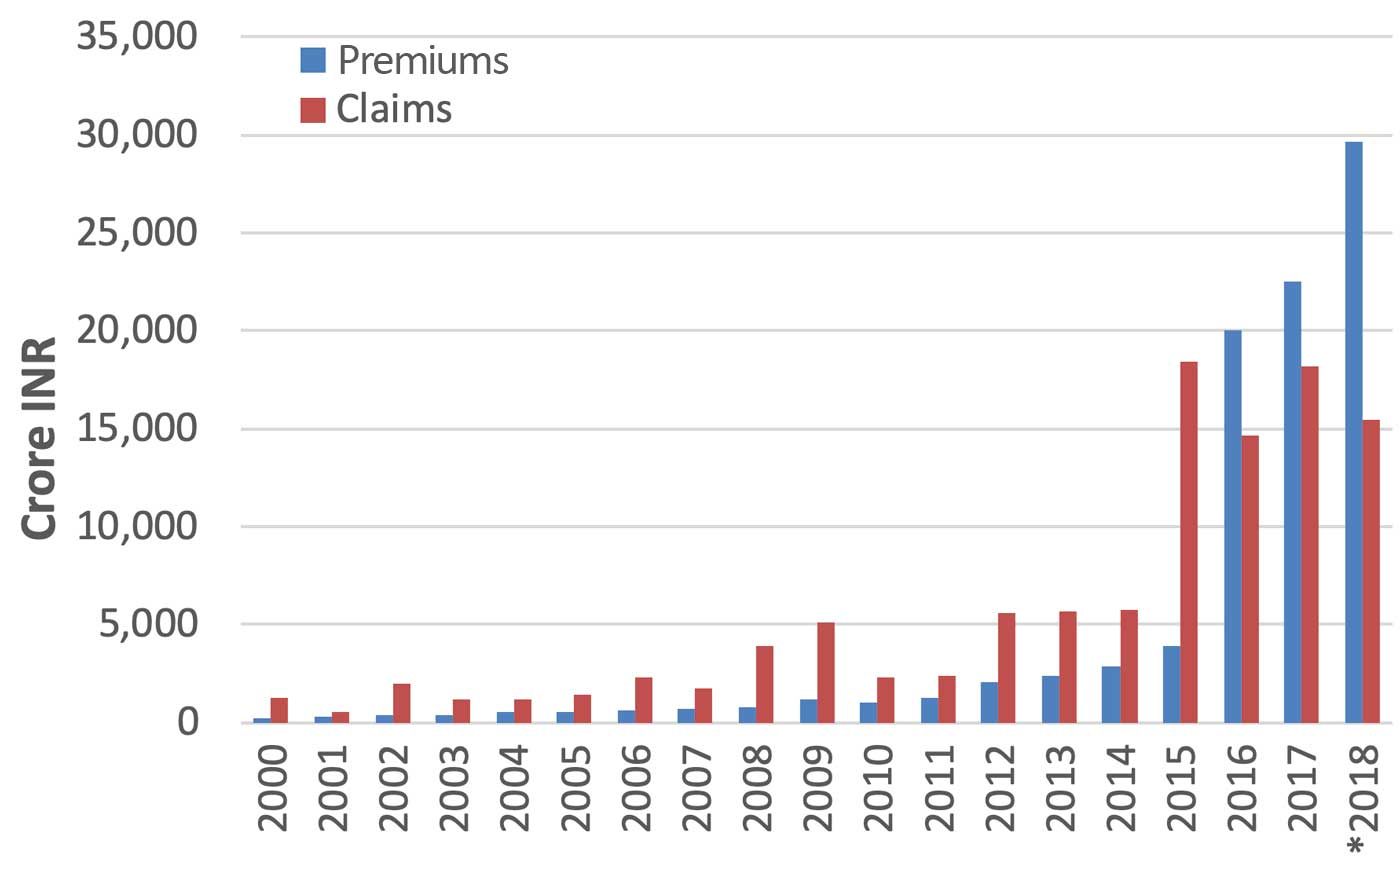
*2018 values are preliminary.
Understanding Crop Risk Management in India: A Look at Previous Insurance Schemes
Complex conditions pose challenges to understanding current crop risk in India, including a broad range of crops, multiple seasons, and diverse crop names. Understanding India’s current crop insurance schemes and how they account for the various factors that contribute to the complexity of the risk is key to effective crop risk management. Frequent changes in India’s crop insurance schemes have contributed to the difficulty in understanding and managing this risk. The next sections discuss past significant crop insurance schemes in India and lessons learned from their implementation.
An Experiment in Crop Insurance: India’s First Crop Insurance Scheme
The first crop insurance scheme in India was initiated in 1972 and offered by the General Insurance Corporation of India (GIC). This scheme covered only H-4 cotton in Gujarat—the world’s first commercial cotton hybrid—against yield shortfall relative to a yield guarantee using an individual approach, i.e., losses were assessed for individual farms. Initially insuring just 250 cotton growers, the scheme was expanded over the next seven years to cover peanut (groundnut), wheat, and potato, and was offered in parts of Andhra Pradesh, Karnataka, Madhya Pradesh, Maharashtra, Tamil Nadu, and West Bengal. Despite this expansion to other crops and states, it insured only about 3,100 farmers—a small fraction of India’s total—from 1972 to 1979. This scheme was financially unsuccessful, with a cumulative loss ratio of more than 800%; cumulative claims of INR 3.8 million were paid compared to cumulative premiums collection of only INR 0.45 million.
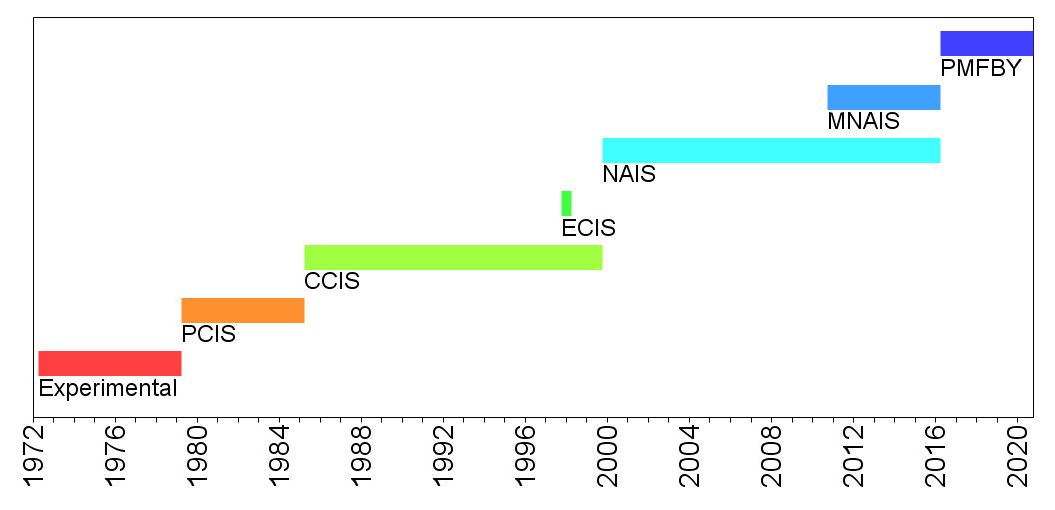
This original scheme was the first—and last—significant attempt to insure crops at the individual farm scale in India due to several factors, including the more than 100 million farms in India with an average size of a hectare (100 × 100 meters), the diversity of crops, the planting and harvesting of fields more than once each year (i.e., multiple cropping), the poor records of yield histories, and numerous operational and infrastructural constraints. A progression of Indian crop insurance schemes followed as the country put forth efforts to improve its program (Figure 2).
A Voluntary Area Approach Plan: Pilot Crop Insurance Scheme (PCIS)
The loss-laden first scheme was replaced with the Pilot Crop Insurance Scheme (PCIS) by GIC in 1979, which was only available to loanee farmers, i.e., farmers with loans from financial institutions, on a voluntary basis. PCIS used an area approach that defined areas as districts or sub-districts composed of 30–40 villages, in which a single average yield during the insured period and a single threshold yield (i.e., a yield guarantee or payment trigger) were applied to all farmers growing the same crop within the area. Threshold yields were based on area-averaged yield histories. Yield during an insured season was assessed with 16 to 20 end-of-season crop-cutting experiments (CCEs), which used a randomized sampling strategy to measure average yield across the area.
PCIS covered yield shortfall (threshold minus actual) caused by all risks in cereal, millet, oilseed, cotton, potato, and chickpea. Initially implemented in three states, PCIS was available to farmers in 12 states by its final year of 1984-85 (India encompassed 22 states and six union territories in 1984). About 100,000 farmers were covered each year, with the number approaching 450,000 in the final year, or less than 0.5% of India’s farmers.
State governments shared risk—premium collected and claims paid—with GIC in a 1:2 ratio. The maximum sum insured (SI) was initially set to 100% of the loan amount (later increased to 150%) with premiums ranging from 5% to 10% of SI. Premiums charged to small farmers were subsidized by 50% by state and central governments (1:1).
The highest loss cost during PCIS history was 8%, experienced in 1982-83. Reports of cumulative loss ratio over the scheme’s lifetime of 1979 to 1984-85 ranged from 80% to 110%.
A Compulsory Scheme for Loanee Farmers: Comprehensive Crop Insurance Scheme (CCIS)
The Comprehensive Crop Insurance Scheme (CCIS), operated by GIC, was implemented by the central government in 1985 and continued through 1999. The scheme covered cereal, pulse, and oilseed crops, but not other key crops such as cotton. Like PCIS, the scheme was limited to farmers with loans from financial institutions; contrary to PCIS, however, it was compulsory for farmers growing food and oilseed crops. CCIS also used an area approach with defined areas of districts, talukas, blocks, and other small contiguous areas. It was adopted by 15 or 16 states and two union territories, depending on the source.
Premiums for CCIS were uniformly low at 2% for cereal and millet and 1% for pulse and oilseed in all regions, with a government-paid 50% subsidy for small farmers. Yield coverage, or indemnity levels, were originally 80%, but later expanded to 60%, 80%, and 90% corresponding to what were judged to be high-, medium-, and low-risk areas, respectively. Threshold yields were the product of indemnity level and average yield in the defined area during the previous five years; yields were assessed with CCEs.
According to empirical data from Gujarat, CCIS had the positive effect of increasing the flow of credit to insured farmers, including an increased number of borrowers, credit per borrower, and credit per hectare of insured crops. The repayment of loans also increased.
The cumulative (1985–1999) scheme loss ratio was 572% (loss cost 9.3%), with 58% of claims paid in Gujarat corresponding to a state-wide loss ratio of more than 2,000%. Peanut and oilseed crop cumulative loss costs were 16% and 13.9%, respectively, while cumulative loss costs for rice and wheat were 6.2% and 3.4%, respectively. About 75% of claims were due to drought and 20% due to cyclones and floods.
A Short-Run Trial: Experimental Crop Insurance Scheme (ECIS)
The Experimental Crop Insurance Scheme (ECIS) was implemented in 1997-98 in 14 districts across Andhra Pradesh, Assam, Karnataka, Odisha, and Tamil Nadu. Originally, ECIS was to be implemented in one district of each state only for small farmers, including those not obtaining loans from institutional sources (non-loanee farmers) with a 100% premium subsidy. Central and respective state governments shared premium payments and claims at a ratio of 4 to 1.
Fewer than 1% of Indian farmers participated in ECIS and the scheme failed financially, with a loss ratio during its first—and only—season of nearly 1,400%.
Crop Insurance for the New Millennium: National Agricultural Insurance Scheme (NAIS)
The National Agricultural Insurance Scheme (NAIS) replaced CCIS in 1999-2000 and was compulsory for loanee farmers and optional for others. It used an area approach for widespread catastrophes and an individual approach for localized catastrophes. The scheme covered the major food and oilseed crops as well as horticultural crops, which comprised cotton, sugarcane, potato, ginger, onion, turmeric, chili, cumin, jute, banana, tapioca, coriander, and pineapple. NAIS was implemented initially in nine states and union territories, then expanded to 28 states and union territories over its nearly 17 years in force. In 2002, the administration of NAIS was transferred from GIC to Agricultural Insurance Company of India Limited (AIC).
Threshold yields were established as the level of indemnity multiplied by the average yield in a notified area during either the previous three years for rice (paddy) and wheat or five years for other crops. Levels of indemnity for different crops in different locations were set by the states at 60%, 80%, or 90%. The indemnity level was inversely related to coefficients of variation of yields during the previous 10 years.
For loanee farmers, SI was at least the crop loan amount with an option to increase coverage up to 150% of the value of the average yield in the notified area. For non-loanee farmers, optional coverage up to 150% of the value of the average yield was also available. Premium subsidies of 50% were initially available to small farmers, but no subsidy was allowed for SI greater than 100% of the value of the average yield. The subsidies were later phased out.
NAIS premium rates for farmers insuring food and oilseed crops were modest. During kharif season (roughly July to October), premium was 3.5% of SI for oilseed and bajra (pearl millet) and 2.5% for cereal, millet, and pulse. During rabi season (roughly October to March), premium was 1.5% for wheat and 2% for oilseed and other food crops. Premium rates for horticultural crops were based on actuarial calculations. AIC was obligated to meet claims up to 100% of premium amount for food and oilseed crops and up to 150% of premium for horticultural crops, with any excess claim amounts paid by the government or a government-funded corpus fund. Cumulative NAIS loss ratio was 416% for kharif seasons, 323% for rabi seasons, and 391% overall.
Modified National Agriculture Insurance Scheme (MNAIS)
As the name implies, the Modified National Agriculture Insurance Scheme (MNAIS) involved modifications to NAIS. It was implemented in place of NAIS on a pilot basis in 50 districts during rabi 2010-11. Notable changes included:
- Using indemnity levels of only 80% or 90%
- Reducing the size of notified areas for major crops to village level
- Using seven years of yield history for threshold yield calculations and allowing exclusion of up to two calamity years from those seven
- Setting SI equal to threshold yield times the minimum support price (MSP)
- Determining premium rates actuarially, with rate caps
- Subsidizing premium payments (equally from state and central governments) to limit farmer rates
- Adding coverage for prevented planting and some post-harvest losses for crops drying in the field following harvest
- Allowing participation by private sector insurers
- Specifying that reinsurance was to be obtained
MNAIS was meant to replace NAIS, but several key states objected and NAIS continued in parallel with MNAIS through rabi 2015-16, after which both schemes were terminated. MNAIS’s cumulative loss ratio (rabi 2010-11 to rabi 2015-16) was 119%; although unprofitable, that was a vast improvement relative to the NAIS loss ratio of 400% during that same period.
Today’s National MPCI Scheme: Pradhan Mantri Fasal Bima Yojana (PMFBY)
Initiated during kharif 2016, Pradhan Mantri Fasal Bima Yojana (PMFBY) is now India’s main crop insurance scheme, insuring more than 30 million farmers during kharif season and more than 15 million during rabi season. It resembles the MNAIS in many ways. It is compulsory for loanee farmers and optional for others, and covers five risks:
- Prevented sowing/planting (area approach)
- Standing crop (sowing to harvest) yield loss (area approach)
- Post-harvest loss for up to two weeks following harvest (individual approach)
- Localized calamities (individual approach)
- Crop loss due to attack by wild animals (area approach; optional; added in 2018)
Its key features include:
- Notified areas are (mostly) at village level
- CCEs determine notified area yields
- Many kharif and rabi crops are insured
- Indemnity levels are 70%, 80%, and 90% (inversely related to historical crop yield variance)
- Threshold yield is the average of the five best yields during the last seven years multiplied by indemnity level
- SI/hectare is equal to scale of finance (i.e., cost to produce one hectare of a crop)
- Actuarial premium rates are used
- Premium is heavily subsidized by state and central governments (about 82% of gross premium was subsidized during its first two years)
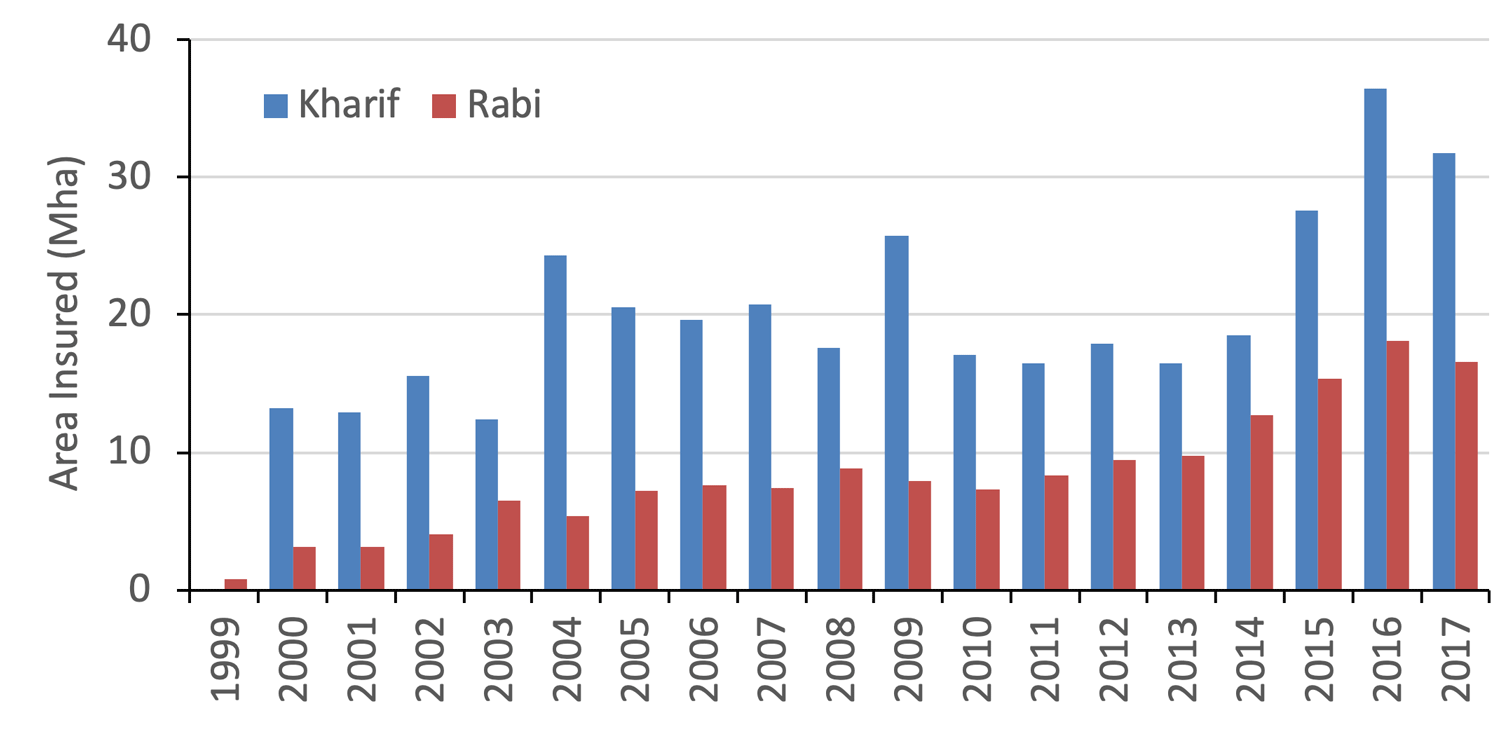
Participation in PMFBY exceeds that of previous MPCI schemes, with modest increases in area of crop insured since 2015. Still, not all states participate. Bihar left PMFBY after 2017, and the important crop-producing state Punjab has avoided all of India’s MPCI schemes, including PMFBY. Even after the launch of PMFBY, insured cropland across India still comprises only about 27% of the country’s some 180 million hectares (Mha) of net cropland, leaving much room for growth (Figure 3).
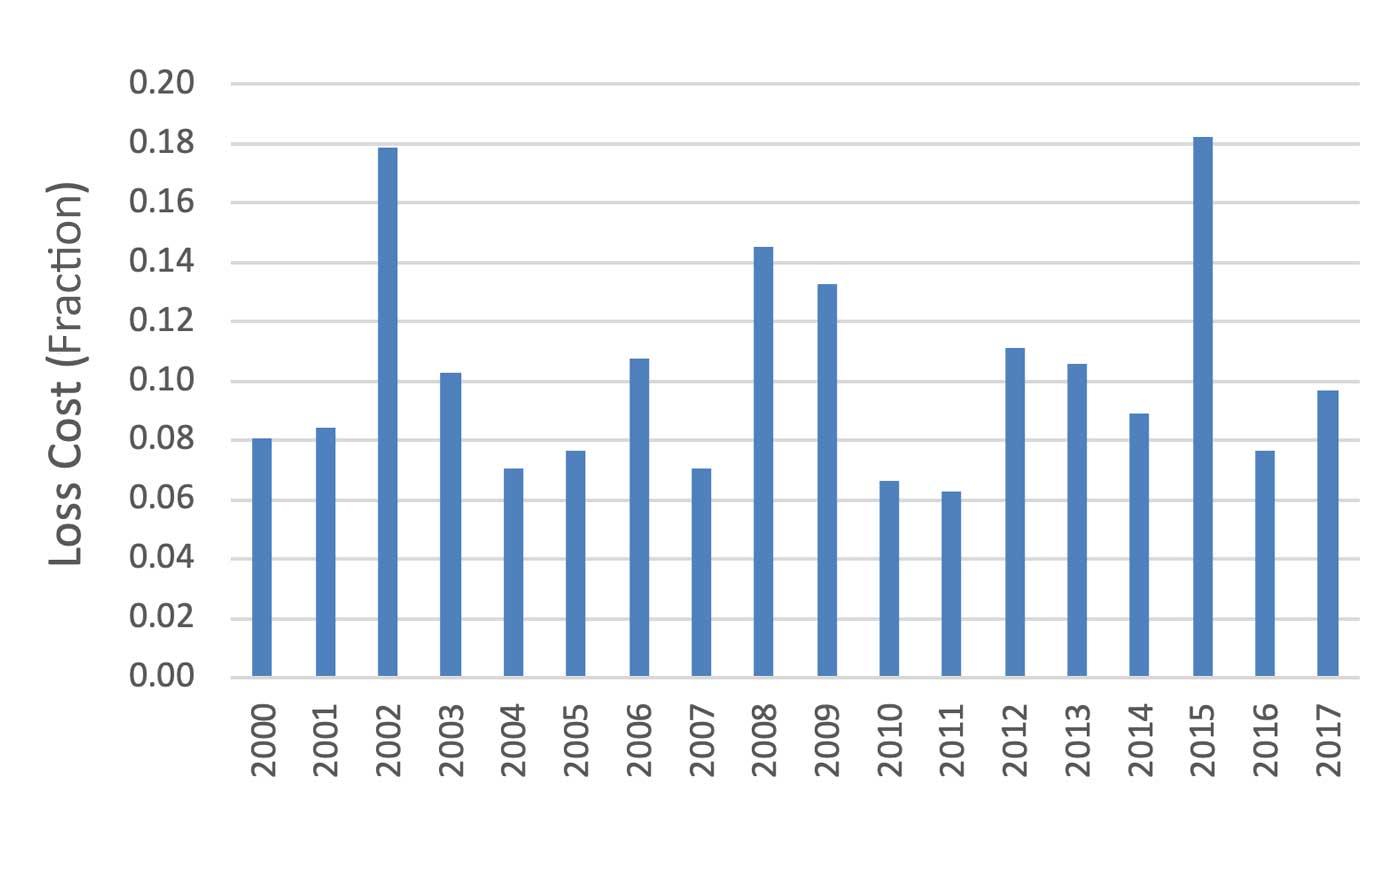
Financial performance has so far been good under PMFBY. Aggregated kharif and rabi loss ratios were 73% and 81%, respectively, during the scheme’s first two years of operation, and preliminary data for the third year indicates another good year. This improvement in the financial performance of India’s MPCI program with the introduction of PMFBY is largely due to better premium pricing (Figure 1). Annual loss costs for PMFBY during 2016 and 2017 were consistent with those for NAIS and MNAIS during 2000–2015 (Figure 4). It is critical to bear in mind that SI/hectare and threshold yield were calculated in different ways in the three programs, and that threshold yield calculation even changed during PMFBY’s fourth year, so comparisons of losses between schemes should be made with caution.
Managing Crop Risk in India
Gauging crop risk in India is challenging because risks for different locations, crops, and crop seasons depend on many variables, some correlated and some uncorrelated. Limited PMFBY experience (loss history) also contributes to uncertainty about present risk. Probabilistic modeling is the best approach to overcome this uncertainty and account for the complex mixture of factors associated with risk to PMFBY-insured crops and associated (re)insurance losses.
The AIR MPCI Model for India, released in September 2019, uses a probabilistic approach to capture the full breadth of crop-loss risk related to present PMFBY insurable exposure and policy conditions. The model’s 10,000-year stochastic catalog maintains the correlations between crops, locations, and seasons that impact performance to provide a robust view of present risk to crop insurance portfolios.
While a comparison of model recasts using current exposure and policy conditions with historical loss results brings with it considerable uncertainty, model recasts of national kharif loss cost compare well to historical results from India’s MPCI schemes over the 2000–2017 period (Figure 5). It is important to bear in mind that PMFBY is only in its fourth year and, although NAIS and MNAIS were similar to PMFBY, changes to crop genetics and farming methods (technology trends), crop mix (newly insured crops in new locations), and insured crop area (farmers’ participation) preclude a strict “apples-to-apples” comparison.
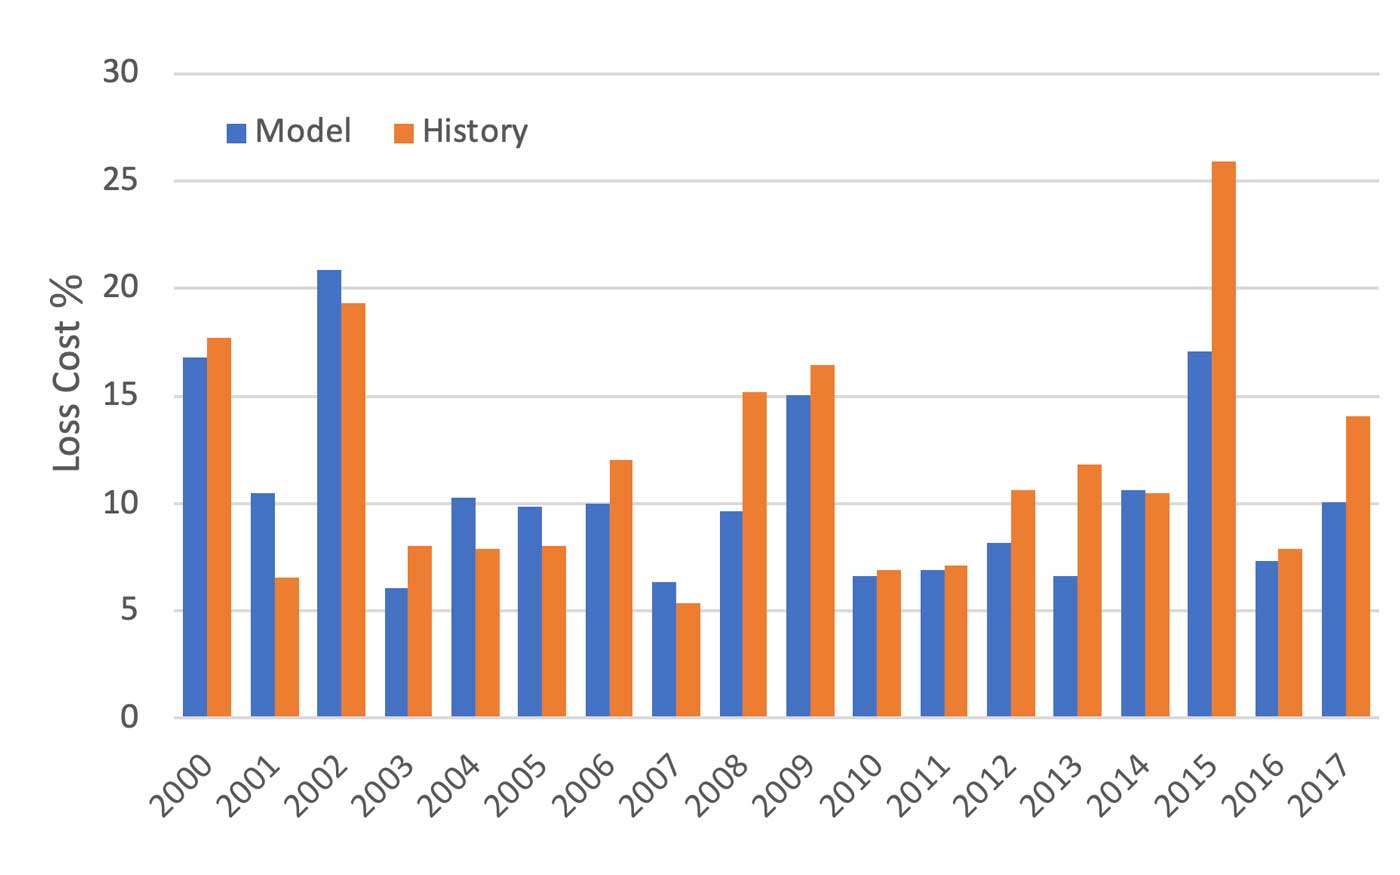
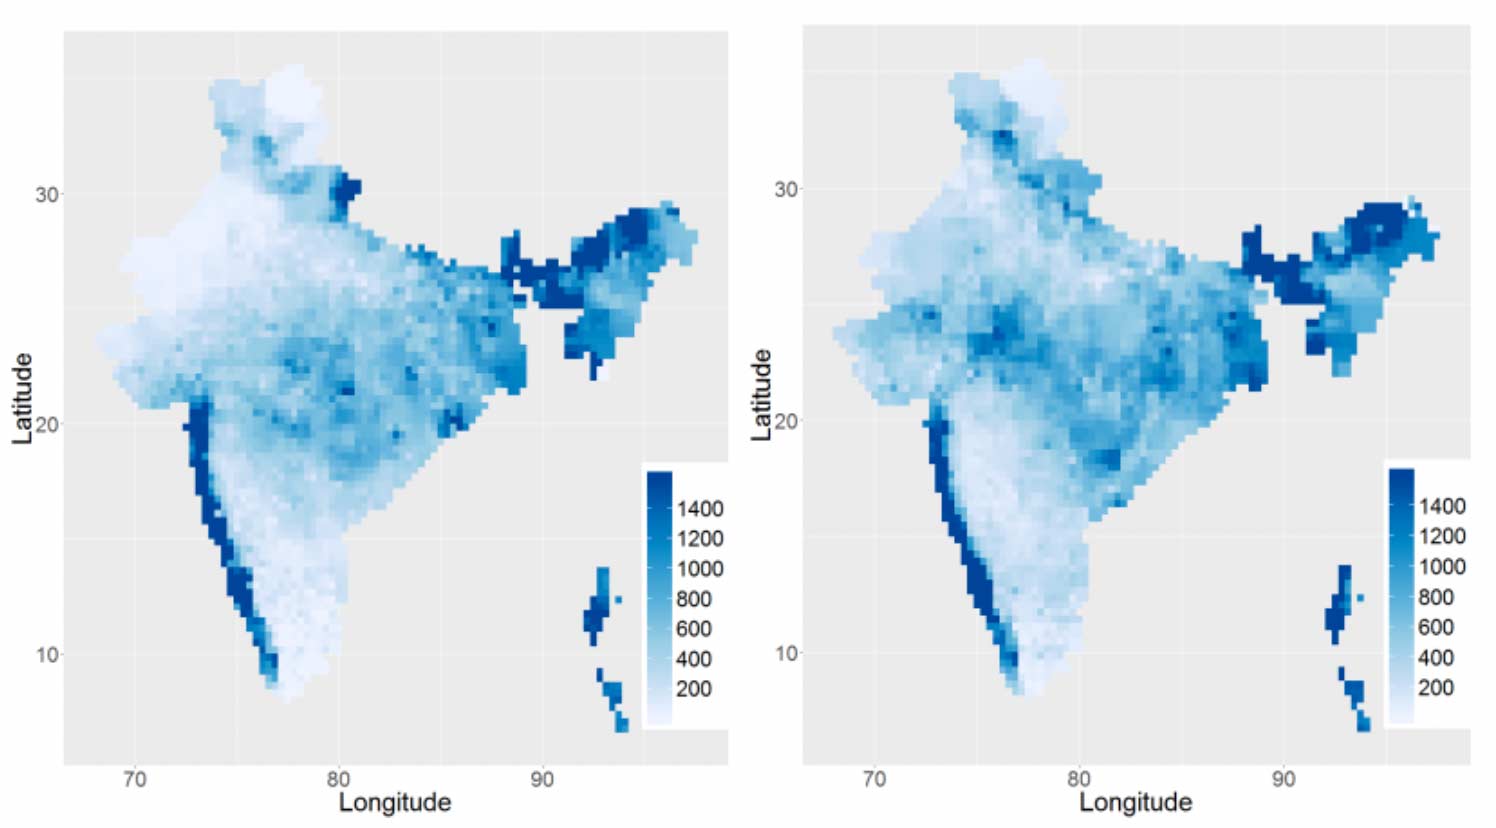
Based on the combined time series for NAIS, MNAIS, and PMFBY, India’s crop insurance industry experienced its highest kharif season loss cost during the 2000–2017 period in 2015, followed by 2002. The AIR MPCI Model for India recast of the period 2000–2017 indicates that with current exposure and policy conditions, 2002 would result in a larger loss than 2015. Summer monsoon rainfall was low in both 2002 and 2015, with national rainfall deficits of 21% and 14%, respectively. During the all-India kharif 2002 drought—one of the worst in history—rainfall deficits exceeded those of 2015 in several states that are large crop producers, including Uttar Pradesh, Rajasthan, Madhya Pradesh, Gujarat, and Haryana (Figure 6). Yield histories corroborate the magnitude of crop stress in 2002 for key crops in many major producing states, with some of them experiencing the largest percentage yield decline on record. The fact that the historical 2015 loss cost exceeded that in 2002 is possibly due to differences in insured exposure and policy conditions between the years. That is, for current PMFBY insurable exposure and policy conditions the model indicates that a recurrence of the 2002 drought would cause greater loss than a recurrence of the 2015 drought. In any case, it is necessary to consider changes in exposure and policy conditions if one is linking historical loss to current risk.
Preparing for large losses before they occur by using model scenarios to probe a portfolio’s strengths and weaknesses is critical to continued solvency and resilience. The years 2002 and 2015 are not extreme tail events; far greater losses are possible.
No model can predict when the next severe drought, flood, or other crop-damaging event will occur. This fundamental uncertainty makes it even more important for companies to use probabilistic catastrophe models to prepare for such losses. The best risk management is based on an understanding of the probable range and frequency of future losses. Using probabilistic models to assess risks to crop insurance portfolios, including tail risk, helps (re)insurers effectively prepare for inevitable future small and large swings in losses to be experienced by India’s crops across good years and bad. The careful analysis of model results can help risk managers prepare for many contingencies—thus ensuring that another year like 2002 or 2015, for example, will not be entirely unexpected.
Ultimately, catastrophe models, such as the AIR India MPCI model, help organizations evaluate the full range of potential events so that they can manage the risk effectively.
Resources
IC (Agriculture Insurance Company of India Limited). (n.d.) Crop Insurance in India. [accessed September 2019].
Department of Agriculture, Cooperation and Farmers Welfare. (2018). Operational Guidelines: Pradhan Mantri Fasal Bima Yojana (PMFBY) (revised). Ministry of Agriculture & Famers Welfare, New Delhi, 93 p.
Government of India. (2019). Agricultural Statistics at a Glance 2018. Ministry of Agriculture & Farmers Welfare, Department of Agriculture, Cooperation & Farmers Welfare, Directorate of Economics & Statistics, New Delhi, India, 468 p.
Gulati, A., Terway, P., & Hussain, S. (2018). Crop Insurance in India: Key Issues and Way Forward. Working Paper No. 352, Indian Council for Research on International Economic Relations, 55 p.
Mishra, P.K. (1994). "Crop insurance and crop credit: impact of the Comprehensive Crop Insurance Scheme on cooperative credit in Gujarat." Journal of International Development, 6(5), 529–568.
Mishra, P.K. (Chair). (2014). Report of the Committee to Review the Implementation of Crop Insurance Schemes in India. Department of Agriculture & Cooperation, Ministry of Agriculture, Government of India, New Delhi, 74 p.
Muntaqa, G. (2006). "Crop insurance – an Indian experience." FAIR Review, No. 141 (September 2006), 4-10.
Raju, S.S., & Chand, R. (2008). Agricultural insurance in India: problems and prospects. Working Paper No. 8, National Centre for Agricultural Economics and Policy Research, New Delhi, 60 p.
Singh, A. (2016). "Agriculture insurance in India." Bimaquest, 16(2), 69–95.
The Hindu BusinessLine. (2019). 50 districts out of 600 account for half of all crop-cover claims. [accessed October 2019].
 Kazi Farzan Ahmed, Ph.D.
 Yu Mo, Ph.D.