


Managing U.S. Flood Risk: Part II, The New Pluvial Component
Mar 26, 2020
Editor's Note: AIR Currents is featuring a four-part series on modeling and managing U.S. flood risk. Part I focused on the additional capability of managing hurricane-induced flood risk with the updated AIR Hurricane Model for the United States. This second article discusses the new pluvial component of both the updated U.S. hurricane model and the AIR Inland Flood Model of the United States; Part III will discuss AIR’s enhanced view of flood vulnerability; and in Part IV we will quantify U.S. flood risk from all sources—tropical and non-tropical precipitation and coastal storm surge—for all lines of business as we transition from an insurable ground-up view to an insured gross view of flood risk. The updates discussed in all parts of this four-part series are anticipated for release this summer.
Flood is the most frequent and costliest peril that impacts the United States; according to the National Flood Insurance Program (NFIP), about 20% of flood damage losses come from outside the areas of highest risk demarcated by 100-year flood zones. AIR analysis of recent major floods, including the 2016 Louisiana, 2017 Harvey, and 2018 Florence floods, confirms that a significant portion of losses come from properties located outside the demarcated flood zones. During heavy precipitation, these properties are flooded due to excess runoff, poor drainage conditions, and/or flooding from rivers that are too small to be captured by traditional river modeling approaches—collectively known as pluvial, or off-floodplain, flooding.
The updated AIR Inland Flood Model for the United States incorporates a physically based 2-dimensional (2D) shallow water wave model to simulate pluvial flood risk over the entire contiguous U.S. This computationally intensive modeling approach leverages today's high- capacity graphic processing units (GPUs) systems to achieve comprehensive off-floodplain flood risk coverage. By more accurately modeling all surface water flooding during an event, modeling both the flow from rivers onto land and the flooding over areas away from rivers, AIR’s updated U.S. inland flood model provides a complete view of U.S. inland flood risk, both on and off the floodplains.
How Does the AIR U.S. Inland Flood Model Define Fluvial (On-Floodplain) and Pluvial (Off-Floodplain) Flooding?
In all AIR inland flood models, the definition of fluvial (on-floodplain, riverine) and pluvial (off-floodplain, surface) flooding depends mainly on the source of flooding rather than the location of the flooded property. Fluvial flooding is caused by rivers overflowing their banks and inundating properties on the floodplain, whereas pluvial flooding is caused by intense local precipitation running off impermeable surfaces such as paved streets and sidewalks that overwhelms local drainage systems and overflows small waterways; consequently, this water makes its way into homes and other properties. Because the driving mechanisms and dynamics of the water flow of fluvial and pluvial flooding are different, AIR uses different modeling approaches to simulate these two types of flooding. For pluvial flooding, the intensity at a location is highly dependent on the local terrain, infiltration rate, subterranean drainage capacity, and location of drainage inlets. In situations where both fluvial and pluvial flooding occur simultaneously at any given location, however, an event is designated on-floodplain flooding, by default, owing to the dominant nature of fluvial flooding.
 Abebe Jemberie, Ph.D.
Senior Principal Engineer
 Daniel Rees
Senior Scientist I
 Yilu Feng, ASA
Engineer II
Edited by Heidi Carrell, CEEM
Advantages of AIR’s New Pluvial Modeling Approach
AIR’s physically based 2D approach to modeling pluvial flood risk offers significant benefits, including the following:
Local intensity calculations: Off-floodplain local intensity can be explicitly modeled as flood depths by taking the effect of local terrain into account. This granularity improves the applicability of the model in differentiating location-level risk. It also allows the use of the same set of vulnerability functions for both fluvial and pluvial flooding, thus minimizing any potential discontinuity in location-level exceedance probability (EP) curves. Secondly, having the intensity as a singular depth field makes it possible now to output location-level event intensities (LLEIs) in Touchstone®.
Spatial continuity: Both on- and off-plain flooding are modeled with compatible physically based approaches, producing a more continuous view of spatial flood risk and eliminating potential discontinuities.
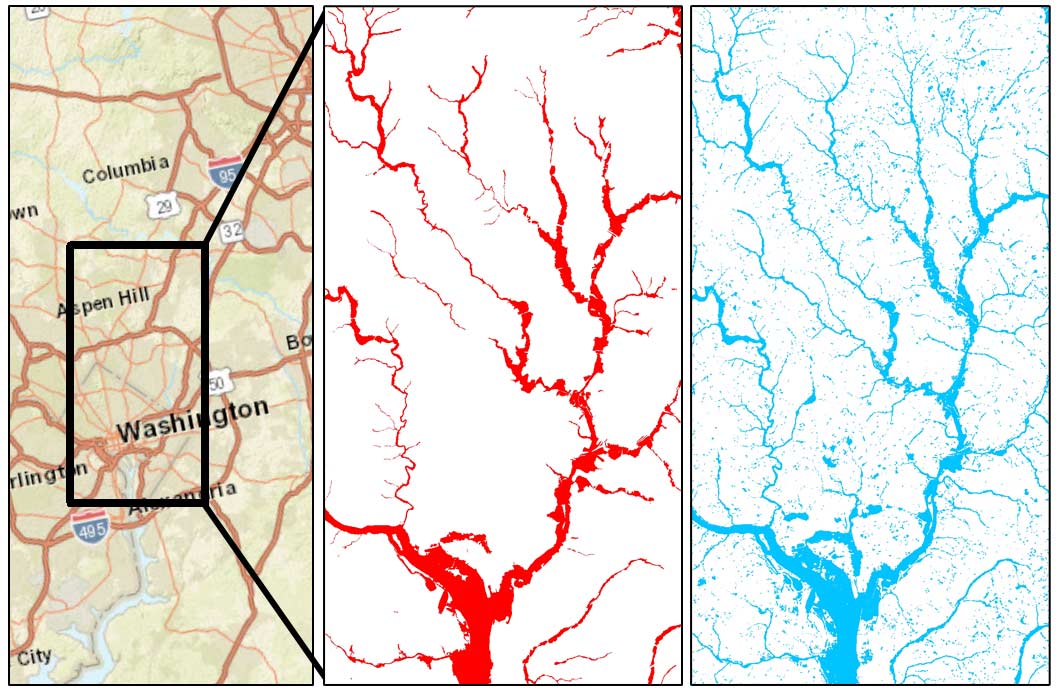
No minimum river network threshold: The updated U.S. inland flood model includes any waterway visible on the terrain, which both extends the fluvial (on-floodplain) modeling approach and integrates it with pluvial (off-floodplain), modeling. Figure 2 shows the details of a segment of a river network near Washington D.C. The middle panel shows FEMA’s 100-year flood map and the rightmost panel shows AIR’s updated 100-year hazard map that combines the on- and off-floodplain risks into a single unified hazard layer at very high resolution, with virtually no minimum threshold imposed on the river network drainage basin area.
Better representation of urban drainage: The model incorporates surface and sub-surface drainage capacity for urban areas at a grid level, which allows the model to make distinctions at this level between well-designed versus poorly designed urban drainage networks or between those with a higher versus a lower return period design standard for areas where this data is available.
Historical Flooding Examples: The Need for Innovation
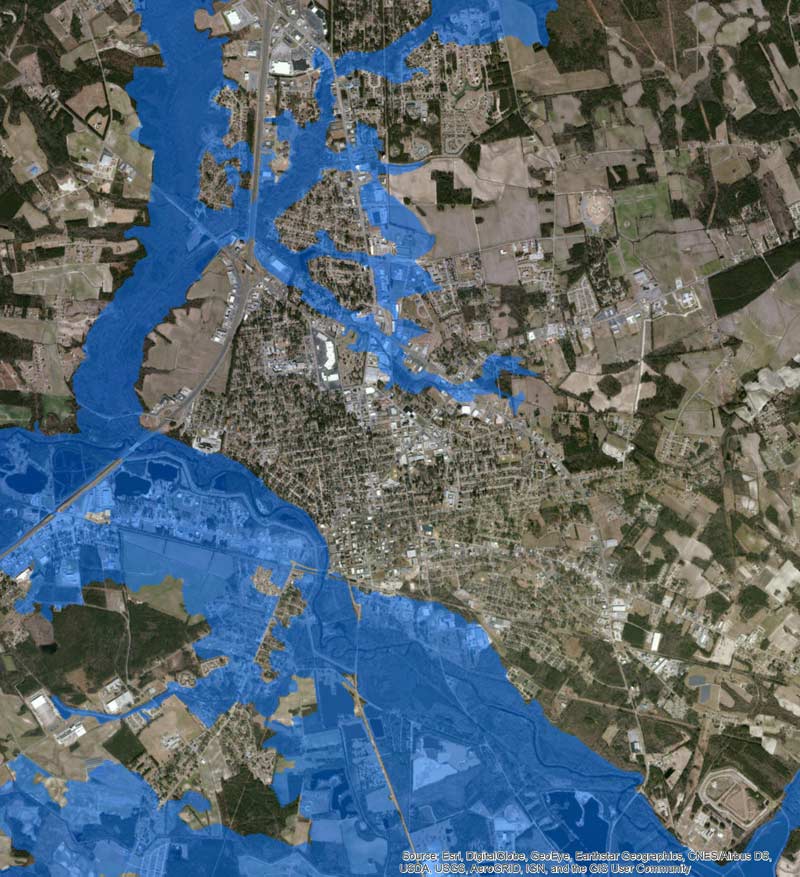
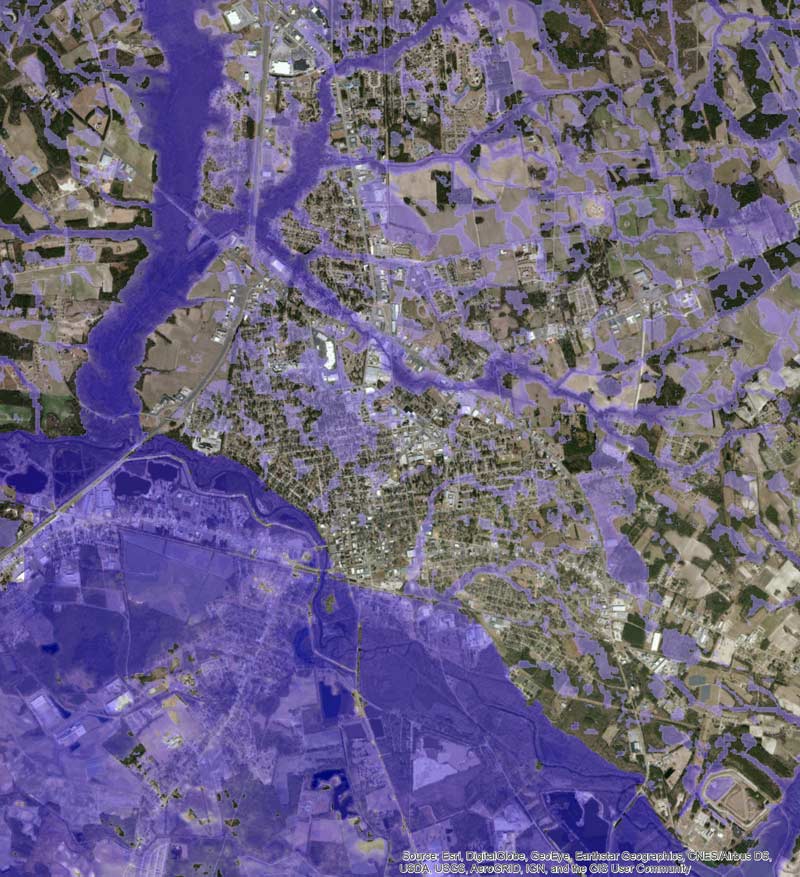
The Union of Concerned Scientists found that more than 50% of the area flooded by rain from Hurricane Florence was outside the NFIP’s 1% and 0.2% annual recurrence flood zones, while state officials in Texas found that almost 75% of residences flooded during Hurricane Harvey were outside of the same zones. The right-hand panel of Figure 3 shows the AIR-modeled flood footprint of Hurricane Florence, revealing that a significant area outside FEMA’s 100-year flood zone was flooded. The large number of claims outside the FEMA floodplain was in part due to both FEMA’s requirement to model the flood extent only up to the 500-year return period of flow and to restrict flood mapping to only major streams and riverine, or on-floodplain, hazard. Only recently has FEMA required the inclusion of ponding, or overland flow, in their products, but this inclusion is limited to just the areas where this phenomenon is known to have occurred previously.
AIR’s pluvial model accurately depicts flood risk from surface flooding such as ponding, overland flow, and channel flow in ephemeral rivers (a river that flows only when there is rain or snowmelt; otherwise it is a dry riverbed) for every 10x10-meter grid in the United States, providing users with spatially discrete estimates of flood risk everywhere within the model domain. This includes areas that have not yet been mapped by FEMA; areas where flood mapping did not originally include smaller streams; and surface flooding due to lack of past observed flooding or insufficient modeling resources. In addition, AIR estimates flood risk up to the 10,000-year precipitation return period, providing accurate and more complete risk quantification for even extreme precipitation events.
Managing Your U.S. Flood Risk with a Comprehensive and Unified View of Precipitation from All Sources
In addition to non-tropical extreme precipitation events, stalling tropical systems have increased in frequency and severity over the past century (Kunkel et al 2003), causing losses like those observed from the 2016 Louisiana flood, or from Hurricanes Harvey and Florence in 2017 and 2018, respectively. Considering the frequency and severity of precipitation-induced floods and the losses they can cause, managing just part of your flood risk is not sufficient. The updated AIR Inland Flood Model for the United States and the updated AIR Hurricane Model for the United States—high-resolution, physically based catastrophe models that simulate both tropical and non-tropical precipitation realistically—together offer the industry a unified and comprehensive view of flood risk from all precipitation events never before available to the industry to help you enhance your risk management and resilience strategies and truly own your U.S. flood risk.
The new pluvial component of the AIR Inland Flood Model provides a major increase in the granularity of modeling intense precipitation events, providing insight into which properties were flooded by ponding, excess flow from ephemeral streams, or from overflowing rivers—three sources of precipitation-driven flooding that are not spatially uniform across a landscape and do not always appear on traditional flood maps.
The extreme precipitation events in the past decade have brought to the forefront the importance of modeling flood risk outside floodplains. With the introduction of the new pluvial model, insurers can understand and manage their risk from all sources of flooding across the contiguous United States with better accuracy.
References
Hurricane stalling along the North American coast and implications for rainfall
Temporal variations of extreme precipitation events in the United States: 1895–2000
Most homes damaged by Harvey were outside flood plain, data show
Fact Sheet: Flood Plain Management, Insurance and Rebuilding
