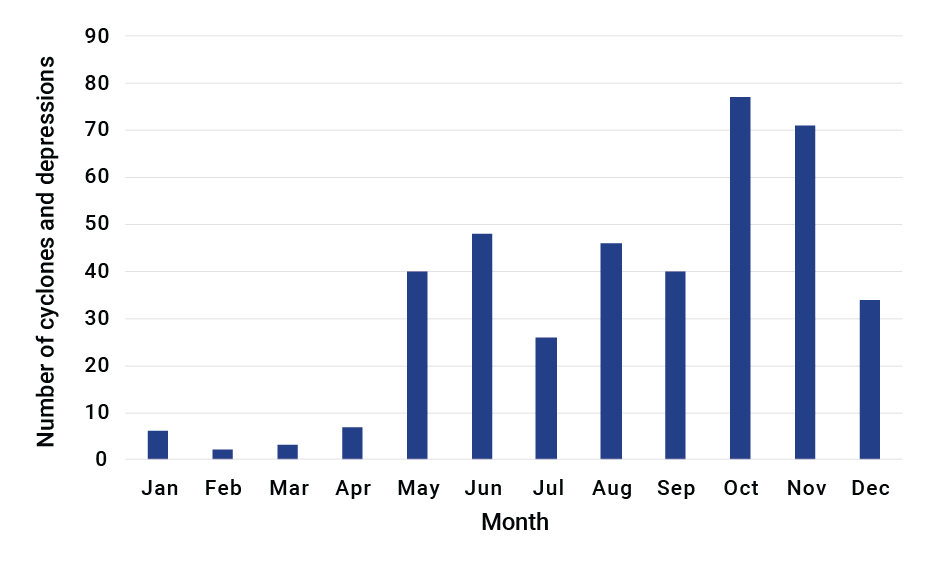
Every year, approximately 90 tropical cyclones form worldwide, and more than half of them generally develop into hurricanes with wind speeds of 110 km/h or higher. The North Indian Ocean basin has two annual tropical cyclone activity peaks, as seen in Figure 1: pre-monsoon (May and June) and post-monsoon (October and November).

Warming Seas
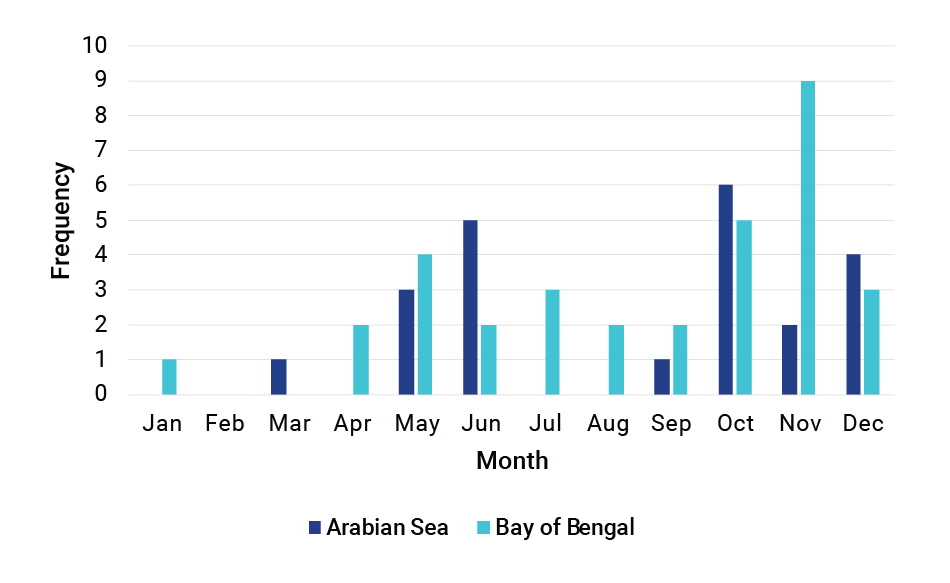
According to the latest IPCC report, the Indian Ocean has warmed faster than the global average. Warm ocean water is the primary fuel source for tropical cyclone development and this warming trend could impact both the frequency and severity of storms striking India. While tropical cyclones take a wide variety of tracks around the subcontinent, they are typically stronger over the Bay of Bengal to its east and four times more likely to form there than they are over the cooler waters of the Arabian Sea to its west (Figure 2). In the last few years, however, cyclonic activity (including depressions) off India’s west coast has been increasing (Xiao-ting et al. 2020).

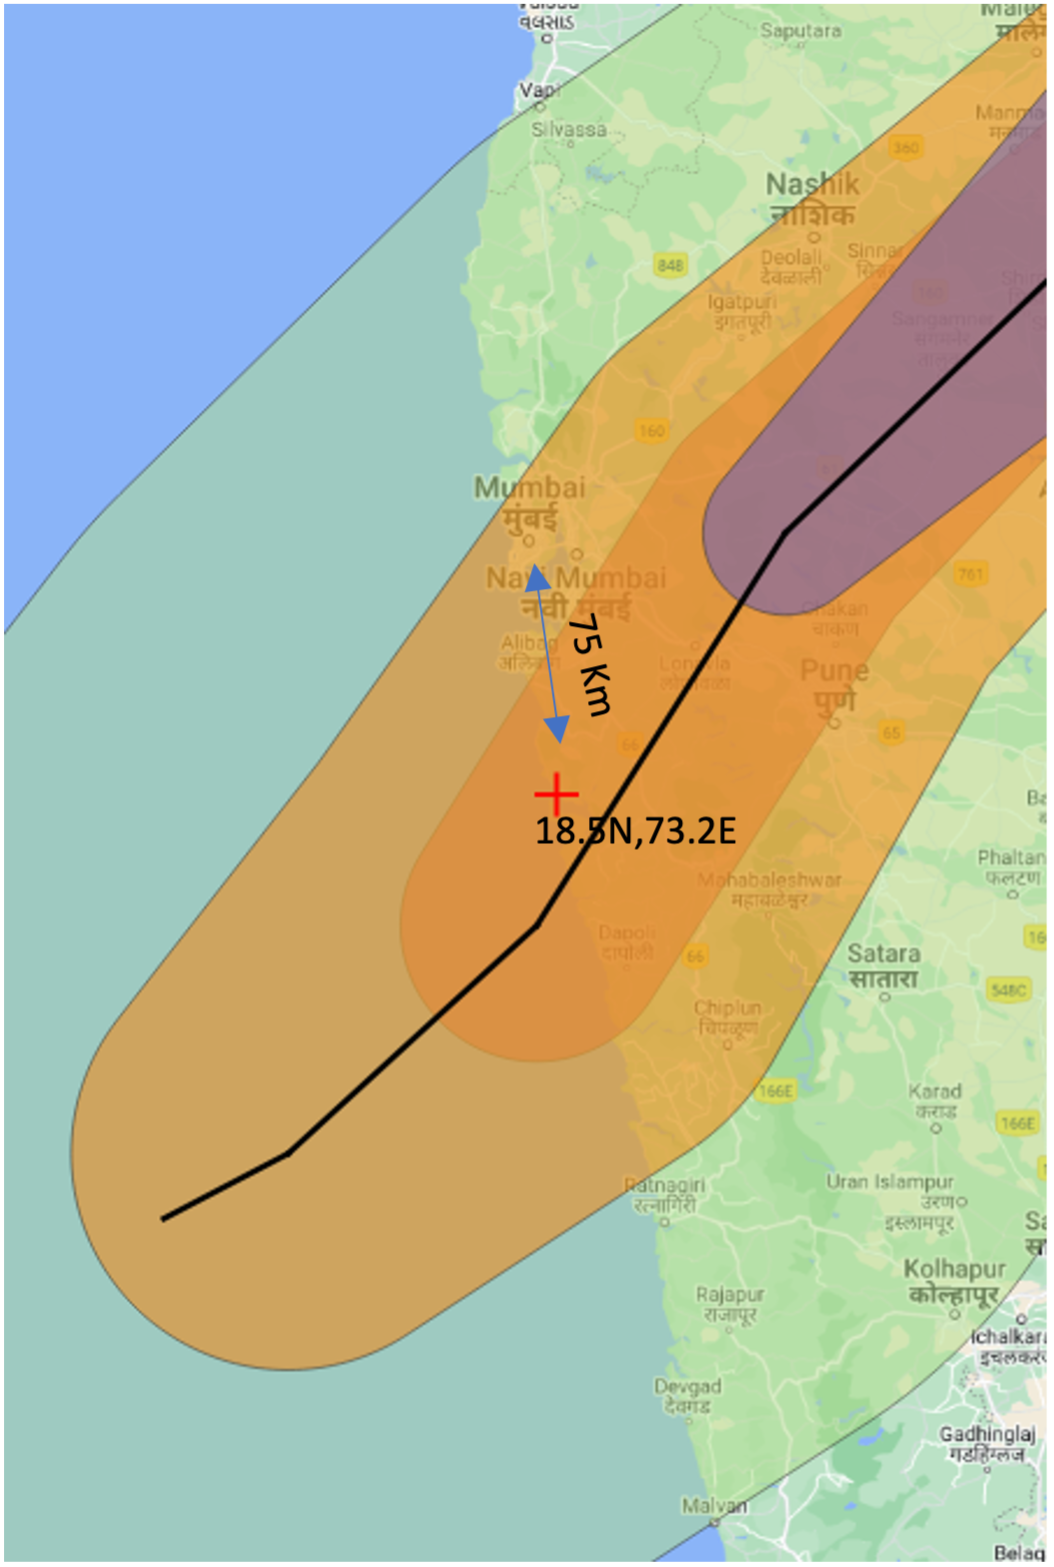
In early June 2020, for example, Cyclone Nisarga formed in the Arabian Sea and developed into the strongest cyclone to strike coastal Maharashtra since 1891. It made landfall on June 3, two weeks after Cyclone Amphan came ashore on the other side of the subcontinent close to the India-Bangladesh border along the northern edge of the Bay of Bengal, causing widespread damage in both countries. Nisarga made landfall just north of the historic town of Murud in the Raigad district, 75 km southeast of Mumbai (Figure 3). At its peak intensity, Nisarga’s 1-minute mean wind speeds reached 110 km/h and the India Meteorological Department (IMD) accordingly classified it a Very Severe Cyclonic Storm, its third highest category. Fortunately on this occasion, a slight eastward change of direction shortly after landfall shifted its track away from Mumbai and this, together with its rapid dissipation, ensured that the cyclone’s impact on the city was less severe than expected.

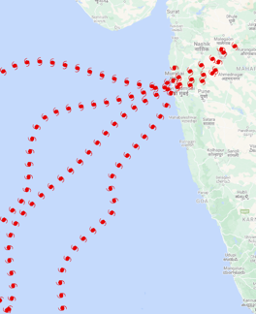
We undertook a study to see what kind of losses cyclones with tracks like that of Nisarga might cause. Figure 4 shows the tracks of some of the similar stochastic events from the Verisk Tropical Cyclone Model for India stochastic catalog that affect Mumbai and nearby regions. The insurable damage from the four sample events selected for the study could be as high as USD 3 billion

Assess Your Portfolio Risk Before Tropical Cyclone Events Occur
Recent studies (such as Albert, J., Krishnan, A., Bhaskaran, P.K. et al., 2022) indicate that climate change and its effects on extreme weather events have made high-intensity cyclones more frequent in the North Indian Ocean, increasing risk and vulnerability in coastal regions. Even bypassing storms can cause significant damage when they track up long stretches of the coast, delivering damaging winds to coastal exposures and heavy precipitation and flooding hundreds of kilometers inland.
Insurers and reinsurers need to be prepared for these events. The Verisk Tropical Cyclone Model for India captures the risk from landfalling and bypassing cyclones and from both wind and flood—a critically important feature given that both perils are covered in standard residential and commercial policies.
Our scientists developed simulated tracks by studying the storm characteristics of more than 600 tropical cyclones. Intensity is captured from multiple variables, including the storm’s central pressure, size, genesis location, forward speed, and direction, as well as the underlying terrain and land use in the region. Damage functions translate the intensity of the hazard affecting a structure or portfolio of structures into monetary loss. The damage is estimated separately for 19 construction and 114 occupancy classes. For industrial occupancies, more than 550 sub-components are implicitly accounted for.
Tropical cyclones have caused billions of dollars in damage in India. The growing number of properties on the coast, together with growing insurance penetration, make it essential for companies operating in this market to have the tools necessary to make an appropriate assessment of India’s tropical cyclone risk—and to develop the risk management strategies that will effectively mitigate the impact of the next catastrophe. Verisk models will help you identify accumulated risk segregated on a probable maximum loss (PML) basis by geographies, occupancies, or line of business and help you identify problems and evaluate growth opportunities.
Read about why India’s east coast is so tropical cyclone–prone.


