
Since the beginning of the COVID-19 pandemic in the U.S. insurers and reinsurers have had to manage the uncertainties about loss inflation and how they would impact claims. The cost of materials was particularly volatile during 2020 as the construction industry tried to find its way forward during lockdowns across the country. The uncertainty continued in 2021 as residential construction adjusted to meet new home buying patterns and materials supply chains adjusted to the new normal. In addition, labor shortages arose, caused by construction workers hesitant to return to work and the absence of casual migrant labor. All these factors led to unusual market pricing during 2021.
In this post, I will briefly review the national construction cost inflation data from 2021 to get an overview of the trend by looking at the average annual increases. We will review the construction labor and materials markets over the past year and the unusual conditions that contributed to the overall inflation effect. Then I will discuss how average price changes can minimize the volatility of the current construction market.
Was It Labor, Materials Prices, or Both?
We will start with a high-level look at how prices changed in 2021 compared to 2020. The average annual change for the past three years in shown in Figure 1. In this chart we are looking at the national average change for the Xactware® Material Basket of Goods (BoG) for construction and retail labor rates (RLB). We included 2019 for a pre-pandemic perspective.
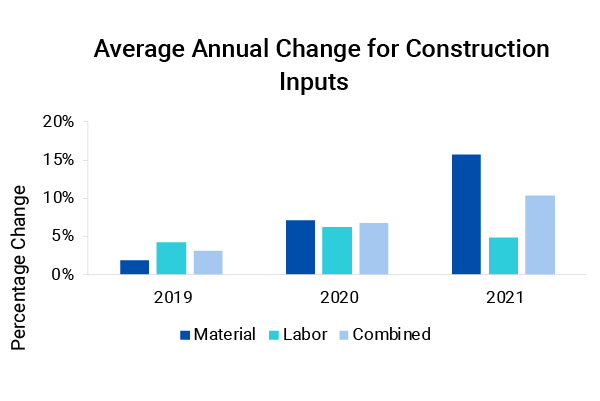
The annual change in materials costs is in blue, labor is in teal, and the combined index in light blue is a 50/50 weighted average of materials and labor. Combined cost changes in 2019 were modest compared to what followed, but they were also in line with long-term trends at 3%. If we look at the average annual cost changes for the next two years, we can see a steady trend upward driven by materials costs. This upward price movement is tempered by a relatively stable annual increase in labor costs centered around 5% for all three years. It was this stability that kept overall cost increases about 10% when materials costs were about 16% higher on average.
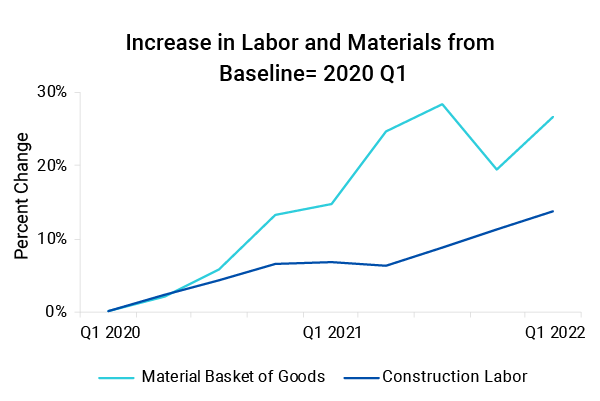
Beneath the annual average, there is more volatility when we look at the data quarterly. Figure 2 shows the quarterly changes in the same indexes from a baseline of Q1 2020. The change in labor increased at a steady rate over 2020 before holding steady through the first two quarters of 2021. The labor cost resumed a steady upward trend in Q3 2021. The changes for the Material BoG show some dramatic price shifts over the same period. There are significant things to note in this chart about materials costs. In Q1 2021, the cost increases paused their upward movement before spiking again in Q2 and Q3. There was a surprising drop in lumber costs in Q4, which had the effect of slowing down the annual increase in materials costs.
The drop in the materials index at the end of 2021 needs to be put in context. Large fluctuations in prices make it difficult to use typical year-on-year inflationary changes to understand the cost and value of the built environment. We need to consider what these changes mean in the longer term, consider how long they may last, and when the prices will revert to the long-term trend.
Materials Cost Inflation: Was It a New Price Level?
In the first half of 2021, the wholesale cost of structural lumber in the futures market was climbing fast before it made a hard decline at the end of Q2 2021. This was widely reported in the media but the day-to-day price movements do not match what is actually paid by the consumer. Retail lumber prices did spike a few months later but to a lesser degree than the daily wholesale prices in the futures market. The price increases were significant but make up just one component in the mix of materials used for constructing a home or office building.
Figure 3 shows the same Material BoG used in construction converted to a national index with a baseline=100 from Q1 2004 that we looked at last year. The range has been truncated from Q1 2010 to Q1 2022. The trend line from the baseline is in teal along with the trend projection through 2030. Over the past 15 years we have seen a steady increase in the cost of construction materials, which until 2020 was about 2.4% per year. The last time we looked at this chart, the index was on a steadily upward trend, but after two quarters there was a sharp reversal at the end of 2021. We will have to wait for the data to become available to see the full picture, but the price at a point in time is the market equilibrium. It is likely Q4 2021 was signaling a decrease in demand, or a supply chain that was catching up.
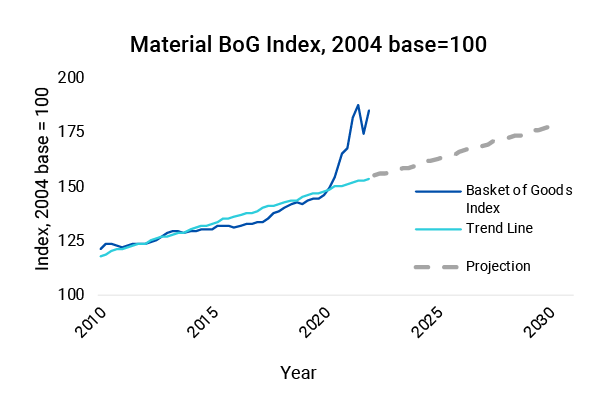
New sources of uncertainty in the broader economy and higher general inflation probably caused the shift upward in Q1 2022. While the cost increases in 2021 were driven by materials, there was variation in labor costs by state.
Labor Cost Inflation: Where Are the Surprises?
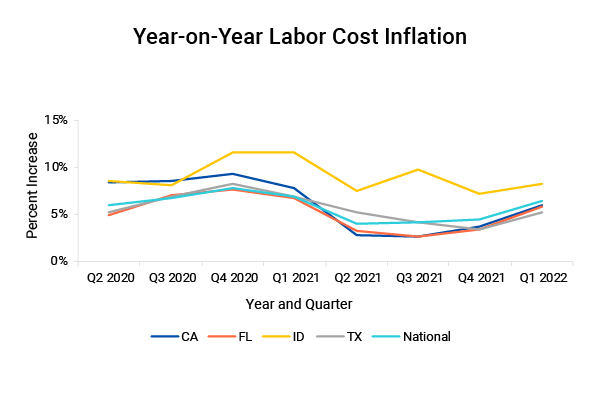
We saw earlier that the materials and labor weighted cost increase was about 10% nationally in 2021, but it varied at the state level from 8% to 13%. Figure 4 is a time series of retail labor rate (RLB) year-on-year cost inflation for the states we expect to be impacted by natural catastrophes along with the national inflation. Also in this chart is the state with the highest increase in retail labor, Idaho. The RLB represents a weighting of the various types of workers typically used in the construction of dwellings. The series starts in the second quarter of 2020 and includes the price movement for the next eight quarters. The labor rates for California, Florida, and Texas follow the national trend. The higher year-on-year increase for 2020, followed by the lower quarterly increases for 2021 are consistent with what we saw in Figure 1. Idaho, on the other hand, is suggesting demand surge but not the type we are used to seeing when a natural catastrophe creates a market disruption.
Basic real estate economics tells us that increased prices for real property is going to attract investment and Idaho has seen the highest median price increases in the country since the start of the pandemic. This has helped make it one of the most attractive markets to build in, so it should come as no surprise that Idaho has the highest average annual increase in construction labor costs.
Cost Inflation and Indexing for Exposure Management
Let’s put cost inflation in context. For two decades before the COVID-19 pandemic, exposure values in the U.S. could be kept current by applying the long-term average annual cost increase. In most cases the state experience reflected the national average, but there have been exceptions. For the past two years, we have seen that long-term averages are no longer sufficient to measure the increasing cost to rebuild a dwelling or structure.
Prices for all building materials have had significant highs and lows at different times since the beginning of 2020, making materials cost inflation the most significant cause of uncertainty when rebuilding after a natural catastrophe. Construction costs vary by region, construction practices, and typical dwelling design, so using the average annual construction index as shown in Figure 1 to trend historical building valuations can minimize—not eliminate—the impact of cost fluctuations.
We are still waiting to see signals that indicate whether the cost of materials is returning to the long-term average or stabilizing at a higher level. Based on the BoG index declining in Q4, it is possible that we could see the cost of materials revert to the long-term trend in the next one to two years.
Housing price growth has started to slow, and fewer home purchases are being made. Further disruptions are coming from the current Federal Reserve policy of raising interest rates to slow down economic growth and bring down inflation. This uncertainty is likely to dampen demand for construction of new buildings and renovations associated with the purchase of existing homes. Whatever the source, any slowdown in demand for construction will put downward pressure on construction materials.
While this blog focused on U.S. cost inflation during 2021, in my next blog, I will look at the current economic fundamentals driving the U.S. construction market for indications of where prices are going in 2022.
Read the blog "Keeping Up with Construction Cost Inflation in Europe"