In the first year of the COVID-19 pandemic, vehicle prices remained stable following long-term trends. In Q1 of 2021, the supply chain shocks that had been affecting so many other markets became a significant factor in the new and used vehicle markets.
In this post, we’ll explore the economic shocks that can affect vehicle prices and try to make sense of the interconnectedness of new and used vehicle sales. We will start by taking a high-level look at the U.S. new and used vehicle consumer price indexes, then take a closer look at the market shocks affecting those markets. We will finish with a discussion of continuing supply chain shocks that will likely affect the vehicle market in 2022 and beyond.
A High-Level Look
Price trends for new and used vehicles have remained stable since the end of the global recession of 2008-2009. Figure 1 shows the consumer price index data for used cars and trucks, new and used motor vehicles, and new vehicles. The baseline has been standardized for the entire series at Q4 1997=100. The top panel shows the average annual index, and the bottom panel shows the annual maximum quarterly index for the same period. The average annual index is the average of the quarterly indexes for a given year. The maximum quarterly index is the single highest quarterly index for a given year.
By comparing the two indexes we can get a sense of the annual price volatility during the year. For each series the index value can be thought of as the point at which supply equals demand—market equilibrium. The economics of vehicle price volatility are similar to labor market volatility underlying economic demand surge. The supply is limited in the short and medium term, so we can use this information to understand the stability of prices.
It is important to note that the trend in the upper panel has been similar for all indexes from 2010 through 2015. The trend annual maximum quarterly index values in the lower panel for the same time is also stable and doesn’t vary much from the annual average, which indicates there has been little volatility over the period.
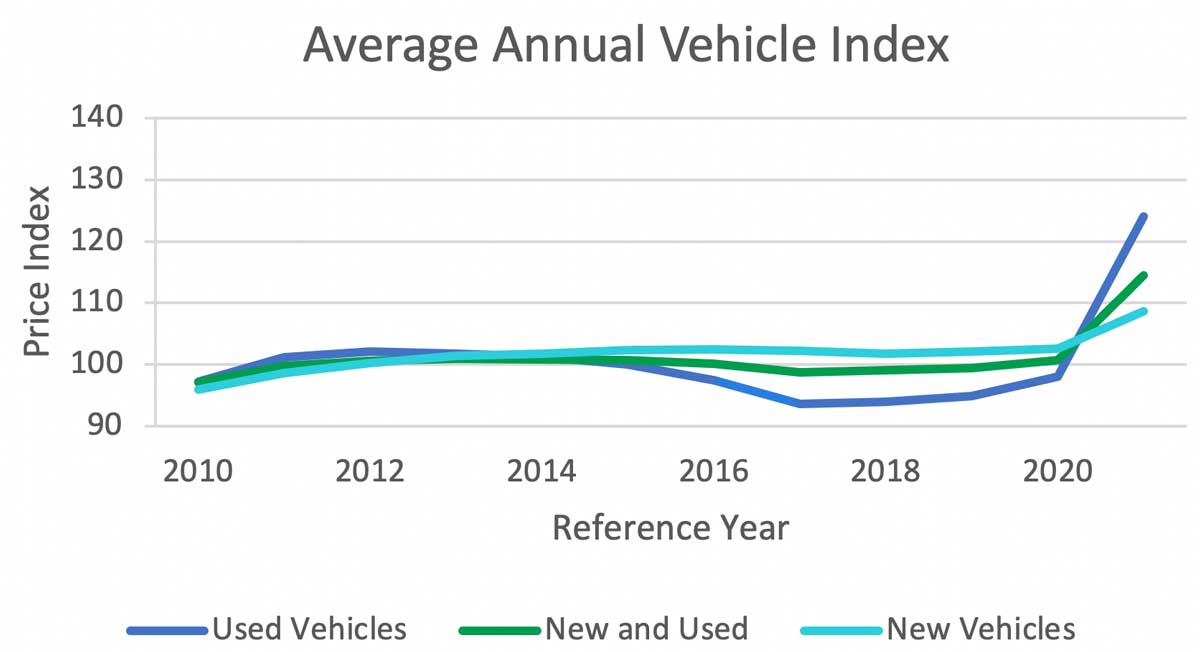
From 2016 to 2020 the average index trend for new vehicles remains stable, but the used vehicle index trends down until 2020. We will discuss this downward trend further in the next section. Starting in 2021, the sharp increase in prices in the new and used price indexes indicates a significant disruption in the market equilibrium caused by supply shocks, demand shocks, or both. The even higher maximum index values for 2021 in the lower panel suggest higher volatility than had been experienced in more than a decade. The highest values all occurred in Q4, so this appears to be a significant trend.
New vs. Used Vehicle Market
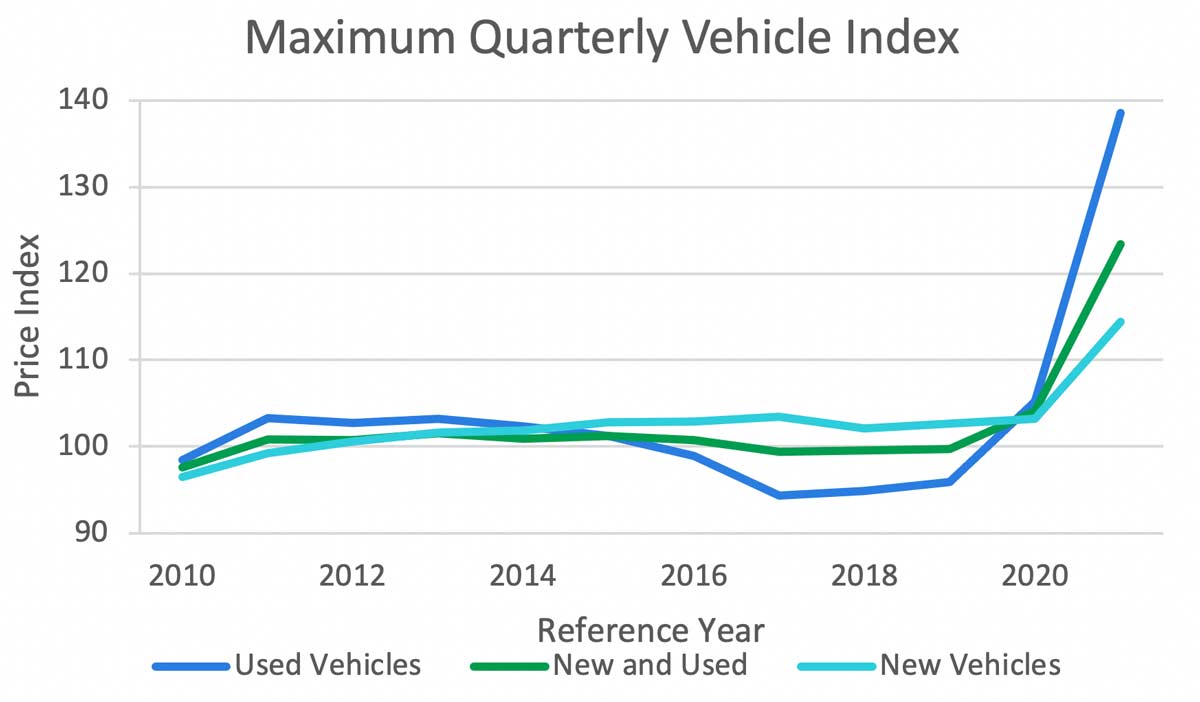
The used vehicle market supply chain is partially dependent on the new vehicle market. Whether you are buying or leasing a vehicle, the supply comes from a factory. When you are buying a used car, the supply comes from vehicles at the end of their lease, owners trading in a car to purchase a new one, or used vehicles being exchanged in the secondary market. Figure 2 shows the unit count for the sales and leases of new vehicles from 2010 to 2021. The data comes from the U.S. Bureau of Transportation, but the underlying source changes in 2010 so we are only looking at the most recent data. Most new vehicles, assuming a five-year car loan, could enter the used car market as trade-ins. The rest are on leases that typically last three years; we will assume that they enter the used car market as depreciated vehicles still under warranty.
New vehicle transactions were increasing after the global recession of 2008-2009 until 2015 when they leveled off at just over 21,000 vehicles per year before decreasing by 10% in 2020. This significant development leads to the problem in 2021. While the decline in 2020 can be attributed to consumers’ being reticent to buy new vehicles at the beginning of the recession, the continued decline in 2021 can be blamed on the decrease in vehicle production from COVID-19-related supply chain issues.
In addition to slowing new vehicle transactions, it appears that consumers are holding onto their used vehicles longer. Figure 3 shows the average age of vehicles from 1995 to 2021. Until 2016, average age is available by two categories, passenger cars (blue) and light trucks and SUVs (orange). The combined index for the whole period (green) is also included. The 2001 and global recession of 2008-2009 are indicated by the gray vertical bars.
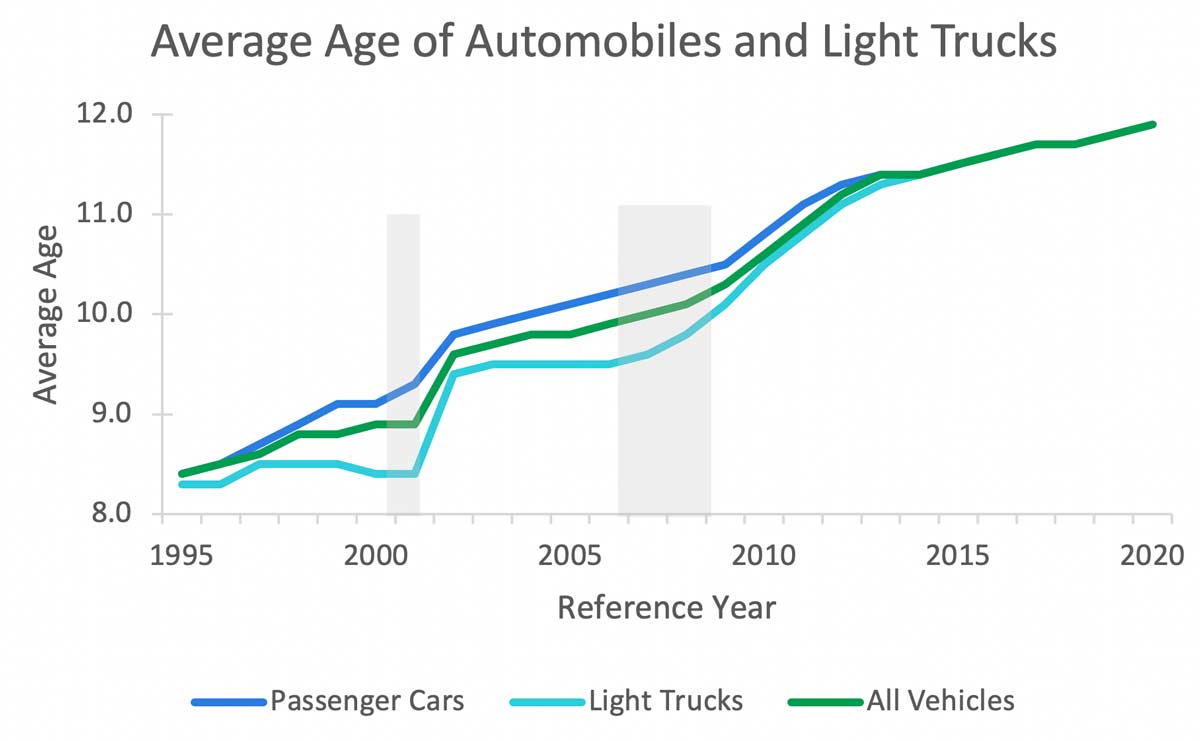
Focusing on the “all vehicles” average age trend, we first see a jump in the average age following the 2001 recession before it stabilizes for the next seven years. In the global recession of 2008-2009 the average age started increasing again during the downturn and continued its steep increase until 2013, when the average began stabilizing. For the periods when the average age is stable, the age distribution of vehicles is relatively constant. When it rises, the proportion of newer vehicles to older vehicles falls. The question is: What are the implications for vehicle costs?
Vehicle Supply Chain Constraint and the Supply Index
The vehicle indexes in Figure 1 show increases in 2021 from an average increase of about 6% in the new vehicle market to a dramatic increase of 27% in the used vehicle market. To gain some historical perspective, we can look at the average annual price change data for new and used vehicles sales. Figure 4 shows the year-on-year changes in the average annual prices for both series starting in 2011. Other than 2012, all the changes are positive and range 0-3%, indicating that the 6% for 2021 is a little outside the range. We know there has been a drop in the supply, but the price increase can also be attributed to the lack of discounts on manufacturer’s suggested retail price (MSRP). There are also reports that car manufacturers are keeping a close watch on the selling price of new cars to prevent gouging.
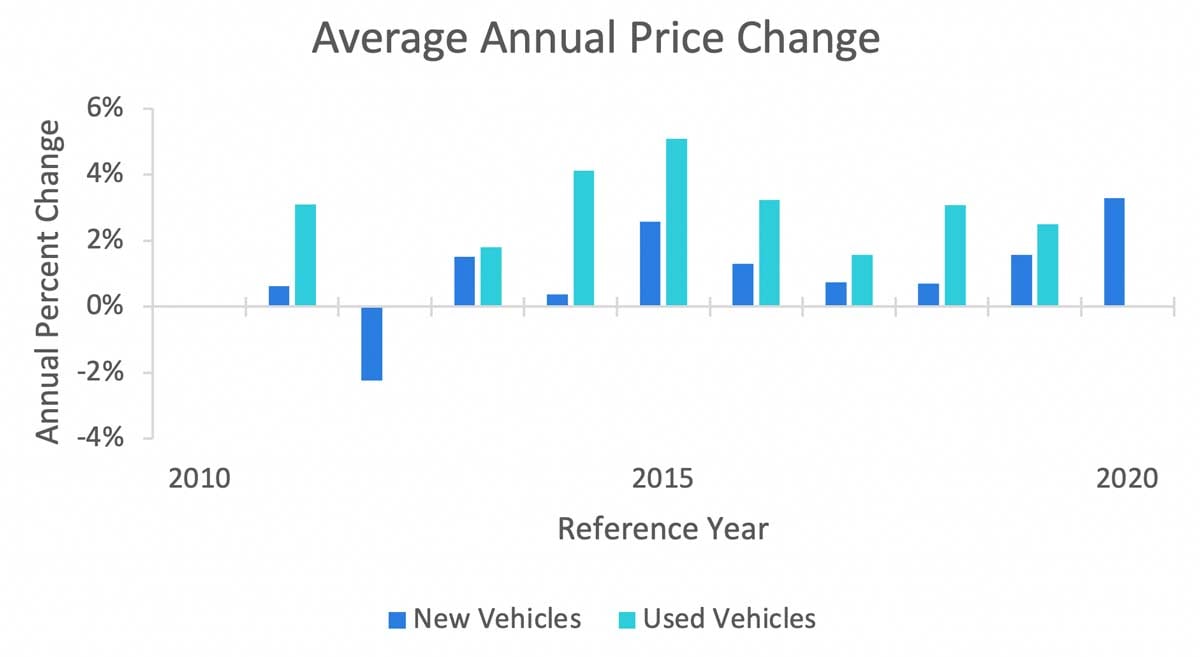
For the used car year-on-year change, it ranges 2-5%, but this can be a little tricky to interpret because it also depends on the age mix of cars sold in a year compared to the prior year. There’s a big difference between 5% and 27%, so we are going to consider how that can happen.
We know there has been a constrained supply of new cars in the range of 5-10%. Prices are capped at about MSRP by the manufacturers, so assuming our typical new car buyers are still in the market they turn to the next best thing—cars just coming off a lease. It is this increased demand for this segment of cars that begins a cascade of demand shifts in all used car markets down the line. There is a theory of behavior that explains what we are seeing, but it would be difficult to find data to back it up. It does, however, provide a scenario to understand where prices are going and how long it could last.
Bottom Line and Future Uncertainties
The slowdown in the growth of new vehicle sales has a delayed impact on the used car market supply chain, which will continue until production levels are restored. Much of this is dependent on semiconductor production for the auto industry.
But this isn’t the only supply chain constraint for an industry sensitive to economic shocks. On March 1, 2022, the car transporter Felicity Ace sank in the Atlantic after catching fire two weeks earlier, effectively eliminating 4,000 luxury vehicles from the supply chain. While the market for those cars was limited, these types of incidents are not. In 2019 the Golden Ray capsized off the coast of Georgia, for example, eliminating about 4,300 middle market vehicles from the supply chain.
COVID-19 demand shocks may have come from relocating workers needing new transportation, or even increased demand from workers switching from public to personal transportation. People do not usually buy cars every year, so some of this increased demand represents one-time purchases that may not show up in subsequent years. Other unknowns include the Federal Reserve Bank interest rate interventions to cool the economy and the upward trajectory of inflation triggered by economic uncertainty. Both have the potential to slow down demand.
Table 1 summarizes the annual changes for 2021 in the new, used, and combined vehicle price indexes for the U.S. The first row shows the average annual change, and the second row shows the Q4 year-on-year change. Which index do you use to update vehicle values for insurance? For the past 20 years each of these metrics has been equivalent, so it didn’t matter which one you used. It can be argued that all vehicles become used as soon as they leave the dealer’s lot, but it also depends on how policies are written and the age of the vehicles insured. Older vehicles may not have the same cover as newer vehicles, or vehicles with a lien; some policies provide for new car replacement.
| Used | New and Used | New | |
|---|---|---|---|
| 2021 Average Increase | 26.6% | 13.7% | 5.9% |
| Q4 2021 Year-on-Year Increase | 31.7% | 18.6% | 10.9% |
Unlike property indexes, the data used to create the index are heterogeneous and dependent on the ages and types of vehicles sold that year. The year-on-year index would be particularly sensitive to consumer tastes, so if I didn’t know the vehicle’s characteristics it would depend on my pool of vehicles.
If you are looking at the whole population of insured vehicles in the U.S., it might be safest to consider the new and used vehicle increase of about 14%. The year-on-year increase can be used not only for sensitivity testing but also as an indicator of where costs are going as we head into the new year. The underlying fundamentals indicate this is going to take some time to resolve. Just like the property market, we may be looking at instability, but not necessarily this magnitude of change for the next couple of years.
Get a free 30-minute consultation with Verisk’s Supply Chain Consulting Services Team