
As hurricane season 2020 progresses it’s a good time to look at how construction cost inflation is evolving so that we can get a better view of how post-event inflation could impact rebuilding costs. For insurance claims, the total increased cost of construction after a natural catastrophe is what matters. This increased cost can be broken down into two parts: the economic demand surge that impacts the affected area by creating an imbalance in the construction market and the overall cost inflation that comes from the combined regional and national market disturbances caused by other sources.
In my last blog post we looked at the economic fundamentals that drive demand surge, or the unexpected increases in labor and materials costs after a natural catastrophe. At the time there was nothing to indicate that we should expect anything out of the ordinary for the U.S. this season.
Post-Event Cost Inflation Comes from Labor and Materials
The construction sector comprises two major components: labor and materials. Post-event cost inflation is sensitive to the volatility of both components; therefore, inflation in any one area would be the weighted average of inflation from each component.
In a typical hurricane season—one without a pandemic adding to the uncertainty—national or regional labor cost trends can be used to measure the inflation level of the labor market separately from the local demand surge component. For construction materials, cost inflation can show up with a slightly broader impact.
Considering the supply chain sophistication in national building materials retailers, any local material demand disturbance in a hurricane-affected area is quickly propagated through the national materials markets. The price signal shows up in regional or national markets as a more muted inflation effect rather than a significant local demand surge signal.
This has been confirmed in multiple demand surge studies over the past 15 years. Those same studies show that in addition to national inflation effects for labor costs there is a specific demand surge effect at the county level after a demand shock, including increased repair work following a natural catastrophe.
On average, labor makes up 60% and materials 40% of the cost of construction of a new dwelling, so we are going to assume a similar weighting for overall cost inflation. Within each group there are components with cost trends that can be individually much more volatile. For example, under materials we could look at individual trends for construction lumber, drywall, roofing shingles, and so forth.
A recent press release from Xactware® illustrates some of this volatility with common lumber inflation from the September price list. The year-on-year change is 45% in the U.S. compared to 20% in Canada. While this is very significant it is important to remember that its total contribution to overall inflation is relatively small. For some repair work, construction lumber may not be required at all and this component inflation will have no significance. In other cases, it may be a greater proportion of required materials, but it will never be 100% of the cost.
How to Measure Construction Cost Inflation
Construction costs are frequently viewed as year-on-year increases. This metric provides an easy way to look at the trend over time without having to make assumptions about seasonality and other trends in the data. It is how the trends are seen in the Xactware press release and will also be used here to understand the aggregated cost trends of the materials and labor cost groups. I should point out that this is different from how post-event cost inflation is experienced in settled claims and repair work.
Claims are settled over time and the greater the amount of repair work needed, the longer this will take. For smaller and less complicated claims, we are going to assume that cost inflation in the first quarter after the event is applicable. For a more complicated claim, cost inflation two or more quarters after the event will apply. Overall this is a proportional weighting, but we normally assume a uniform distribution of claims settlement to simplify the view. I will look at the 2020 hurricane season experience in a future blog when the data is available.
Materials Cost Inflation
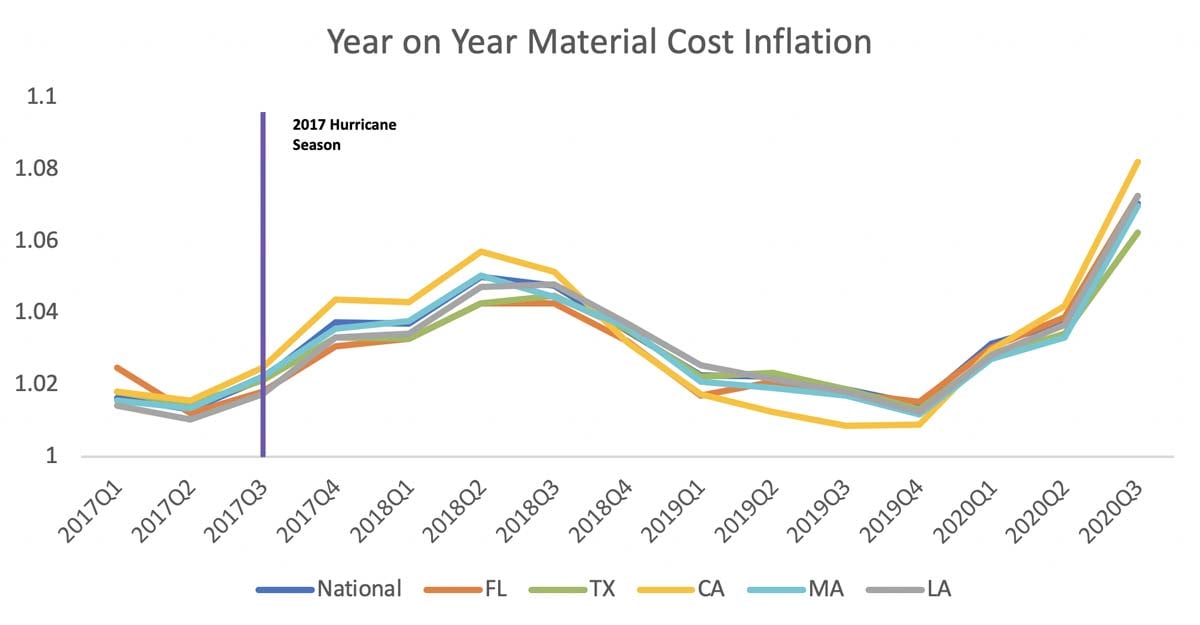
Figure 1 is a time series of materials basket of goods (BOG) year-on-year cost inflation for California, Florida, Louisiana, Massachusetts, and Texas along with the national trend. The BOG represents a weighting of the materials typically used in the construction of dwellings.
Using the assumption that the national trend represents normal cost inflation we can see that there is very little regional variation indicating materials cost inflation. The series starts in the first quarter of 2017 and includes the price movement after the 2017 U.S. hurricane season. The most significant increases during that time show up in California and coincide with construction after the wildfires of October 2017. It is still easy to see that the overall price trends for each area closely follow the national trend through the third quarter of 2020.
While not proof, this supports our hypothesis that sudden changes in demand for materials, on average, do not affect regional markets because the supply chain can easily handle the additional need without large fluctuations. Of the states affected by hurricanes Isaias and Laura, Florida, Louisiana, and Massachusetts closely follow the national trend, as can be seen in Figure 1, and may be the dominating factors for it. I will follow up with a closer look when the data is available.
Labor Cost Inflation
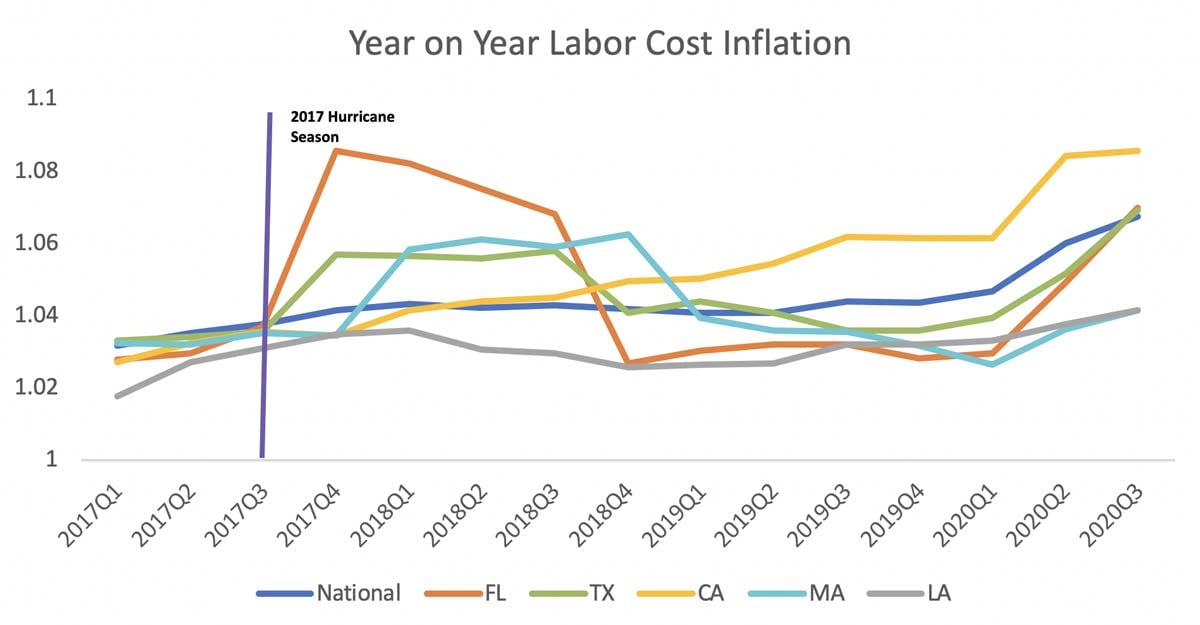
Figure 2 is a time series of retail labor rate (RLB) year-on-year cost inflation for the same states as Figure 1. The RLB represents a weighting of the various types of workers typically used in construction of dwellings. The series starts in the first quarter of 2017 and includes the price movement after the 2017 U.S. hurricane season. The most significant increases during that time show up in Florida and Texas, and the increases coincide with construction after hurricanes Harvey and Irma in late August/early September 2017.
Using the assumption that the national trend represents normal cost inflation we can see that regional variation in labor cost is showing up at the state level indicating the trend in prices includes a local demand surge component beyond post-event cost inflation. Consider the series at Q4 2017, one quarter after Harvey and Irma. The national year-on-year trend goes to 1.04 and remains stable for the next year and a half representing cost inflation. In Florida, the year-on-year trend jumps up to 1.08 before slowly declining over the next three quarters.
The difference between these numbers give us an indication of the impact related to cost inflation and the impact from local market disturbances. But the state-level trend is an average of the county-level data, including where the hurricanes struck and the counties that were unaffected. To get an accurate understanding of economic demand surge, we would have to dig deeper into the data. Over the same period the national and Louisiana trends remained relatively flat, albeit at different levels.
Weighted Construction Cost Inflation
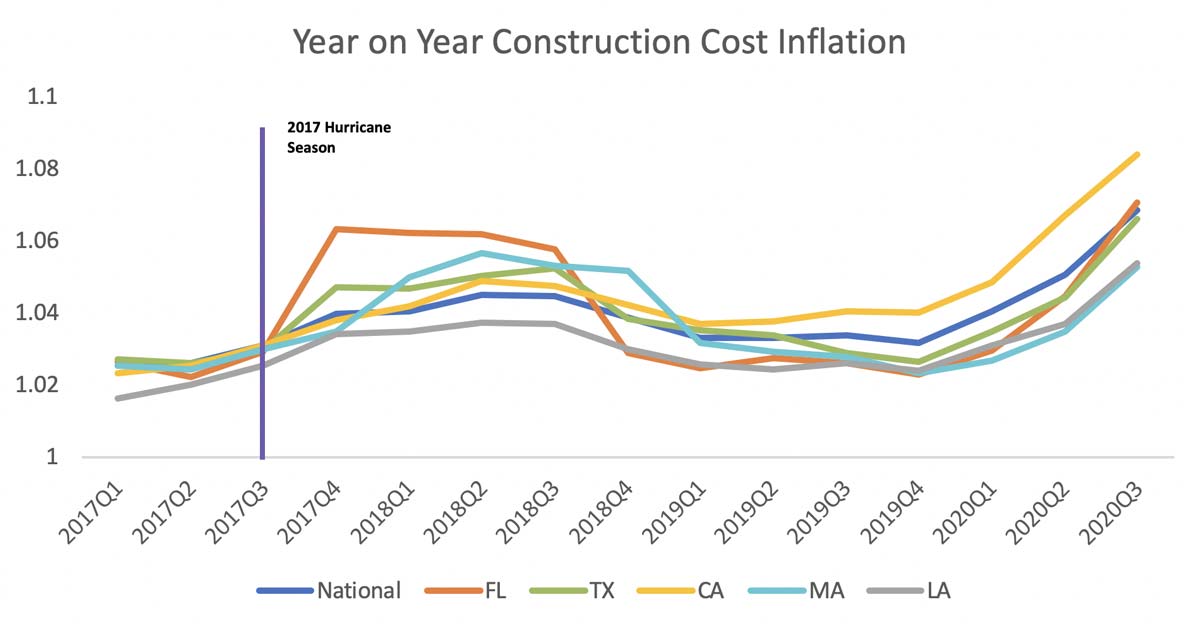
Figure 3 shows the results of using the 60/40 weighting of labor and materials cost inflation from Figures 1 and 2. In this case we must interpret the data a little differently. To see the increase in weighted cost inflation we need to focus on the national trend. The chart includes only four years of data to make it easier to see the trends, but if we go back five years to the start of 2016 the average national cost inflation is about 3% with a range from 1.5% to 6.5%. This range is within the parameters of AIR’s view of construction cost inflation for the past 20 years—an average of about 3% with a range from 1% to 10%.
In Figure 2 the regional labor trends are exhibiting the demand surge increase beyond the national inflation trend. When we combine it with materials inflation, the result is something closer to economic demand surge for the region, but again it is only the trend and doesn’t represent the actual economic demand surge experience. As mentioned earlier, economic demand surge is a local phenomenon and depends on the total amount of work required after a catastrophe and when a claim is settled. So, if the catastrophic damage is only in Miami-Dade County, for example, then how we experience demand surge at the regional or state level will be influenced by cost inflation and market disturbance in that county. This contrasts with how we observe cost inflation at the state or regional level before the event, which we have examined here, where the trend is affected by all the counties in the state equally.
How Does Cost Inflation Affect Claim Cost?
Let’s put cost inflation in context. Based on historical experience, if the same claim from hurricane season 2017 were to happen this year, all things being equal, I would expect the cost to be higher because of inflation. Because the cost inflation trend in 2017 Q3 was about 3% and in 2020 Q3 it is about 6.5%, any economic demand surge impact would happen in addition to this.
Is there currently anything out of the ordinary regarding economic demand surge? The answer right now is no. We have seen some fluctuations in national cost trends, but it is within our expectations based on our analysis of the data over the past 20 years. It is important to remember that economic demand surge in catastrophe modeling is an on-average effect for the industry. For individual property losses the impact can be more or less, depending on the extent and type of damage.
This view extends to loss experience from an actual event during hurricane season. We have seen here that if losses this season are going to require a lot of structural lumber there could be a large effect. But replacement of only a few roofs may not be affected by the large increase in the price of common lumber.
It is likely that the increase in the price of lumber is from both supply chain shocks and demand shocks. While not directly related to COVID-19, the choices made in response to the pandemic probably did cause the upward trend.
On the supply side, there is some indication that lumber manufacturing decreased early on in anticipation of decreased demand as the season progressed. This was indeed confirmed with an early slump in construction permits. The good news is that this is a business decision that can be reversed. On the demand side, three factors in particular have added to the unexpected demand for lumber:
- Homeowner’s DIY projects during stay-at-home isolation
- An unexpected uptick in demand from residential construction permits, housing starts, and remodeling
- Interest rates staying low
Except for the interest rates, the increases in the price of lumber could also put a damper on any of these sources of demand causing a reversal of the trend.
The current Federal Reserve policy to keep interest rates low to further stimulate the economy while we wait for the return to pre-pandemic employment levels is not going away anytime soon. On the supply side it will be interesting to see if higher prices in the U.S. relative to Canada will prompt an arbitrage situation where the costs are equalized. Whatever happens we will keep you informed if our view changes.