Catastrophe models have been widely used in the P&C (re)insurance community for many years now to understand the possible financial impact of low-frequency, high-severity events. In an earlier blog we discussed how catastrophe and casualty modeling differ. This post will compare catastrophe modeling and mortality modeling, which is a practice gaining popularity among life insurers and annuity providers.
Catastrophe models and mortality models share numerous attributes, including but not limited to:
- Statistical, computer-built models
- Real-world data and attributes represented mathematically
- Can create a “catalog” of a range of possible, but realistic, events or outcomes
There are, however, some critical differences between how these models work, why they’re used, and who uses them. This blog will explain some of these differences. If you have additional insights into the similarities and differences between catastrophe and mortality models, leave us a comment!
Overview and Purpose
Catastrophe models use computer programs and coding to represent natural and man-made catastrophes mathematically. Catastrophe model catalogs commonly contain between 10,000 and 500,000 simulations. Often, these simulations represent a year or an individual event. Organizations use catastrophe models to understand the possible financial impacts of a catastrophic event before it occurs.
Mortality models use computer programs and coding to represent causes of death mathematically. By using historical data, health and medical data sets, epidemiological research, and insurance information, they project mortality trend risk at an individual level to generate a catalog of possible life expectancy outcomes.
Mortality model catalogs also contain thousands of simulations to represent life-years, but each of these simulations is then synthesized to represent forward projections over the possible length of a human life or policy period. Organizations use mortality models to understand how the risk contained in life insurance, annuity, and pension portfolios or blocks of business may change over time and impact their expected financial risk.
It is important to note that mortality models are not catastrophe models, although life insurers are concerned with catastrophic events such as pandemics, earthquakes, and terrorist attacks that can cause substantial financial harm to their portfolio. These catastrophes are commonly referred to as short-term mortality shocks or excess mortality events in the life insurance world.
Structure
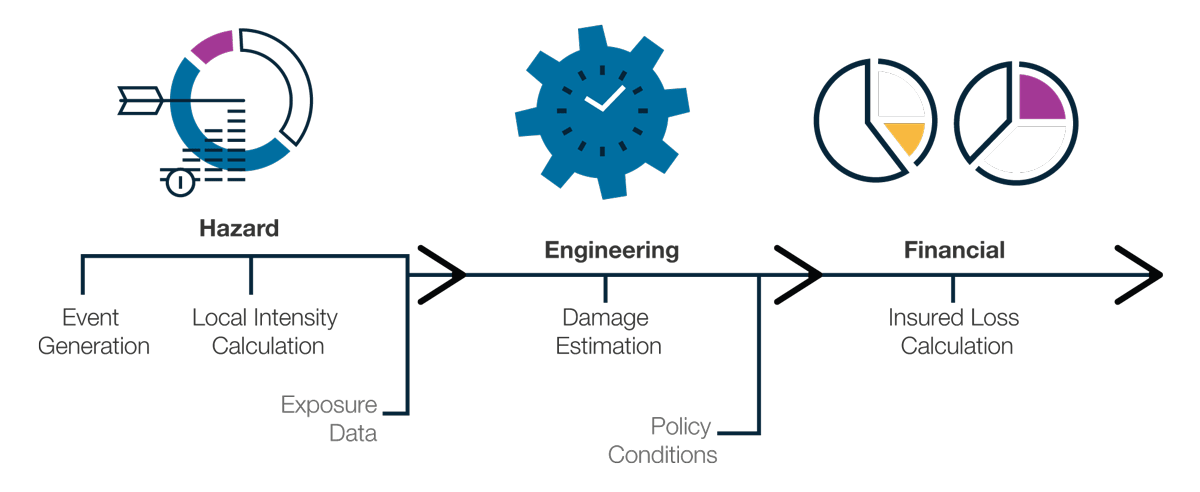
Catastrophe models follow the specialized framework in Figure 1:

- Event Generation: Large catalogs of simulated events capture the frequency, severity, location, and other characteristics of the entire spectrum of plausible catastrophes
- Local Intensity Calculation: For each simulated event, the intensity of the hazard is calculated at each affected site
- Exposure Data: Information about the property, replacement value, and physical characteristics is input into the model
- Damage Estimation: Physical damage is calculated for each affected exposure
- Insured Loss Calculation: Policy terms and conditions are applied to estimate insured losses
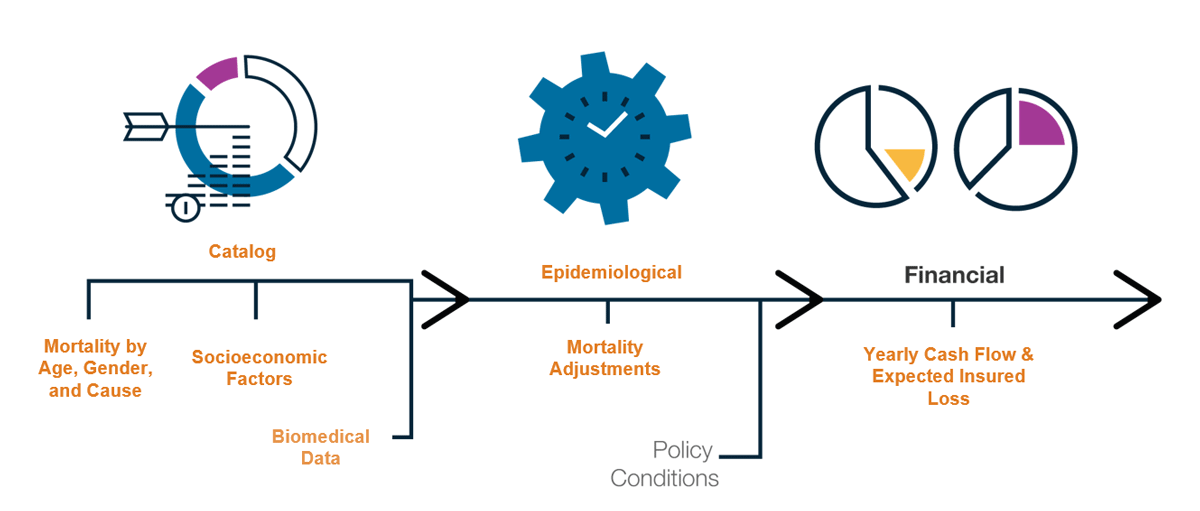
If you were to apply a catastrophe modeling framework to mortality modeling, it would look something more like Figure 2:

While catastrophe models rely on a catalog of natural or man-made events as well as their intensity and damage potential, mortality models rely on an understanding of mortality and causes of death by age, gender, and cause. In the case of mortality modeling, a series of adjustments is made to aggregate mortality data to understand impacts to life expectancy at an individual level based on socioeconomic, health, and lifestyle data, as well as whether the individual is insured.
Another significant difference between catastrophe models and mortality models is that catastrophe models simulate each calendar year independently or include minimal correlation. Mortality models are implicitly correlated due to the influence of systemic societal changes and medical advancements.
Users
Catastrophe model users include, but are not limited to:
- Catastrophe modeling teams and catastrophe modelers
- Risk analysts
- Brokers
- Reinsurance departments
- Chief Risk Officers
Mortality model users include, but are not limited to:
- ERM departments
- Research departments
- Actuaries and underwriters
- Chief Risk Officers, Chief Underwriting Officers, and Chief Actuaries
Output
Catastrophe model outputs include metrics such as average annual loss (AAL), exceedance probability (EP), and tail value at risk (TVaR). These metrics can be used on their own to make risk decisions, but in many cases are exported to downstream pricing or risk analytics tools, such as Touchstone Re™ or Analyze Re™.
Mortality model outputs include mortality rates, life expectancy, and mortality adjustment factors, which can then be used to compute stochastic cash flows and value at risk (VaR) metrics. Similar to catastrophe model outputs, these metrics can be used on their own to make risk decisions or exported to downstream tools.


