Modeling seismic hazard for a region like Australia poses a challenge because of the limited data, and yet cannot be taken lightly due to the relatively high risk, compared to other stable continental regions. The difficulty is apparent when each iteration of a national seismic hazard map for the country is very different from the previous version.
The most recent seismic hazard map released by Geoscience Australia in late 2018 (NSHA18) included many changes in both input data and model procedures. The most important changes include:
- Revising the local magnitudes of historical earthquakes and homogenization of magnitude scales to moment magnitude in the historical catalog; Geoscience Australia’s revision led to a reduction on average of 0.5 in local magnitudes prior to further reduction after homogenization of magnitudes to the moment magnitude scale
- Updating the suite of ground motion prediction equations
- Incorporating a fault source model that includes more than 300 neotectonic lines
- Incorporating a substantial set of seismic source models developed by various hazard research communities for Australia to deal with epistemic uncertainty in the source model
Compared to hazard results from the 2012 national seismic hazard map, the hazard at the 475-year return period has decreased 50%. While the significant reduction in hazard was primarily driven by the change in the historical earthquake data, updates to the other components have also had an important impact on the hazard result. For example, inclusion of the background seismicity model may reduce the hazard in the seismic source zones defined in the 2012 model, while the smoothed seismicity model tends to increase the hazard in historically active “hotspots,” and reduce the hazard elsewhere. Incorporation of the fault model, however, significantly increased the hazard at longer return periods in many locations in southern Australia, including the capital region.
AIR has incorporated much of the important information used in the NSHA18. Therefore, compared with the models AIR released in 2012 and 2017, the overall model hazard and risk have also significantly decreased. However, there are differences in how the information is synthesized and used in the development of the hazard model, which may cause a significant difference in hazard results.
Different Moment Magnitude (Mw) Homogenization Procedures
Not only is there a challenge due to the lack of data from the low seismicity, but also a challenge due to discontinuity in magnitude calculation for local magnitudes before and after around 1990 when there was a gradual shift in the methodology of how local earthquake magnitude was calculated for Australian seismic networks.
Geoscience Australia performed a multi-step local magnitude unification process and an Mw homogenization using a regression equation based on synthetic data. While the procedure to correct local magnitude of older earthquakes seems reasonable, it was not statistically rigorous as it did not use any original waveform data and lacked knowledge of how the original magnitude was calculated, and therefore can potentially introduce systematic bias in the synthesized historical data.
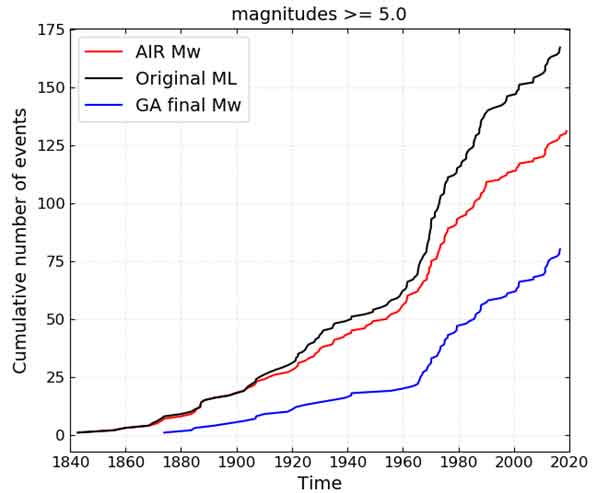
AIR separated historic data before and after 1990 for regression to homogenize the magnitude to moment magnitude to avoid the potential impact of bias in the modified magnitude. AIR found that correlation between local magnitude and moment magnitude is better when two groups of historical data were analyzed separately. This difference in procedure, shown in Figure 1, results in a higher number of earthquakes with magnitudes 5.0 and larger in the AIR historical catalog, mostly in the pre-1990 data.
In addition to the difference in magnitude homogenization, AIR also used a different procedure to de-cluster the historical data to remove aftershocks and foreshocks. AIR used a modified version of the Reasenberg (1985) method, tuned to fit the Australia data, to de-cluster the historical catalog. This is different to the approach used by GA, which involves experts’ judgement and a Gardner Knopoff (1974) style de-cluster. The impact due to the difference in declustering approaches on seismicity rate estimation is relatively small.
Difference in Ground Motion Model
NSHA18 preselected a pool of ground motion prediction equations (GMPEs) based on the residual analysis of each individual GMPE and strong motion data available in Australia and developed a logic tree for weights on the individual GMPEs based on an experts’ elicitation process. Much of the strong motion data available in Australia have been used to develop local ground motions specific for Australia.
One of the main concerns AIR has in the procedure is that the available strong motion data in Australia are very limited and are mainly weak motion data from small earthquakes (mostly 3.8 to 4.8), which typically would not cause significant damage to buildings. Such a limited data set may be insufficient to provide rigorous guidance on what GMPEs are suitable for Australia. To address such concerns, we have included a set of ground motion prediction equations most recently developed for stable continental regions such as the central and eastern U.S. (i.e., the NGA-east GMPEs, Goulet et al., 2018) to more conservatively account for the large epistemic uncertainty in ground motion simulation for stable continental regions.
In addition, AIR considered eastern Australia as part of a stable continental region for ground motion modeling purposes, distinct from a typical active crustal region. GA’s ground motion model for the non-cratonic region (eastern Australia) favors GMPEs developed for active crustal regions.
Difference in Seismic Source Model
In addition to the seismic source model developed for the 2012 national seismic hazard model (NSHA12), NSHA18 included nine third-party and research seismic source models (SSMs). These SSMs are combined along with the fault source model to create a complex logic tree of 20 branches with weights assigned based on experts’ opinions.
AIR did not adopt all third-party SSMs; the excluded SSMs have insufficient information to be fully evaluated or have a source zone scheme that is too small for reliable seismicity rate calculation, and other reasons. In addition, instead of simply combining different SSMs using a logic tree, AIR integrates different source zone models and modeling methods to create a self-consistent seismic source model.
NSHA18 assumes that b-value, a parameter in the Gutenberg–Richter relationship, is an invariant within Australia, whereas AIR allows variable b-value from region to region. Based on AIR’s comparative analysis of NSHA18, it seems that the rate of seismicity in NSHA18 is most influenced by earthquakes of small magnitude such as 3.0 to 3.5. AIR put more trust in historical earthquakes of magnitude 4.0 or larger in the determination of seismicity rate. The difference in how the b-value and activity rates are determined can have a significant impact on hazard at regional and local spatial scale.
Other Differences
Some other minor differences that may affect the model include the addition of 1.5 years of historical data post NSHA18 development; the collection of more moment magnitude data for magnitude homogenization analysis; expansion of the fault database to include new fault data published since NSHA18; and the uniform upper bound magnitude for all inland source zones.
What can be expected from both AIR and Geoscience Australia’s updates is that the hazard will be significantly lower compared to previous versions.
Register now for the AIR Asia-Pacific Virtual Conference 4-6 August to learn more!