
In 1607, a few years after Shakespeare wrote of a tide in the affairs of men, England and Wales experienced devastating coastal flooding along the Severn Estuary. This may possibly have been caused by a tsunami, but most coastal flooding in England and Wales is caused by storm surge from an extratropical cyclone (ETC).
AIR has updated our ETC Model for Europe by adding a new Great Britain storm surge component that replaces our separate Great Britain Coastal Flood model. The storm surge domain has been expanded to include the entire coastline of England and Wales, so in this blog we will only consider ETCs impacting these two countries.
AIR’s model finds that loss-causing ETCs in England and Wales are a regular occurrence, about five or six per year, but the annual frequency of loss-causing coastal flood events is only two or three (although most of these are small and not memorable to insurers). Contrast this with the U.S., where almost 90% of loss-causing hurricanes are accompanied by storm surge losses.
To understand why surge is more likely to accompany a hurricane than an ETC, we need to consider the physical mechanisms of how storm surge occurs. Applying physics improves the precision and accuracy of a catastrophe model and we will demonstrate this by showing the merits of a more physically based model that emphasizes the physical connection between ETCs and storm surge in England and Wales.
Storm Surge Physics
Storm surge coastal flooding occurs when the sea level far exceeds local tide levels. The main cause of this surge is the stress exerted on the sea by the storm’s winds, which push the water overland. Tropical cyclones, such as hurricanes in the North Atlantic, tend to be more intense than ETCs, which means they tend to exert a greater stress on the sea in the area of strongest winds. However, ETCs tend to be larger and slower-moving, so they have the potential to affect larger areas of the coast for up to several days.
Coastal orientation and bathymetry also determine the extent of flooding, as a large volume of water forced into a narrow and shallow bay has nowhere to go but up and inland. Low-lying areas along the southeast and Gulf coasts of the U.S. are particularly vulnerable to surge from tropical cyclones, while the coastal regions of Europe’s North Sea are prone to surge from ETCs. Historical coastal flooding in Britain has tended to occur along the east coast of England, caused by ETCs moving from north to south over the North Sea. Historical wind damage, however, tends to be caused by ETCs coming across the Atlantic from the southwest. This disconnect suggests that even though ETC winds cause storm surge, if the wind speeds and flood depths do not impact the same exposure, the financial losses from wind and surge may not be highly correlated.
Testing the Correlation Between Wind and Surge Losses
For this blog we intentionally broke the association of wind and surge losses for every event in AIR’s newly updated ETC model for Europe and redistributed the surge losses randomly with the wind losses. We then calculated an Aggregate Exceedance Probability (AEP) curve and compared it with the one produced by AIR’s model, which retains the wind-surge correlation. This procedure was repeated thousands of times to generate confidence intervals for every point on the AEP curve. The same experiment was performed with AIR’s Hurricane Model for the United States. The 95% confidence bounds on insurable losses from the uncorrelated models are plotted in Figure 1 for (a) England and Wales and (b) the U.S. Also plotted are the AEP curves from AIR’s actual (physically correlated) models.
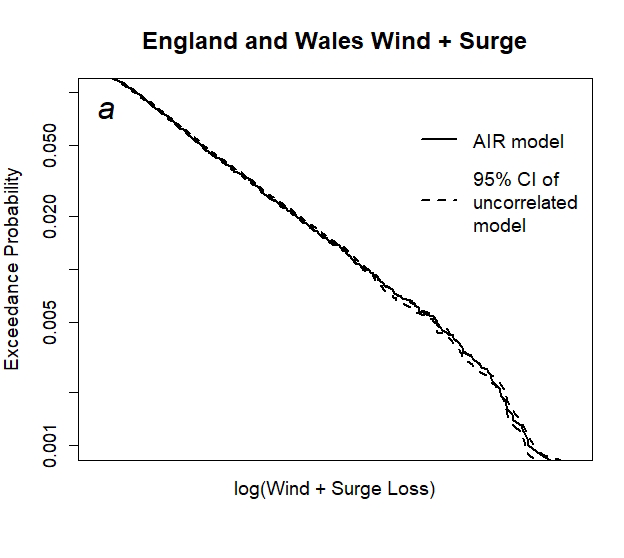
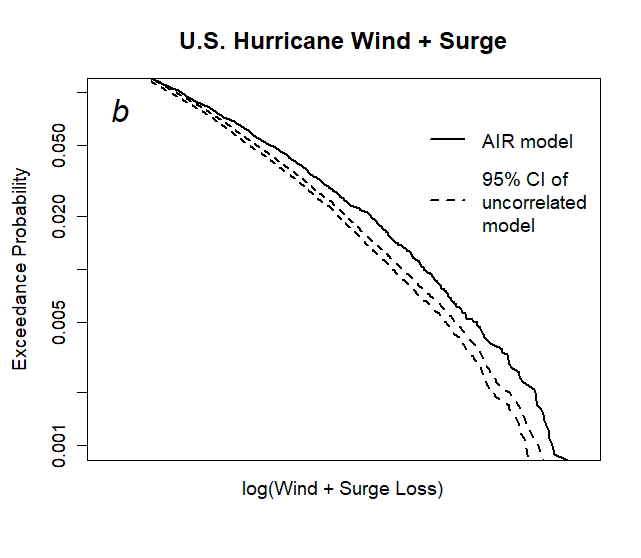
For England and Wales, the AEP curve of the physically correlated model lies between the 95% confidence intervals of the uncorrelated model, while for the U.S., the combined wind and surge loss from the physically correlated model exceeds these confidence intervals over the 0.1-10% exceedance probability range. This result suggests that wind and surge losses in England and Wales are uncorrelated, but those in the U.S. are positively correlated, with higher wind losses associated with higher surge losses. This result is supported by four histograms in Figure 2. Histograms (a) and (c) show the frequency of wind and surge losses in England and Wales, while (b) and (d) show the same for the U.S.
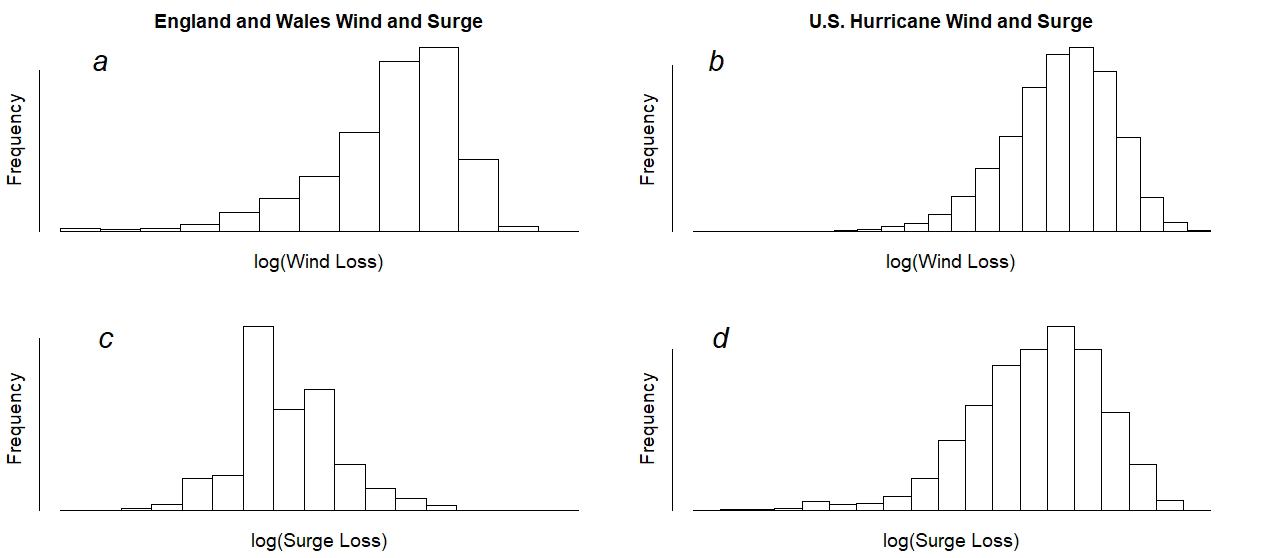
Surge losses in England and Wales tend to be lower in magnitude than wind losses, and the shape of its histogram is not as skewed as it is for wind. Contrast this with the U.S. where the magnitude and shape of the surge and wind histograms are similar (Figure 2).
Extreme Wind Plus Surge Loss on the Severn Estuary
Nevertheless, at event level (as opposed to the aggregate level), a physically correlated wind and surge model will yield more accurate losses. In the UK, insurance policies pay out for a combined wind plus surge loss, and losses from reinsurance policies that are constrained to a named storm will be more accurately captured by a model that has physical cross-peril correlation.
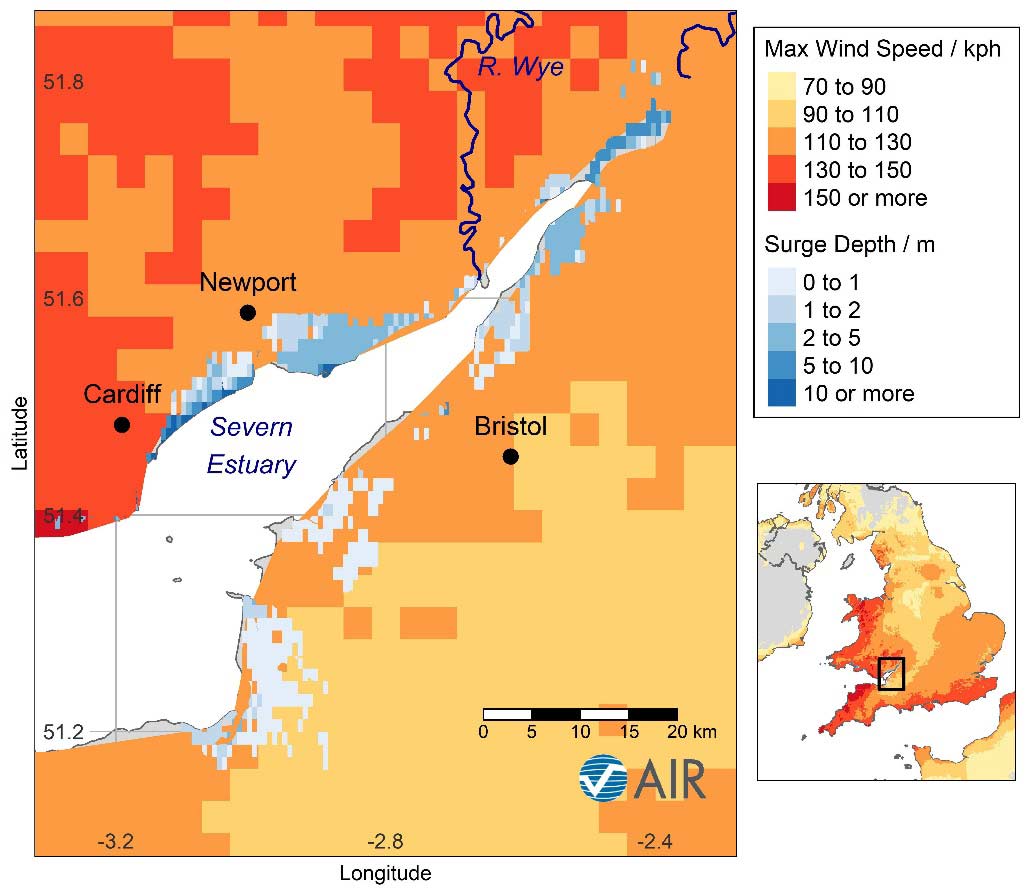
Figure 3 shows the wind speed and surge depth footprints caused by a simulated event from AIR’s updated ETC model. This event causes an estimated insurable loss of GBP 3 billion to England and Wales, 46% of which is from storm surge. The nationwide footprint in the lower right panel of Figure 3 suggests that high winds around the southwest of England and Wales squeezed the ocean through the Bristol Channel and over the Severn Estuary causing flooding in the Newport, Cardiff, and Bristol areas, as revealed by the main panel. Note significant surge losses also occur in Swansea.
More Physics, Less Waste
Our statistical sampling experiment has demonstrated that large wind and surge losses in England and Wales tend to be uncorrelated, while those from U.S. hurricanes are positively correlated. It has also shown that a model that includes more physics and less stochasticity will give more precise results. A catastrophe model is an inherently stochastic modeling solution, but good models adopt both physics and stochasticity. Physics-laden models provide greater certainty to the insurer, which could reduce the capital an insurer may unnecessarily hold and premium they may unnecessarily charge.
Our knowledge of physics today is based on the work of another talented 17th century Englander, Sir Isaac Newton. Although Newton was a mathematical modeler and Shakespeare a poet, both aimed to describe the essence of nature and "admit no more causes of natural things than are both true and sufficient" (Newton, 1713). Like Nature itself, a well-formulated, physical model can be very powerful and even spring a surprise or two.
References
Bryant, E. A., Haslett, S. K., 2002, Was the AD 1607 coastal flooding event in the Severn Estuary and Bristol Channel (UK) due to a tsunami? Archaeology in the Severn Estuary, 13, 163-167
Newton, I, 1713, Rules of Reasoning in Philosophy, Principia, 2nd edition.