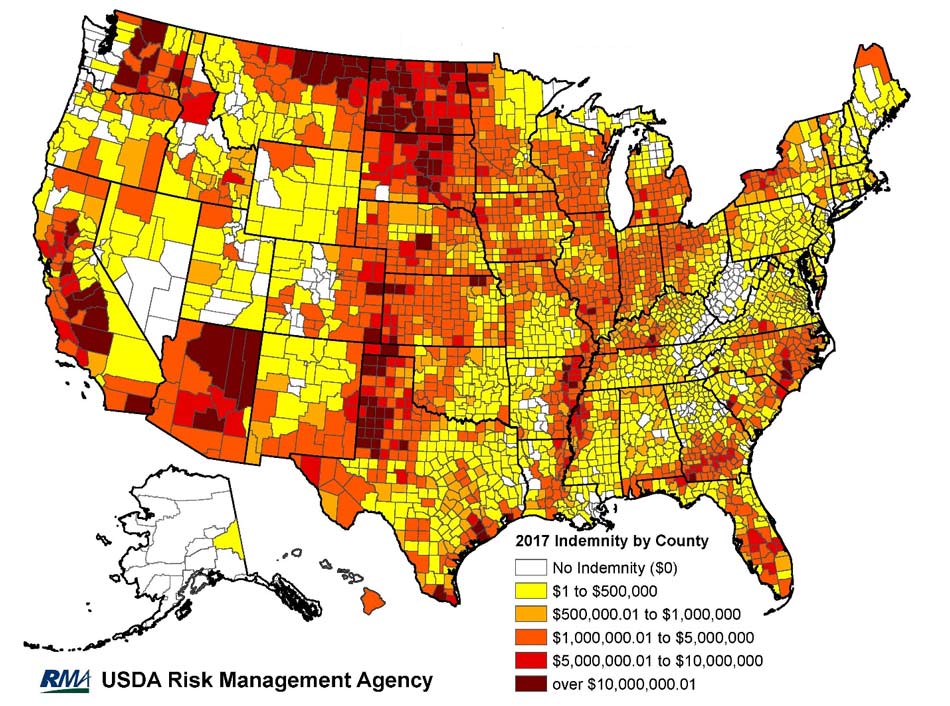
With farmers reeling from the combined effects of the Great Depression and the Dust Bowl, the U.S. government introduced the first national Crop Insurance program in 1937. In the U.S. today, Multiple Peril Crop Insurance (MPCI) is a partnership between private insurance companies and the federal government.

Leveraging our understanding of weather and catastrophe modeling, AIR debuted an MPCI Model for the U.S. in 2007, and we have been updating it since 2010. It was the first of its kind—considering county-level yields patterns, using weather in the yield-detrending process, and developing stochastic outcomes to give a wider range of losses to the reinsurance industry in a single software platform. Over the past 11 years, the model has been updated to reflect observed events (good years and bad) as well as to explicitly model more crops, adapt to structural changes to the federal crop insurance program, and address client market questions with more functionality.
Large-Scale Loss Events
Since the release of the MPCI Model for the U.S. in 2007, there have been several notable events for both yield and commodity price. In 2008 price spikes at the start of the year drastically changed the crop market, altering revenue expectations for farmers, and increasing insurance liabilities and premium in the market. This was coupled with low harvest prices, triggering major losses for some books of business. In 2012 the Midwestern drought generated massive yield losses and high loss ratios, with yield losses across the Corn Belt, resulting in the highest loss ratios the program had experienced since 1989. Since 2014, the industry has been experiencing price declines coupled with low-price volatilities.
Our understanding of the effects of hazards on losses continues to grow as such events occur. The MPCI Model for the U.S. has helped the industry understand these risks as they are occurring during the growing season and in the larger context of the 10,000-year stochastic yield and price catalogs. As they are incorporated such events give a broader perspective to the catalogs on yield and price outcomes and associated losses.
The Market Is Continually Evolving
Structural changes to the program also require the model to continually evolve. The 2011 Standard Reinsurance Agreement brought new designation opportunities for primary insurance companies and different possible returns to reinsurance layers. The 2014 Farm Bill brought a variety of new policy types and options to market. The model was updated over the years to incorporate these significant changes.
The loss modules in the updates to the MPCI Model for the U.S. always take these types of changes into account as quickly as data are available. The introduction of three yield and price volatility catalogs in 2013 and the addition of a fourth in 2016 are prime examples of how price volatility has become a key factor in reinsurance decisions and how the model provides clients with what they need to price treaties effectively each year. As premium rates adjust year to year, the premium rate mask feature in CATRADER® allows reinsurers to ensure their exposure is reflective of the current year’s market share.
Updates to the AIR MPCI Model for the U.S. include:
2007
- Released the first MPCI Model for the U.S.
2010
- Updated exposures
- Updated policy conditions
- Updated prevented planting losses
2013
- Updated yield and price catalogs
- Increased number of catalogs from one to three based on price volatility
- Added four new modeled crops
2014
- Added 2012 drought to historic recast
- Updated exposure information
- Updated policy conditions
2016
- Updated yield and price catalogs
- Added a fourth catalog with low volatility
- Added four new modeled crops and types
- Included SCO, STAX and YE
2018
- Improving AWI methodologies for specialty crops
- Updating yield and price catalogs
- Adding PRF as modeled crop
- Incorporating higher resolution industry exposure data
Early in its second decade, the model is already seeing many exciting changes. The Agricultural Weather Index™ (AWI) modeling approach will incorporate more expertise on crop growth modeling; pasture, rangeland, and forage will be an explicitly modeled crop; yield and price data will incorporate two more years of observed experience; higher resolution industry premium and loss data are being included in the loss calculations.
Beyond 2018, we anticipate incorporating new crop science techniques and modeling more specialty crops; adding more financial modules for new programs; using the latest data to accurately predict premium changes across the program; and generating event links between the North American Crop Hail models and the upcoming Canada MPCI model.
The AIR U.S. MPCI model has become the independent pricing model for the crop insurance industry


