In July 2017, I was in AIR’s Hyderabad office having a lively discussion with underwriters from one of the leading private insurance companies in India on how to assess flood risk. We were trying to arrive at different flood metrics that insurance companies can derive using the new probabilistic flood hazard maps AIR has developed for India, when their phones started ringing like crazy. The reason for the panic was severe flooding due to excessive rains in Gujarat and Rajasthan—the heaviest rainfall the region had received in roughly 100 years. Our guests immediately advised their agents to stop underwriting any further risks in Gujarat and hurried to shut down their policy issuance portal.
According to data from the Indian Meteorological Department, between July 1 and 28, Gujarat received 559.4 mm (22 inches) of rainfall, far more—indeed 65% more—than the 339.6 mm (13 inches) expected on average for that period. The prolonged rainfall had major impacts on roads, crops, human lives, and livestock. In addition, there were heavy rains in Mumbai, West Bengal, Rajasthan, and Northeast India in 2017, all of which caused damage to property, infrastructure, and crops.
Economic losses from floods have been increasing over recent decades, so it is more important than ever for insurance companies to focus on risk management by selecting risks that will likely not have an adverse impact on their overall portfolio. The flood hazard maps that AIR has released for the Indian insurance market are available as a geospatial layer for use with our Touchstone® platform, and can help:
- Identify whether a location is in a flood zone
- Indicate which flood return period a location falls into
- Provide return-period flood depths associated with a location
- Pinpoint the distance of a location from the 100-year return period flood zone
- Set underwriting guidelines
- Enable accumulation of exposures within different flood hazard return period zones
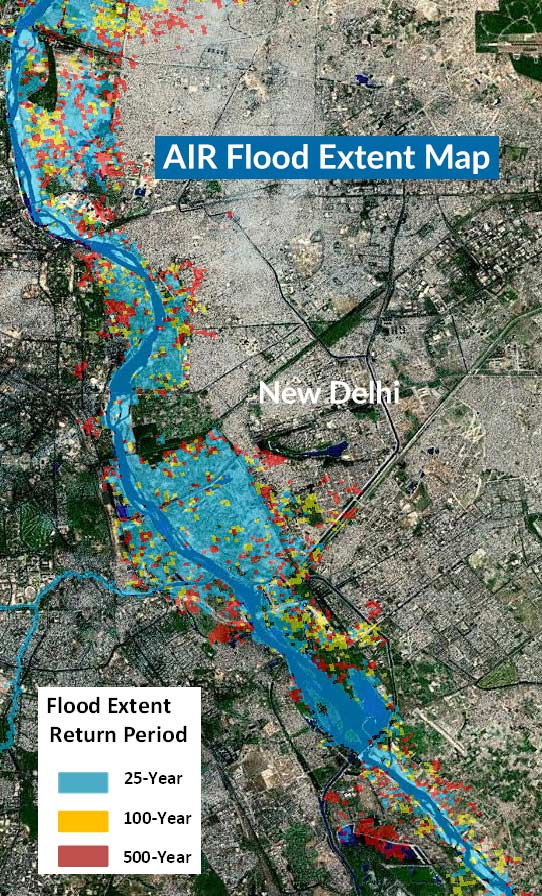
Figure 1 shows the AIR flood extent map for Delhi for the 25-, 100- and 500-year return periods.
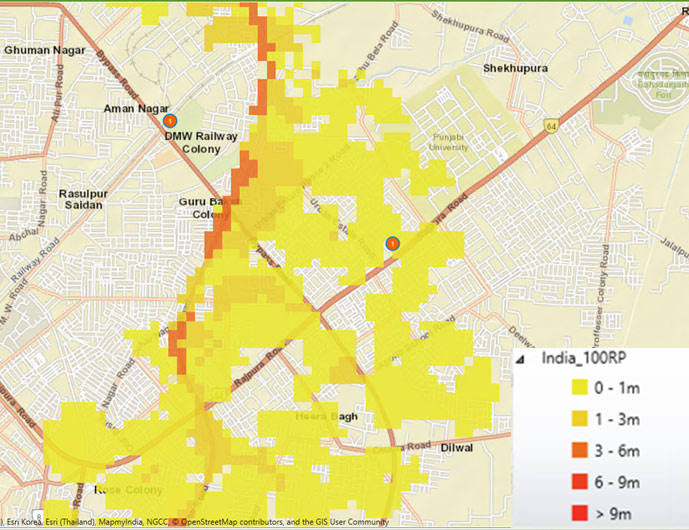
If an insurance company’s underwriting guidelines mandate that they are not to underwrite any risk that falls within a 100-year return period flood zone, they can use the flood hazard map to make decisions. Figure 2 shows a single location being underwritten in the city of Patiala. Since the location falls within a 100-year return period flood zone the underwriter can decide not to accept the risk, following the guideline, or to price it higher, if they are willing to accept the risk.
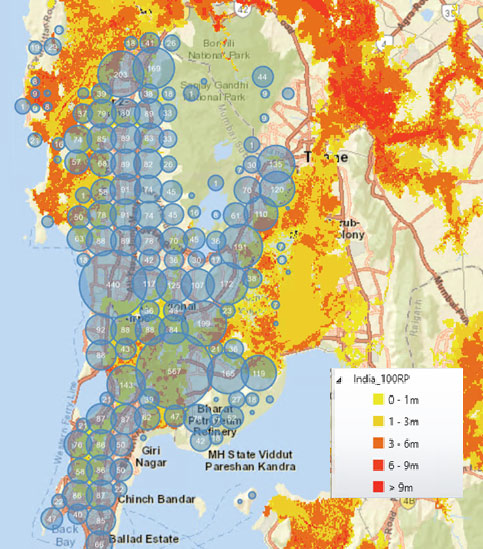
Insurance companies can also use the flood hazard maps for accumulations. For example, if you look at the city of Mumbai using accumulation techniques, you can identify the amount of exposure in terms of replacement value present within each return period zone. Since the flood depth information is available, exposures can be accumulated to see how much replacement value is at risk within each flood depth band. Companies can also specify a damage percentage for each height band to assess the potential loss.
These flood hazard maps use the same underlying flood mapping methodology available in AIR’s probabilistic inland flood models and capture all sources of riverine flooding, including from tropical cyclones. They enable a sophisticated understanding of the threat posed by complex river networks and can help you manage accumulations, determine whether a risk meets underwriting guidelines, and develop effective portfolio management and risk transfer strategies. AIR flood hazard maps provide location-level visual intelligence to support informed, confident underwriting decisions and risk-based pricing.
Learn more about AIR Probabilistic Flood Hazard Maps for India in Touchstone